
 2 months ago
19
2 months ago
19
The post Ethereum-Based Altcoins Record Massive Price Pump! What’s Next? appeared first on Coinpedia Fintech News
With the increased price volatility in the Ethereum price, top altcoins have regained momentum and recorded a significant uptrend in their respective portfolios. Further, the ETH price has added 9.03% within the past seven days and 63.08% over the past 30 days.
On the other hand, top Ethereum-based tokens such as Fetch.ai (FET) and SingularityNET (AGIX) have recorded a jump of over 42% and 39% in their respective portfolios, highlighting a robust bullish sentiment in the market.
Fetch.ai (FET) Price Analysis:
The FET price traded in a closed range between $0.6218 and $0.9036 for a brief period, indicating weak buying and selling pressure in the market. As the market volatility grew, the Fetch.ai price successfully broke out of the resistance level, where the token traded sideways for over a week.
After multiple attempts, the bulls recorded a jump of 66.76% before facing rejection below $1.9064. Following this, the price displayed a neutral trend for the next five days. Recently, the bulls regained momentum and jumped approximately 100%, indicating a bullish influence in the crypto space.
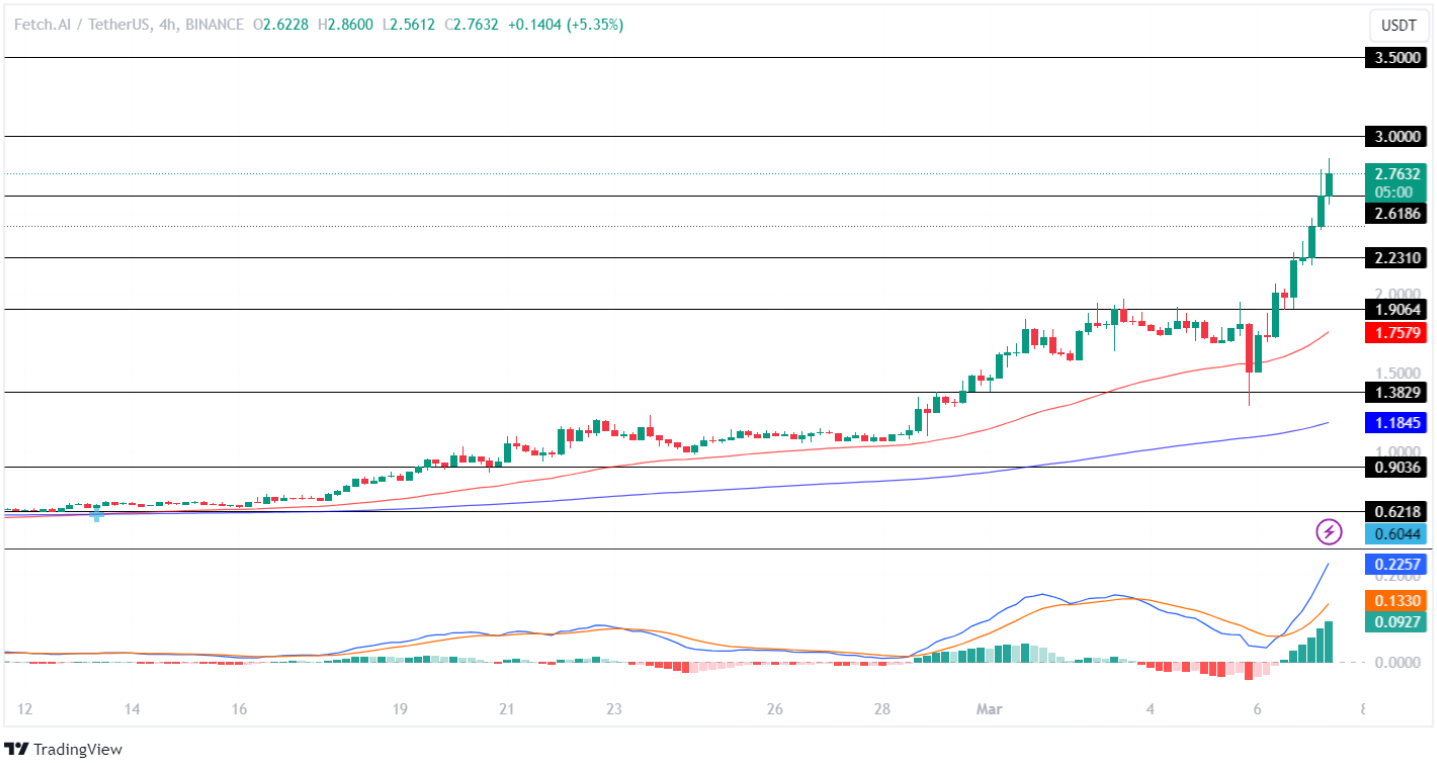 TradingView: FET/USDT
The technical indicator, MACD, displays a constant rise in the chart, indicating an increase in the buying pressure in the market. Further, the averages show a significant rise in the chart, suggesting a positive price action for the altcoin in the coming time.
Considering the present market sentiments, if the bulls continue to gain momentum, the FET price will prepare to test its upper resistance level of $3.5 by the weekend. Negatively, if a trend reversal occurs, the price will trade under a bearish influence and test its low of $1.906.
SingularityNET (AGIX) Price Analysis:
The SingularityNET price traded in a narrow space between $0.286 and $0.323 for a period, after which the price recorded a jump of 32% in valuation. Following this, the token displayed a neutral trend for a while, indicating a cool-off in the price action.
After this, the bulls regained momentum and jumped 47.35% before facing rejection below $0.812. Following this, the AGIX token traded sideways for the next eight days. As the market volatility grew, the price recorded a jump of 39.10%, after which it traded in a closed range for four days.
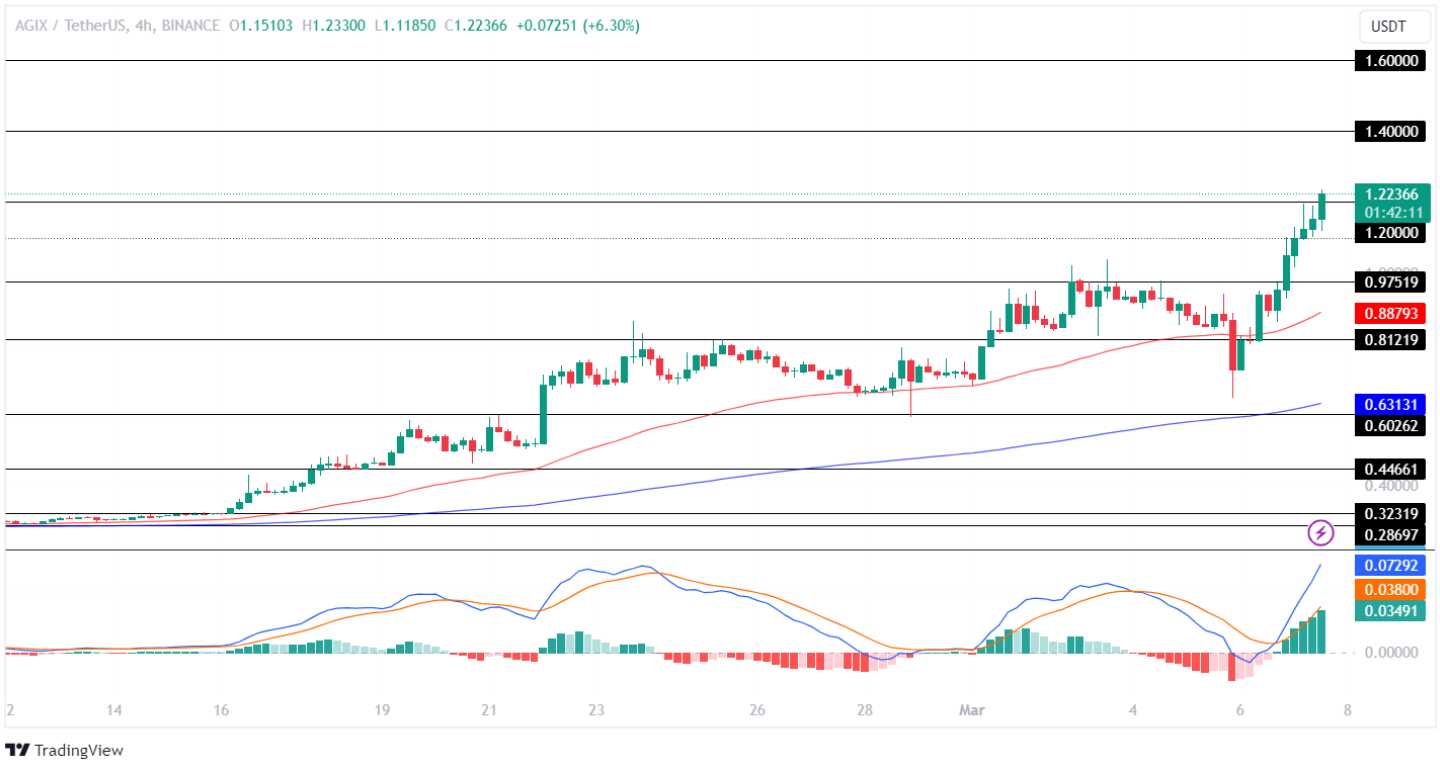 TradingView: AGIX/USDT
After testing its low of $0.602, the bulls regained momentum and recorded a jump of 87.78%, indicating a bullish influence in the crypto industry.
The MACD displays a constant rise in the green histogram, highlighting an ongoing massive price action in the crypto industry. Moreover, the averages show a sharp rise following the bullish convergence, suggesting the price will continue gaining value in the coming time.
If the market holds the AGIX price above the resistance level of $1.20, the bulls will continue to gain momentum and prepare to test its upper resistance level of $1.60 over the upcoming weekend. Conversely, a bearish reversal may pull the price toward its low of $0.812 in the coming time.


 English (US) ·