
 3 weeks ago
29
3 weeks ago
29
- Ethereum closed above the key $2,350 pivot level, signaling a potential structural shift.
- The SuperTrend indicator flipped to Buy for the first time since September.
- ETF inflows and stronger momentum suggest growing market confidence in ETH’s recovery.
Ethereum is starting to show signs of life again. On the daily chart, the asset recently printed two notable bullish signals, and traders are paying attention. First, ETH managed to close above the long-watched $2,350 pivot level. Then, almost immediately after, the SuperTrend indicator flipped to a Buy signal for the first time since September.
When those kinds of signals appear together, they tend to spark discussion across trading desks. It doesn’t guarantee a rally, of course—but it does suggest the long stretch of downward pressure might finally be losing its grip. For months, Ethereum has been stuck in a slow grind lower. Now the chart looks… different.
Ethereum Reclaims a Multi-Year Pivot Level
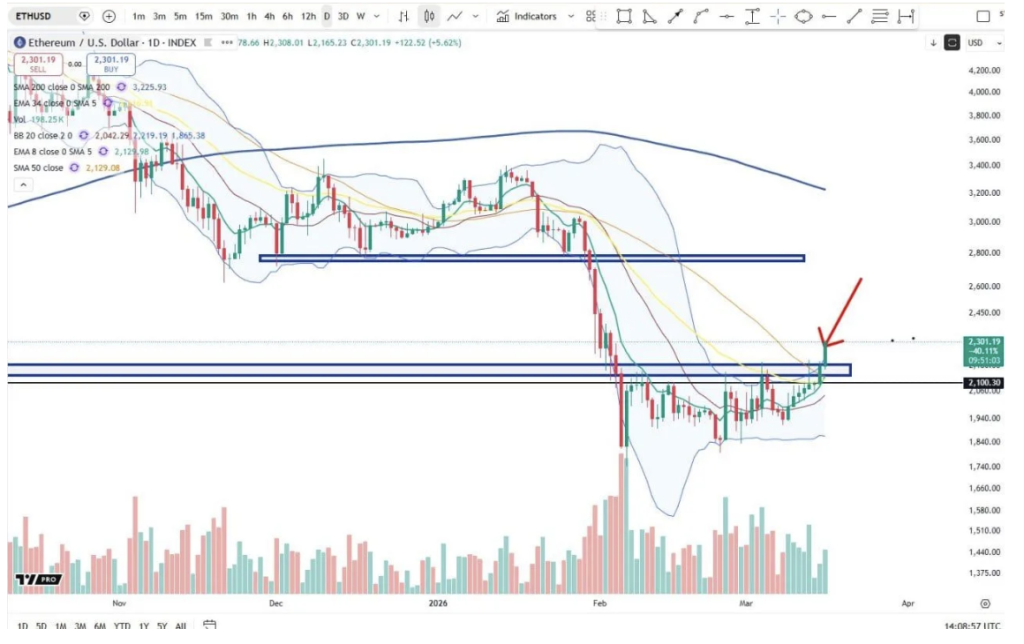
One of the biggest developments came when Ethereum pushed above the $2,350 area on the daily chart. Analyst Cheds highlighted this level on X, calling it a critical pivot that has influenced price action for more than four years.
The move didn’t come out of nowhere. Over the past few weeks, Ethereum has been steadily recovering from its February drop. That recovery allowed price to climb back through a resistance block between roughly $2,100 and $2,150.
Breaking that zone mattered. For weeks it had acted as a ceiling, rejecting every attempt to push higher. Once ETH closed above it, the market structure shifted slightly. What used to be resistance now becomes the first layer of support traders will watch.
Momentum also strengthened during the breakout. Ethereum moved above several short-term moving averages, and the breakout candle came with noticeably stronger volume. In plain terms—buyers finally stepped in with some confidence.
Earlier this year, ETH had dropped sharply from the $3,000 region before stabilizing near $1,900 to $2,000. Since that bottoming phase, the chart has quietly built a series of higher lows. That structure laid the groundwork for the latest push upward.
If Ethereum can hold above the $2,150 region, the next resistance band on the chart sits around $2,600 to $2,700. But before traders start talking about those levels, the market needs to prove one thing: that this breakout can actually hold.
SuperTrend Indicator Flips to Buy
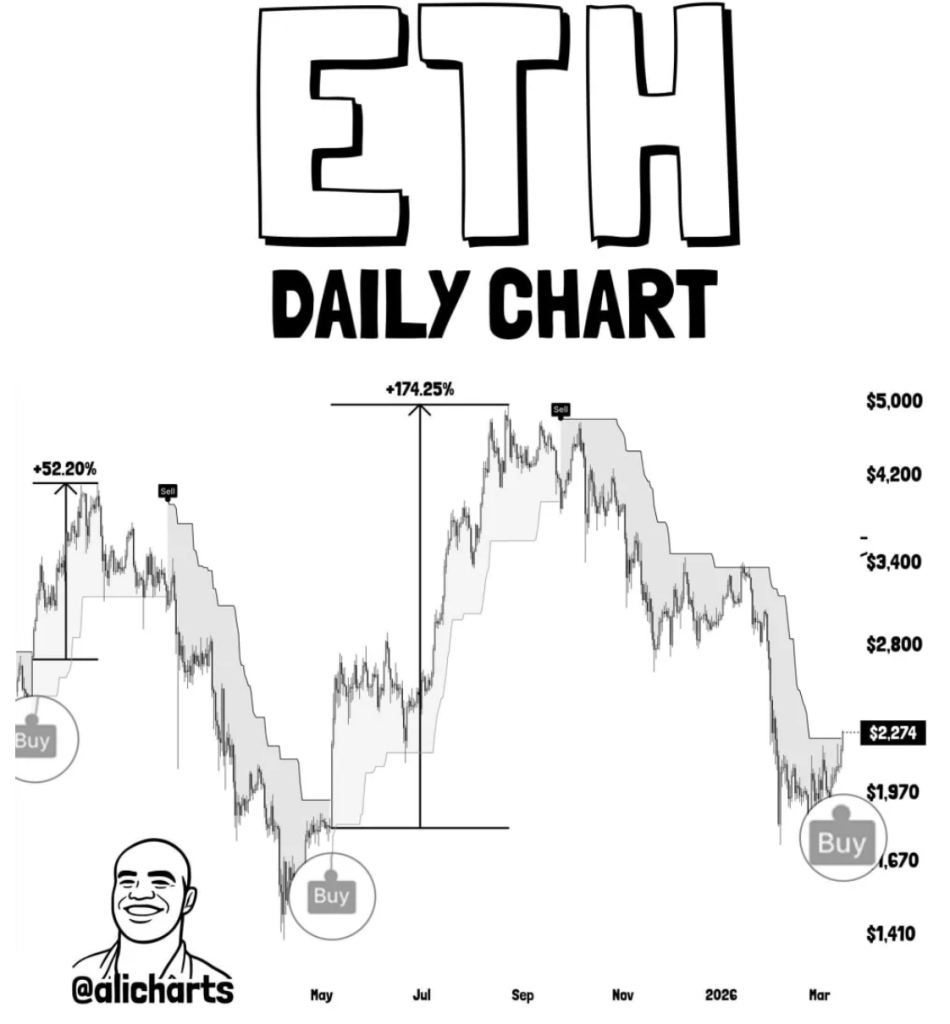
Alongside the price breakout, Ethereum has also triggered a technical reversal on the SuperTrend indicator. According to analyst Ali Charts, the daily chart has printed its first SuperTrend Buy signal since September.
That’s notable because the indicator had stayed firmly in Sell mode for months. During the downtrend from late 2025 into early 2026, Ethereum consistently traded below the descending trend structure that the indicator tracks.
Now, that structure has flipped.
The shift suggests bearish momentum has weakened and that the market could be entering a new directional phase. It doesn’t mean a straight rally is guaranteed—markets rarely move that neatly—but it does show the trend pressure has changed.
Ali also pointed out that Ethereum recently reclaimed the $2,200 level after spending 39 days below it. Recovering a lost support zone often marks a meaningful shift in short-term structure. Traders tend to see it as a sign that buyers are regaining control.
Institutional Demand Adds to the Bullish Narrative
Beyond technical signals, there are also signs of growing institutional demand. According to Ali Charts, Ethereum exchange-traded funds have accumulated roughly 83,000 ETH over the past three weeks, representing about $193 million in inflows.
That type of steady accumulation doesn’t usually move markets overnight. But it can provide a foundation for longer-term momentum.
Historical comparisons have also fueled trader optimism. Previous SuperTrend Buy signals on Ethereum were followed by strong rallies—one produced a 52% move, while another triggered a surge of more than 170%.
Of course, past performance doesn’t guarantee the same outcome this time. Crypto markets have a habit of surprising everyone. Still, those examples help explain why traders are watching the latest signal so closely.
Key Levels to Watch Next
Looking ahead, the next resistance levels on the chart appear around $2,400 and then $2,600 if bullish momentum continues. Those areas could act as the next battleground between buyers and sellers.
For now, though, the main story isn’t about price targets. It’s about the potential trend shift itself.
After months of sideways trading and steady declines, Ethereum has finally printed a daily SuperTrend Buy signal while reclaiming a multi-year pivot level. Whether that marks the beginning of a sustained recovery… well, the next few weeks will likely tell the story.
Disclaimer: BlockNews provides independent reporting on crypto, blockchain, and digital finance. All content is for informational purposes only and does not constitute financial advice. Readers should do their own research before making investment decisions. Some articles may use AI tools to assist in drafting, but every piece is reviewed and edited by our editorial team of experienced crypto writers and analysts before publication.


 English (US) ·