
 1 month ago
30
1 month ago
30
- Ethereum remains stuck near 0.029 against Bitcoin, with the 0.03 level acting as key resistance for renewed strength.
- On the USD chart, ETH is retesting a breakout trendline that could determine whether the next rally begins.
- If support holds, technical projections suggest a potential move toward the $2,340 resistance zone.
Ethereum is flashing two different — but strangely connected — signals right now depending on how you look at it. Against Bitcoin, the ETH/BTC pair remains stuck under an important resistance zone. Yet when priced against the U.S. dollar, Ethereum appears to be testing a breakout retest that could determine whether the next rally begins.
In other words, the charts are in a bit of a standoff. Momentum hasn’t fully arrived yet… but the market is clearly preparing for a bigger move.
ETH/BTC Ratio Stays Trapped Below 0.03
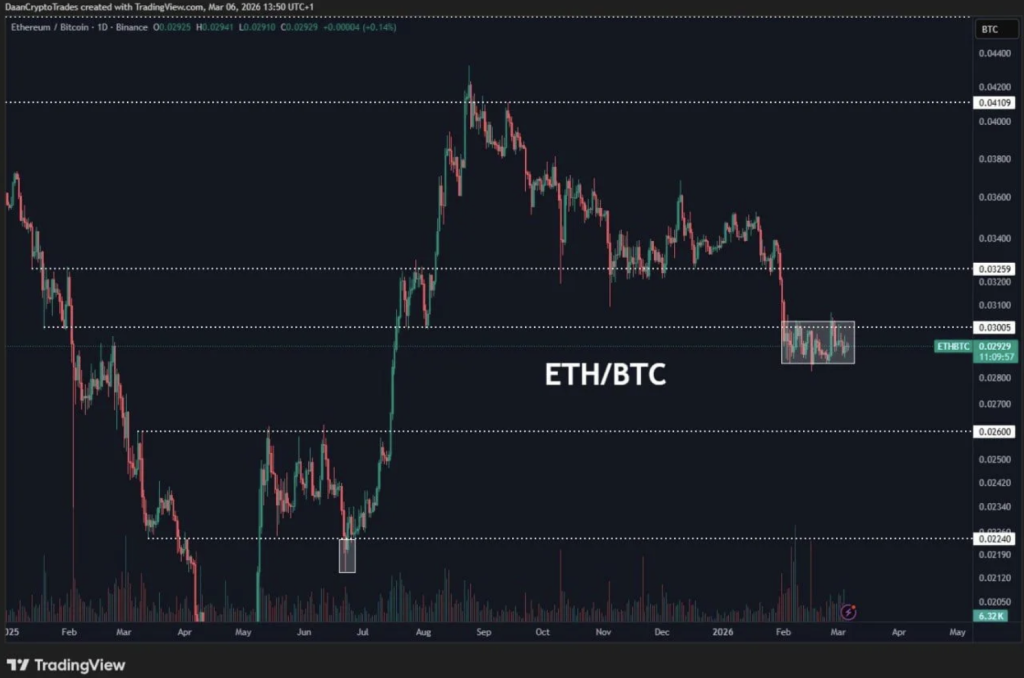
Over the past month, Ethereum has moved almost step-for-step with Bitcoin. That synchronized movement has left the ETH/BTC ratio drifting sideways near the 0.029 level, according to chart data shared by analyst DaanCryptoTrades.
The daily Binance chart shows ETH/BTC trading around 0.02929 on March 6. Since late February, the pair has remained compressed inside a tight sideways range — almost like the market is holding its breath.
That narrow band actually says quite a bit.
On one hand, Ethereum has stopped losing ground to Bitcoin, which had been the dominant trend for months. On the other hand, ETH hasn’t started outperforming either. Both assets have essentially been moving together, leaving the ratio stuck in neutral.
The first major resistance sits near the 0.03005 level. Beyond that, traders are watching higher zones around 0.03259 and eventually 0.04109 if momentum really starts to build.
Ethereum Needs to Reclaim 0.03 to Show Strength
The 0.03 level is particularly important. It has acted as a turning point several times during the past year — both during rallies and during declines.
According to DaanCryptoTrades, these horizontal levels still carry weight in the market structure. And the chart seems to support that idea.
Recently, ETH/BTC dropped into the current range and simply… stayed there. No breakout higher, no major breakdown either. Just sideways movement.
That kind of behavior usually means traders are waiting for clearer direction.
If Ethereum manages to reclaim the 0.03 level, it could signal renewed relative strength against Bitcoin. A move like that might open the door toward the next resistance zone near 0.03259.
But if the ratio slips below the current range instead, it would likely mean Bitcoin is once again pulling ahead in the short term.
For now though, Ethereum isn’t leading. It’s stabilizing — which is different.
Ethereum Tests Trendline Support on USD Chart
While the ETH/BTC chart remains quiet, the ETH/USD chart is showing a more interesting structure.
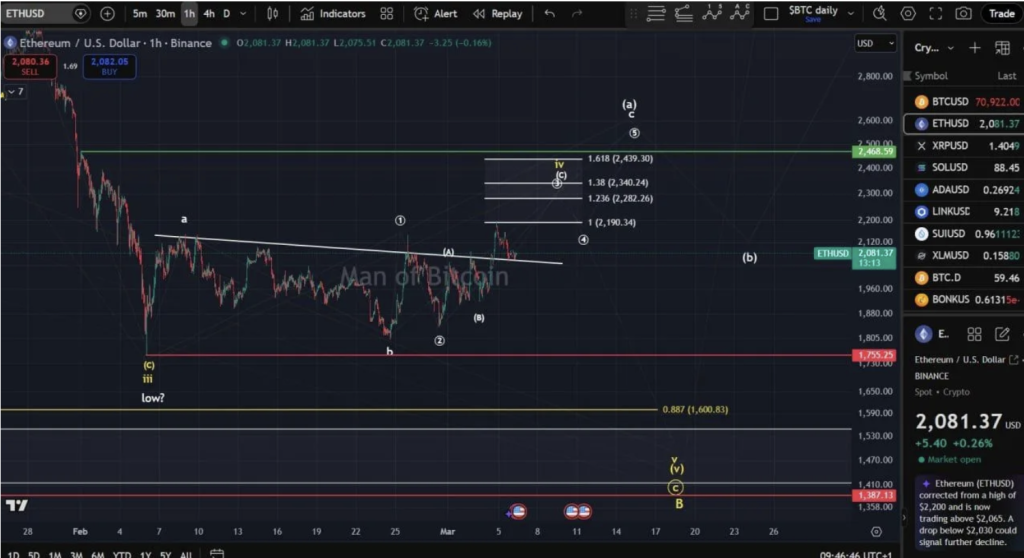
According to analysis shared by trader Man of Bitcoin, Ethereum recently broke above a descending trendline that had been capping price movement during the previous consolidation phase.
After breaking through that resistance, price has now returned to the same line — but from above.
This kind of move is known as a breakout retest. It’s a fairly common pattern in technical analysis.
When a former resistance level turns into support and holds, it often strengthens the bullish case.
Elliott Wave Setup Points Toward $2,340
If the trendline continues holding as support, Ethereum’s structure could support another upward leg. The chart outlines a possible Elliott Wave formation, where the next move higher would form what analysts call wave three.
That wave — historically the strongest in many Elliott Wave structures — carries a projected target near the $2,340 area.
Several Fibonacci extension levels align with that region as well. Key zones highlighted on the chart include potential resistance around $2,282, $2,340, and even $2,439 if momentum continues building.
Of course, none of those targets matter if the structure breaks down first.
The Trendline Retest Becomes the Key Test
Right now, everything hinges on the trendline retest.
If Ethereum manages to hold above that structure, the market could confirm a continuation pattern and start building toward the higher resistance zones marked on the chart.
But if the level fails, the breakout would likely lose credibility. And that could push Ethereum back into consolidation again.
For the moment, the market is simply testing the level — slowly, cautiously.
Sometimes the most important moments in a chart are the quiet ones right before the move.
Disclaimer: BlockNews provides independent reporting on crypto, blockchain, and digital finance. All content is for informational purposes only and does not constitute financial advice. Readers should do their own research before making investment decisions. Some articles may use AI tools to assist in drafting, but every piece is reviewed and edited by our editorial team of experienced crypto writers and analysts before publication.


 English (US) ·