
 2 months ago
101
2 months ago
101
- Ethereum ETF inflows turned positive after nearly five months of persistent outflows.
- BlackRock, Fidelity, JP Morgan, and other major firms continue expanding Ethereum-based products.
- Long-term ETH chart structures are beginning to resemble previous cycle bottom formations.
Ethereum is beginning to regain serious attention across the crypto market after a wave of fresh institutional inflows and expanding blockchain adoption reignited bullish sentiment around the network. After spending months trapped in a painful corrective phase, ETH is now seeing renewed interest from both large financial firms and long-term investors watching the broader tokenization narrative unfold.
A growing number of market participants are now pointing toward Ethereum ETF flows, blockchain-based asset management, and improving technical structures as signs that institutions may already be preparing for another major accumulation phase beneath the surface.
Ethereum ETF Flows Finally Turn Positive Again
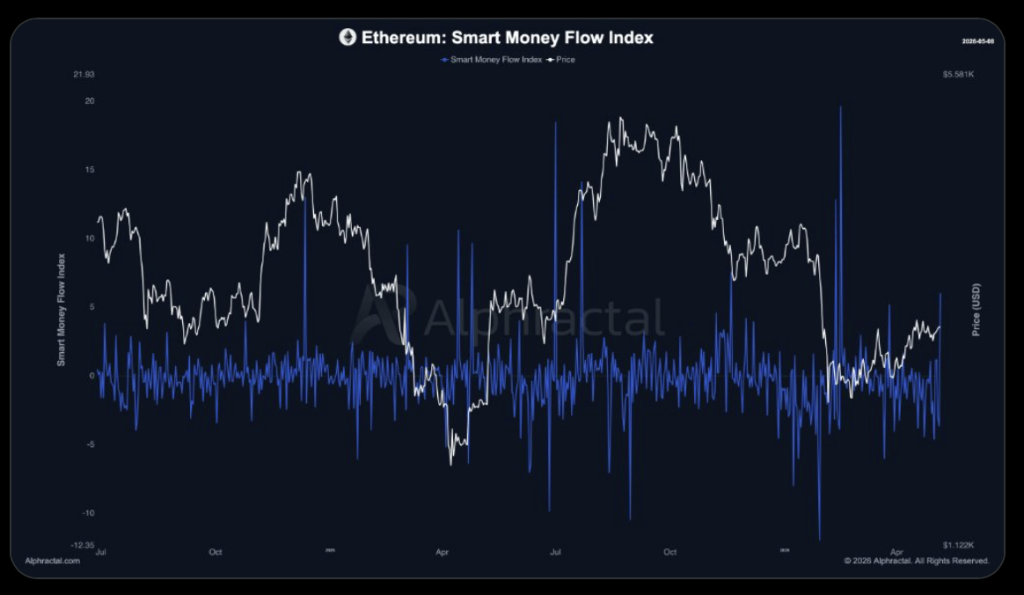
According to data shared by Alphractal, Ethereum ETF inflows officially reversed a nearly five-month stretch of persistent outflows during April. The market recorded roughly $356 million in net inflows throughout the month, signaling a noticeable shift in institutional positioning after months of hesitation.
That momentum appears to be continuing too. On May 1 alone, Ethereum ETFs reportedly attracted another $101 million in fresh inflows, reinforcing the idea that institutional demand is gradually returning.
Interestingly, reports suggest BlackRock and Fidelity accounted for more than 90% of those inflows, highlighting just how heavily traditional financial giants are beginning to influence Ethereum’s broader market structure now.
Alphractal also noted that its Smart Money Flow Index turned positive shortly before Ethereum’s recent price rebound started gaining traction. Traders often monitor that indicator closely because it attempts to track whether larger market participants are quietly positioning ahead of broader directional moves.
The timing has caught attention because Ethereum continues holding above major long-term support zones despite months of selling pressure earlier in the cycle. That combination of improving flows and technical stability is starting to shift sentiment again, slowly but noticeably.
Wall Street Firms Continue Expanding Ethereum Exposure
Beyond ETF demand, Ethereum’s growing role inside traditional finance is also becoming harder to ignore.
Crypto analyst Crypto Patel recently pointed toward several major developments showing how deeply large financial institutions are embedding Ethereum infrastructure into tokenization, custody, and investment products.
One of the more important examples involves BlackRock’s tokenized money market fund operating directly on Ethereum. Meanwhile, JP Morgan continues running its MONY Fund infrastructure through Ethereum-based architecture, further reinforcing the network’s role in institutional-grade blockchain systems.
BlackRock’s BUIDL fund has reportedly already grown to around $2.85 billion in assets, showing that tokenized finance products on Ethereum are moving far beyond small-scale experimentation now.
At the same time, companies like Robinhood are developing Ethereum Layer-2 infrastructure, while BNY Mellon recently launched Ethereum custody services in the United Arab Emirates. Elsewhere, DTCC has also been building blockchain-enabled asset management systems tied to the Russell 1000 index.
Even Europe is joining the trend. WisdomTree recently launched a staked Ethereum ETP across European markets, adding yet another layer to the growing institutional Ethereum ecosystem.
Taken together, these developments are creating a much larger narrative around Ethereum than simple short-term price speculation. The network increasingly looks like core infrastructure for tokenized finance, and institutions seem fully aware of that now.
Long-Term Ethereum Chart Structure Starts Looking Familiar
From a technical perspective, Ethereum’s monthly chart is also beginning to show a setup some analysts find very interesting.
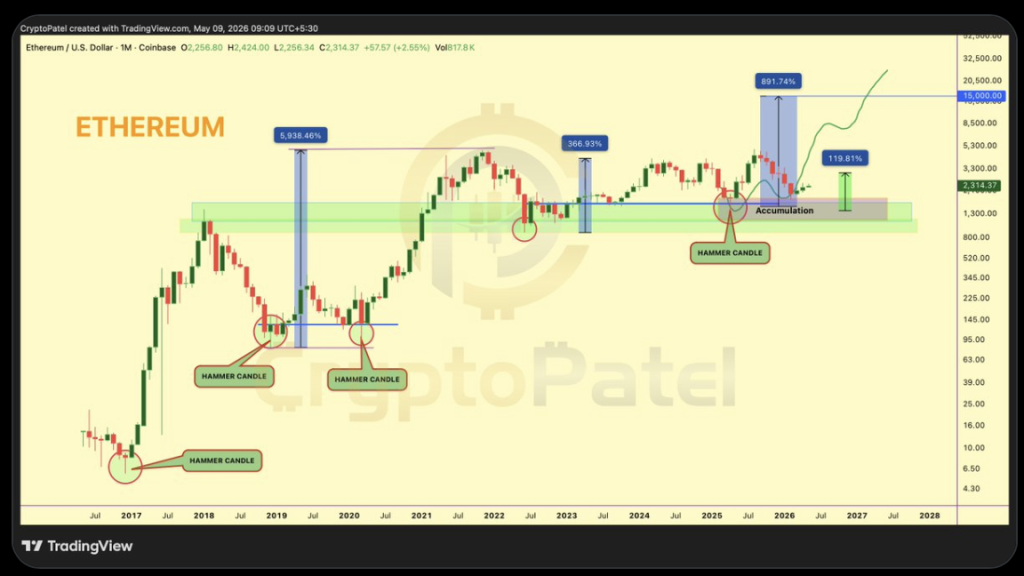
Current price action remains positioned inside a major long-term support zone between roughly $1,300 and $1,700, an area that historically produced important cycle bottoms for ETH. Analysts comparing previous market structures note that Ethereum formed large hammer candles near major lows back in 2016, 2019, and 2020 before eventually launching into aggressive expansion phases afterward.
Now the latest monthly candle appears to be developing inside the same broader accumulation region, suggesting buyers are once again absorbing heavy selling pressure rather than allowing the market to fully collapse lower.
Historically, setups like this have preceded some extremely large Ethereum rallies, with prior cycle expansions ranging from roughly 366% to even more than 5,900% during earlier market phases. Obviously, no pattern guarantees the same outcome this time, but traders are paying attention because the similarities are difficult to ignore.
For now, Ethereum remains well above one of its most important historical demand zones despite falling sharply from its previous all-time high near $4,800. Combined with growing institutional activity, many investors believe the groundwork for the next major cycle may already be forming quietly underneath current price action.
Disclaimer: BlockNews provides independent reporting on crypto, blockchain, and digital finance. All content is for informational purposes only and does not constitute financial advice. Readers should do their own research before making investment decisions. Some articles may use AI tools to assist in drafting, but every piece is reviewed and edited by our editorial team of experienced crypto writers and analysts before publication.


 English (US) ·