
 3 weeks ago
23
3 weeks ago
23
- Ethereum continues struggling to break above the $2,100 resistance zone.
- Support near $1,800 remains critical for maintaining the current structure.
- A bear flag pattern suggests the market could face downside risk if support fails.
Ethereum is currently stuck under an important resistance area, and the market doesn’t look particularly comfortable there. Support zones continue getting tested again and again, while the upside remains capped. Two separate chart analyses are pointing to the same general conclusion… the structure still looks fragile, and the next decisive move could shape Ethereum’s direction for a while.
Right now, the most obvious barrier sits around the $2,100 level. According to analysis from Daan Crypto Trades, Ethereum keeps pushing into that region only to be pushed back down almost immediately. Sellers appear to be waiting there, ready to step in each time price creeps upward.
Because of that, ETH has struggled to build any sustained recovery momentum. Instead of breaking through resistance and continuing higher, the market repeatedly stalls in the same zone.
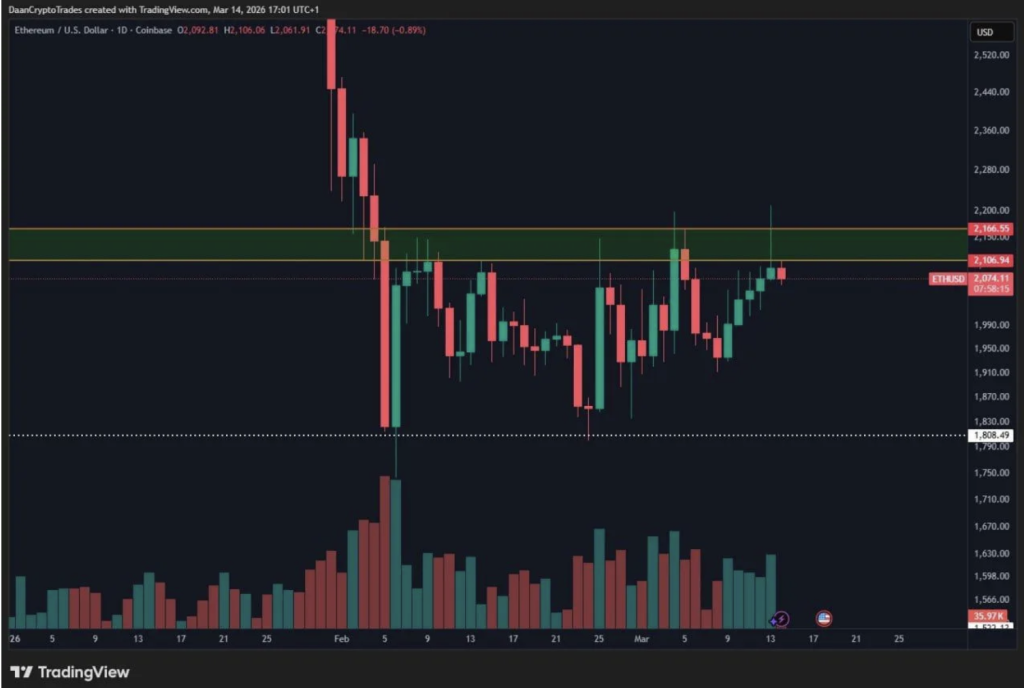
$2.1K Remains the Key Barrier While $1.8K Holds the Line
The daily chart highlights a fairly clear supply zone between roughly $2,106 and $2,166. Ethereum briefly entered that region once again, but the move didn’t last long. Sellers reacted quickly, forcing price back down and reinforcing the idea that $2.1K remains the primary ceiling for now.
On the other side of the range, the $1,808 level continues to act as the most important support area. Buyers have defended this zone during earlier dips, preventing price from sliding further. Daan notes that the broader $1.8K region is the level bulls absolutely need to protect if they want to keep the current structure intact.
If Ethereum falls below that support, the chart could shift into a more bearish configuration. A breakdown there might open the door to deeper declines as market confidence weakens.
For the moment, ETH is essentially trapped in a range. Resistance hangs overhead around $2.1K, while support sits lower near $1.8K. A convincing daily close above the upper boundary would likely signal stronger bullish momentum—but until that happens, Ethereum remains boxed in.
Bear Flag Pattern Raises Downside Concerns
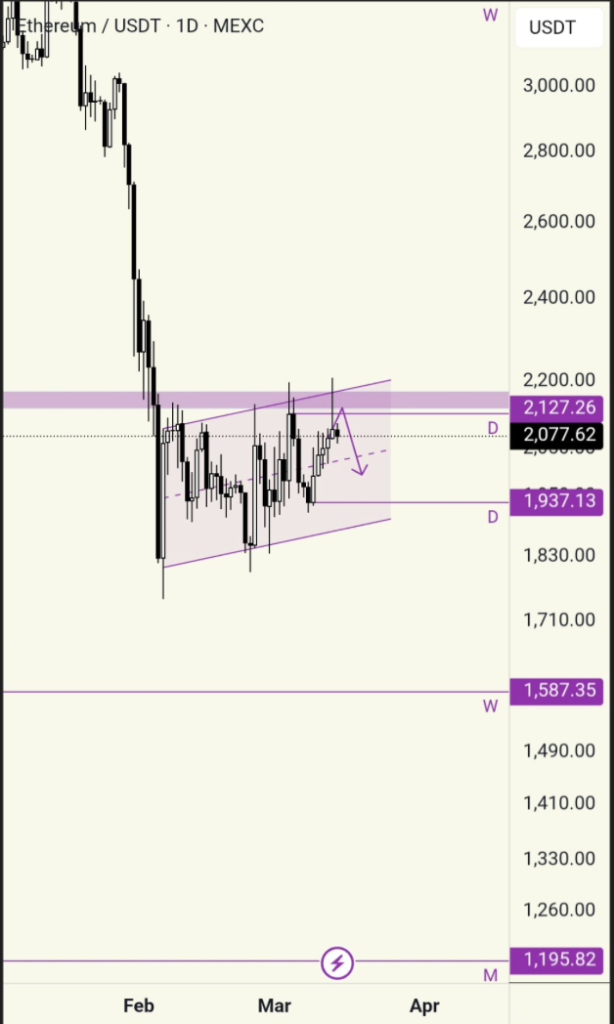
Another chart shared by analyst Hardy shows Ethereum moving within a consolidation structure that resembles a classic bear flag. This pattern developed after a sharp drop earlier in the year, when ETH fell rapidly before settling into a sideways trading phase.
The structure now appears as a narrow upward channel, with price gradually compressing between rising trend lines. At the same time, Ethereum continues to sit below a major resistance zone near $2,127.
Patterns like this often show up during pauses inside a broader downtrend. In many cases, the flag acts as a continuation structure rather than a signal that the market is reversing.
What’s also noticeable is how Ethereum keeps failing to break above the upper boundary of the channel. Each attempt to climb higher leaves behind rejection wicks, a sign that sellers remain active near resistance.
Consolidation Could Lead to a Sharp Move
The lower edge of the current structure sits near a support level around $1,937. This area has absorbed several pullbacks since the consolidation started, acting as a temporary floor for price action.
As long as Ethereum stays inside the channel, the market will probably continue bouncing between those boundaries. It’s a tightening structure, though—and those rarely last forever.
Hardy points out that extended bear flag patterns can sometimes lead to stronger breakdowns. When a market consolidates for too long, liquidity builds on both sides of the range. Once the structure finally breaks, price often moves quickly.
If that happens to the downside, the next major support level appears much lower, around $1,587 on the weekly chart. That zone previously acted as a strong buying area during earlier market phases.
For now, Ethereum remains trapped beneath resistance while trading inside a narrowing range. Until the market can break above the flag and reclaim higher ground, the broader structure still leans bearish—at least for the moment.
Disclaimer: BlockNews provides independent reporting on crypto, blockchain, and digital finance. All content is for informational purposes only and does not constitute financial advice. Readers should do their own research before making investment decisions. Some articles may use AI tools to assist in drafting, but every piece is reviewed and edited by our editorial team of experienced crypto writers and analysts before publication.


 English (US) ·