
 6 months ago
28
6 months ago
28
Leading altcoin Ethereum has faced a series of headwinds over the past few days. With heightened market volatility and significant liquidations, ETH remains under bearish pressure.
However, a bullish divergence has emerged on its daily chart, suggesting that the coin might be poised for a rebound and a possible rally back above $3,000.
Ethereum Traders Bet on the Upside as Buying Pressure Increases
BeInCrypto’s assessment of the ETH/USD one-day chart reveals that despite ETH’s price decline in the past few days, its Chaikin Money Flow (CMF) has maintained an upward trend, forming a bullish divergence. At press time, ETH’s CMF rests above the zero line at 0.14.
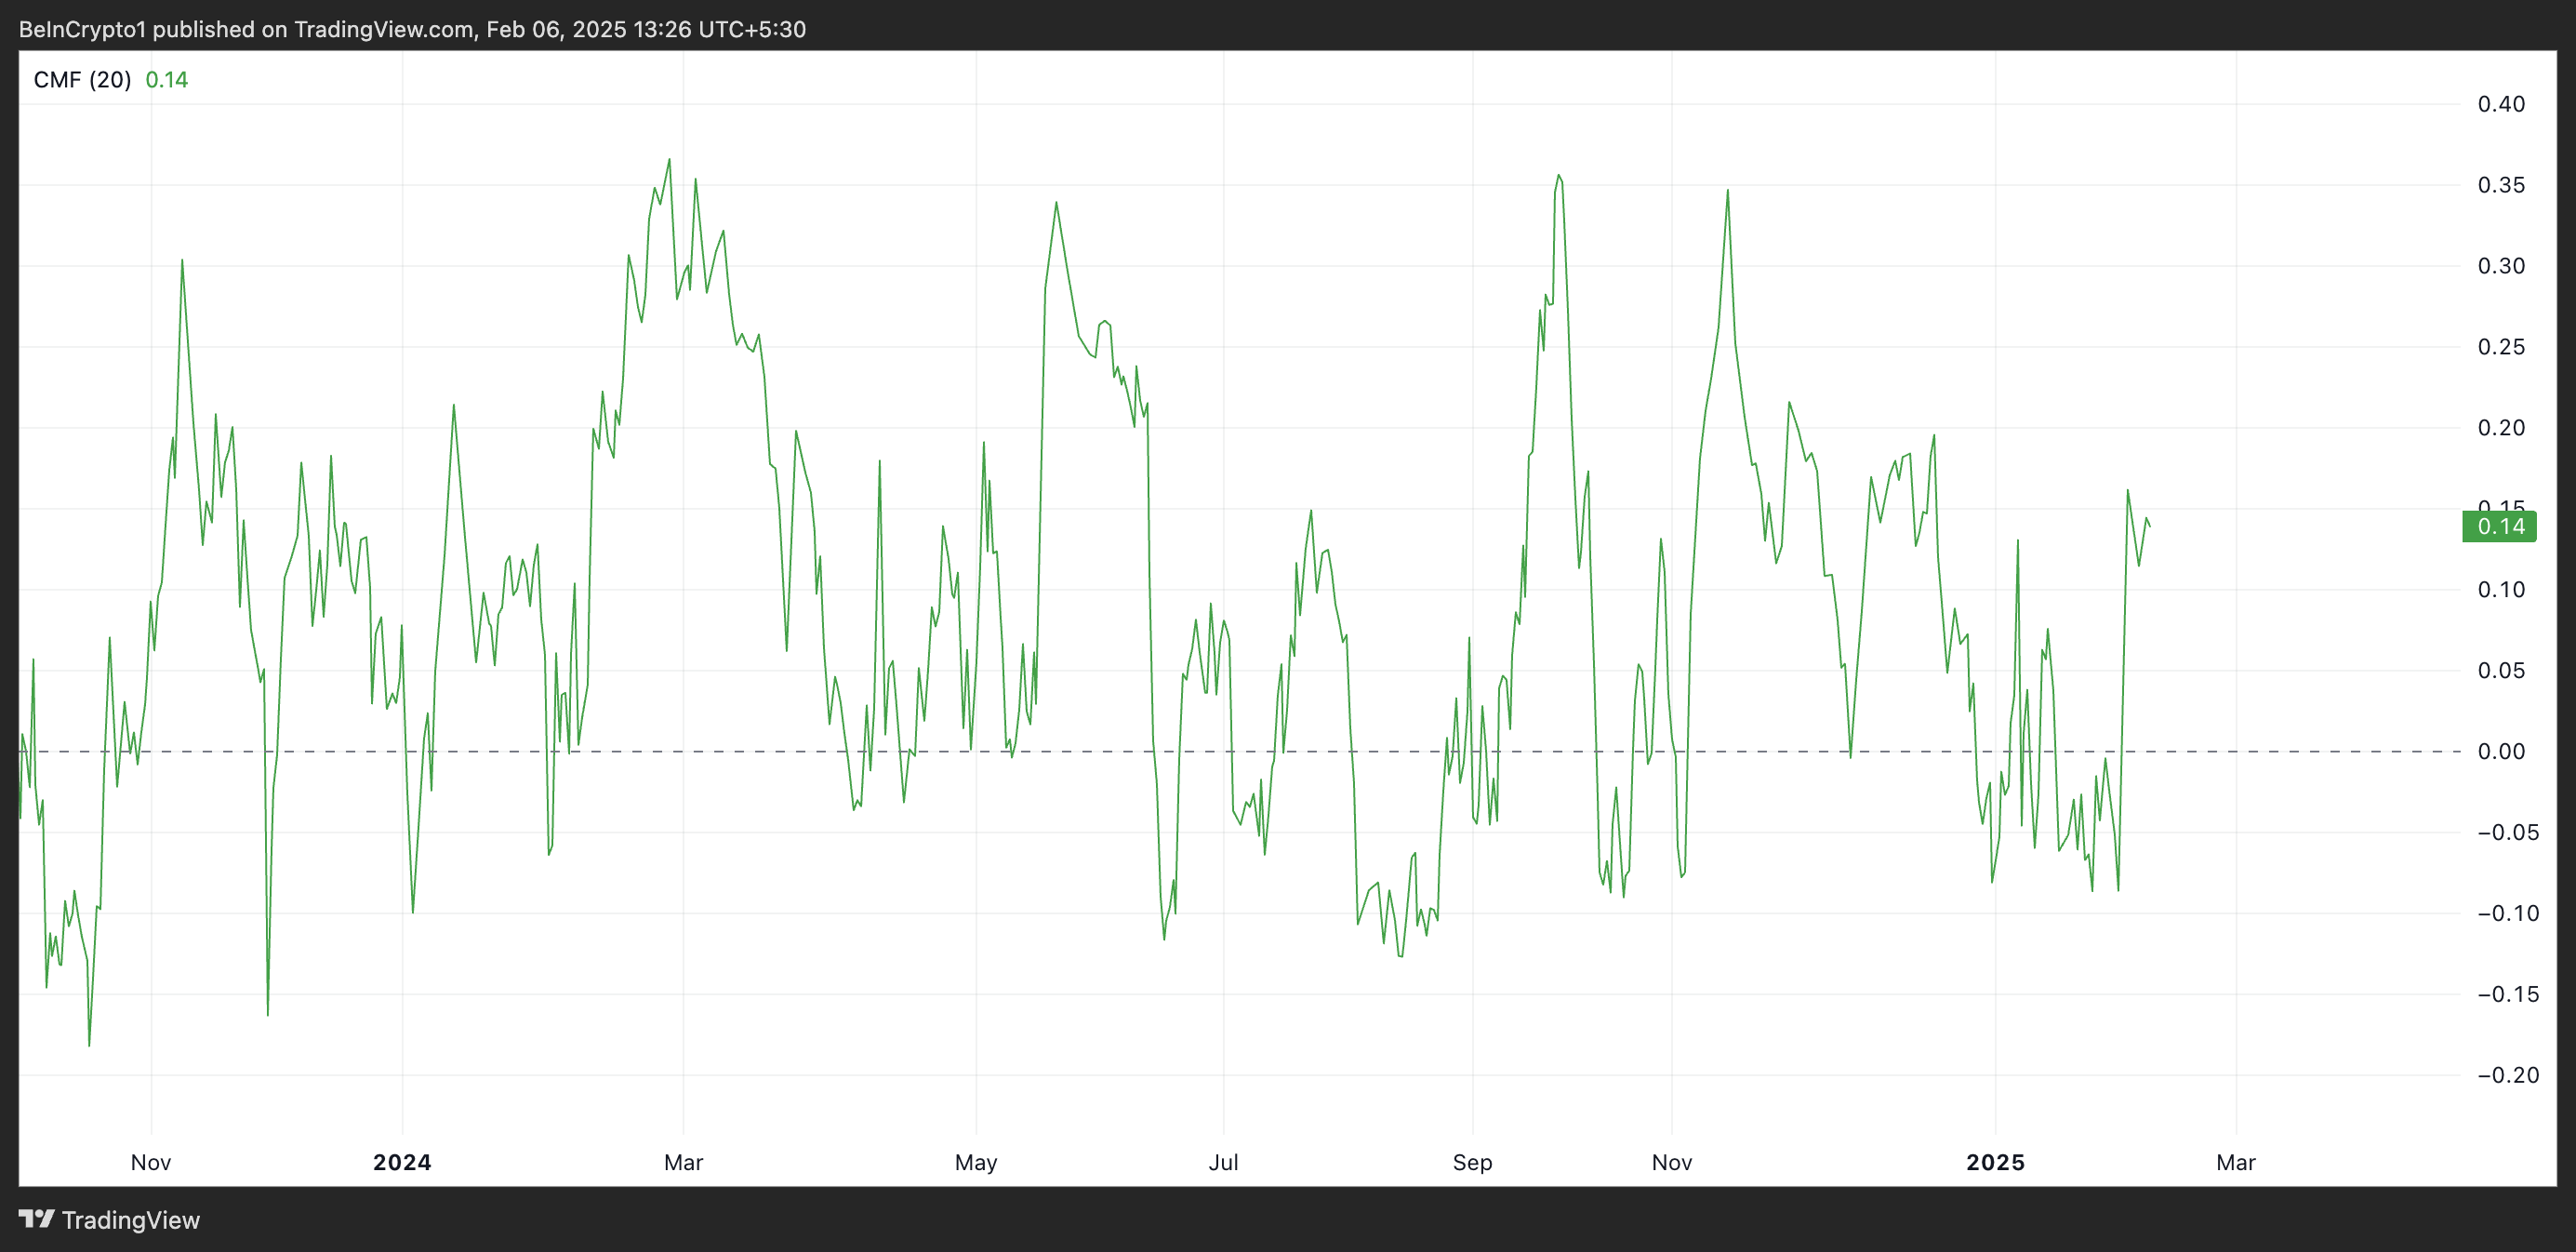 ETH CMF. Source: TradingView
This indicator measures the strength of buying and selling pressure by analyzing price and volume over a specific period. When CMF rises while an asset’s price declines, it indicates that buying pressure is increasing despite the downtrend.
This divergence indicates that ETH traders are accumulating the asset at lower prices, potentially signaling a reversal. A sustained increase in the ETH’s CMF hints at a price rebound as demand outweighs selling pressure.
Moreover, after several days of negative values, ETH’s funding rate has turned positive again. The shift in market sentiment suggests that futures traders are increasingly favoring long positions, indicating renewed confidence in ETH’s price recovery. At press time, this stands at 0.0046%.
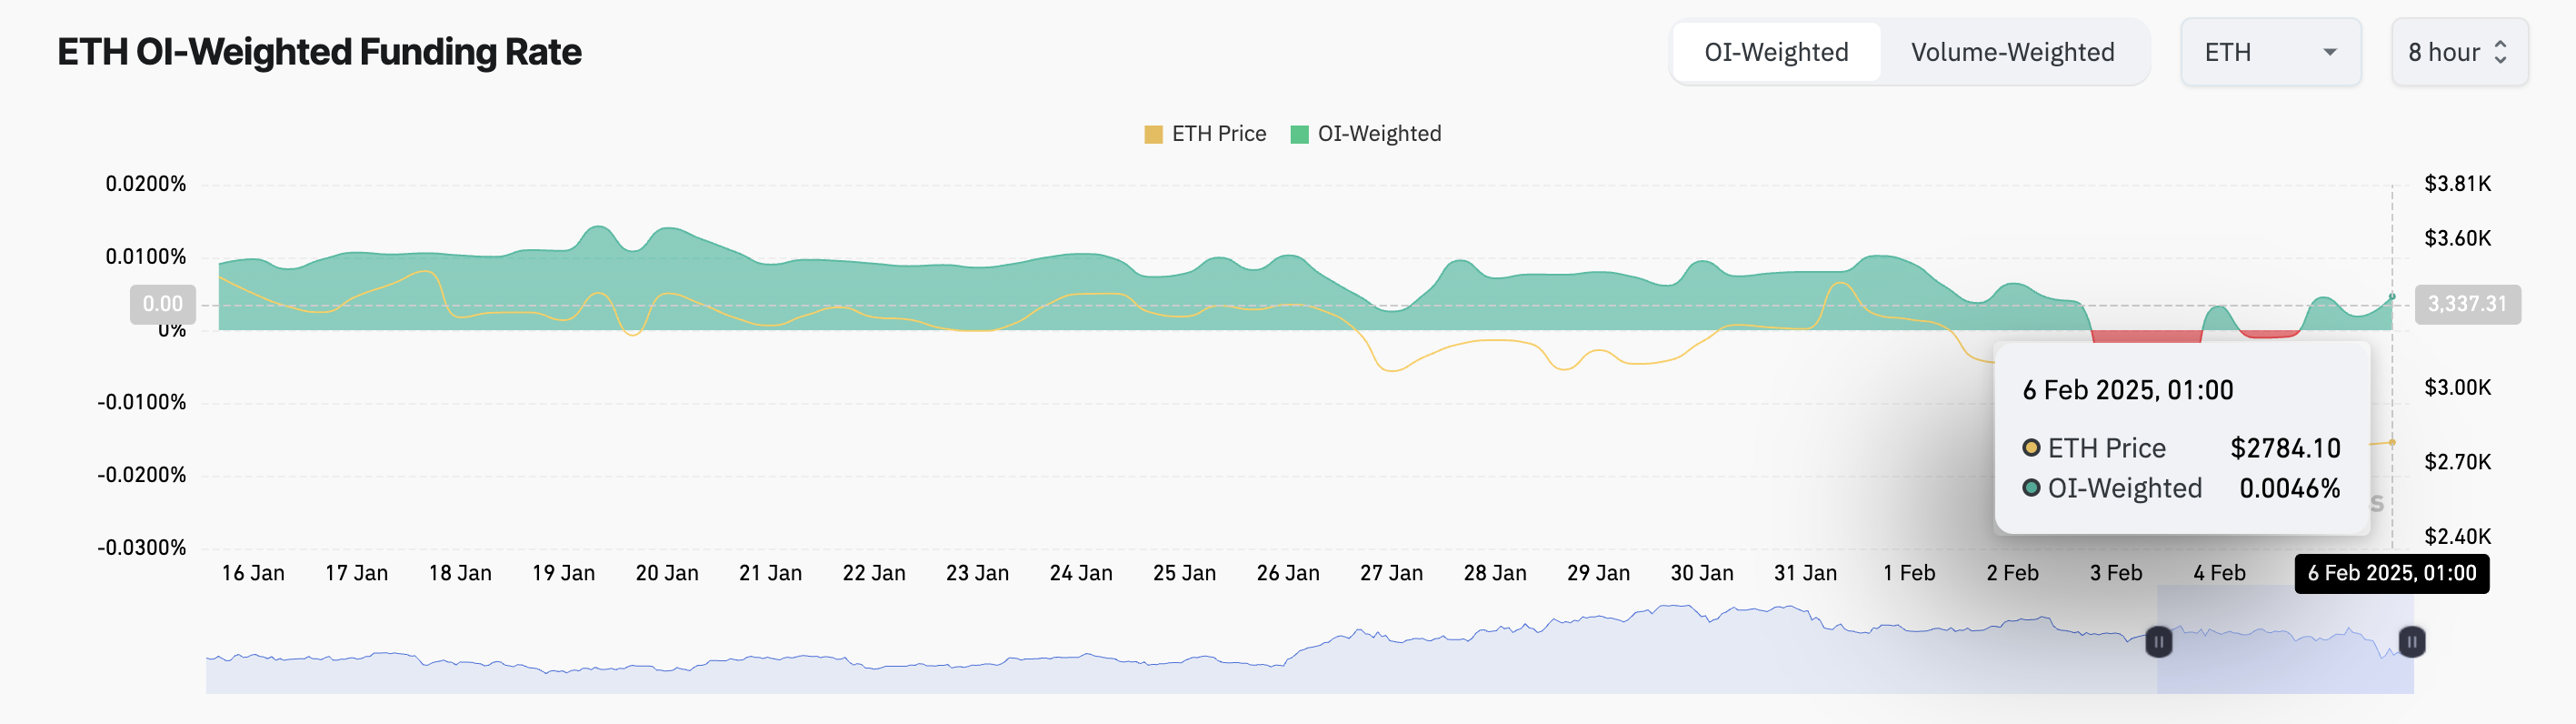 ETH Funding Rate. Source: Coinglass
The funding rate is a periodic fee exchanged between long and short traders in perpetual futures contracts. It ensures that the contract price stays close to the spot price. When the funding rate is positive, it means that long traders are paying short traders, indicating stronger demand for long positions and a bullish market sentiment.
ETH Price Prediction: Is a Reversal on the Horizon?
Ethereum’s price decline has caused it to trade within a descending channel over the past few weeks. This pattern is formed when an asset’s price moves within a downward-sloping range, creating lower highs and lower lows over time.
It typically signals a bearish trend, but a breakout above the channel could indicate a potential reversal. If the demand for ETH soars, a potential breakout could propel the coin’s price to $3,249.
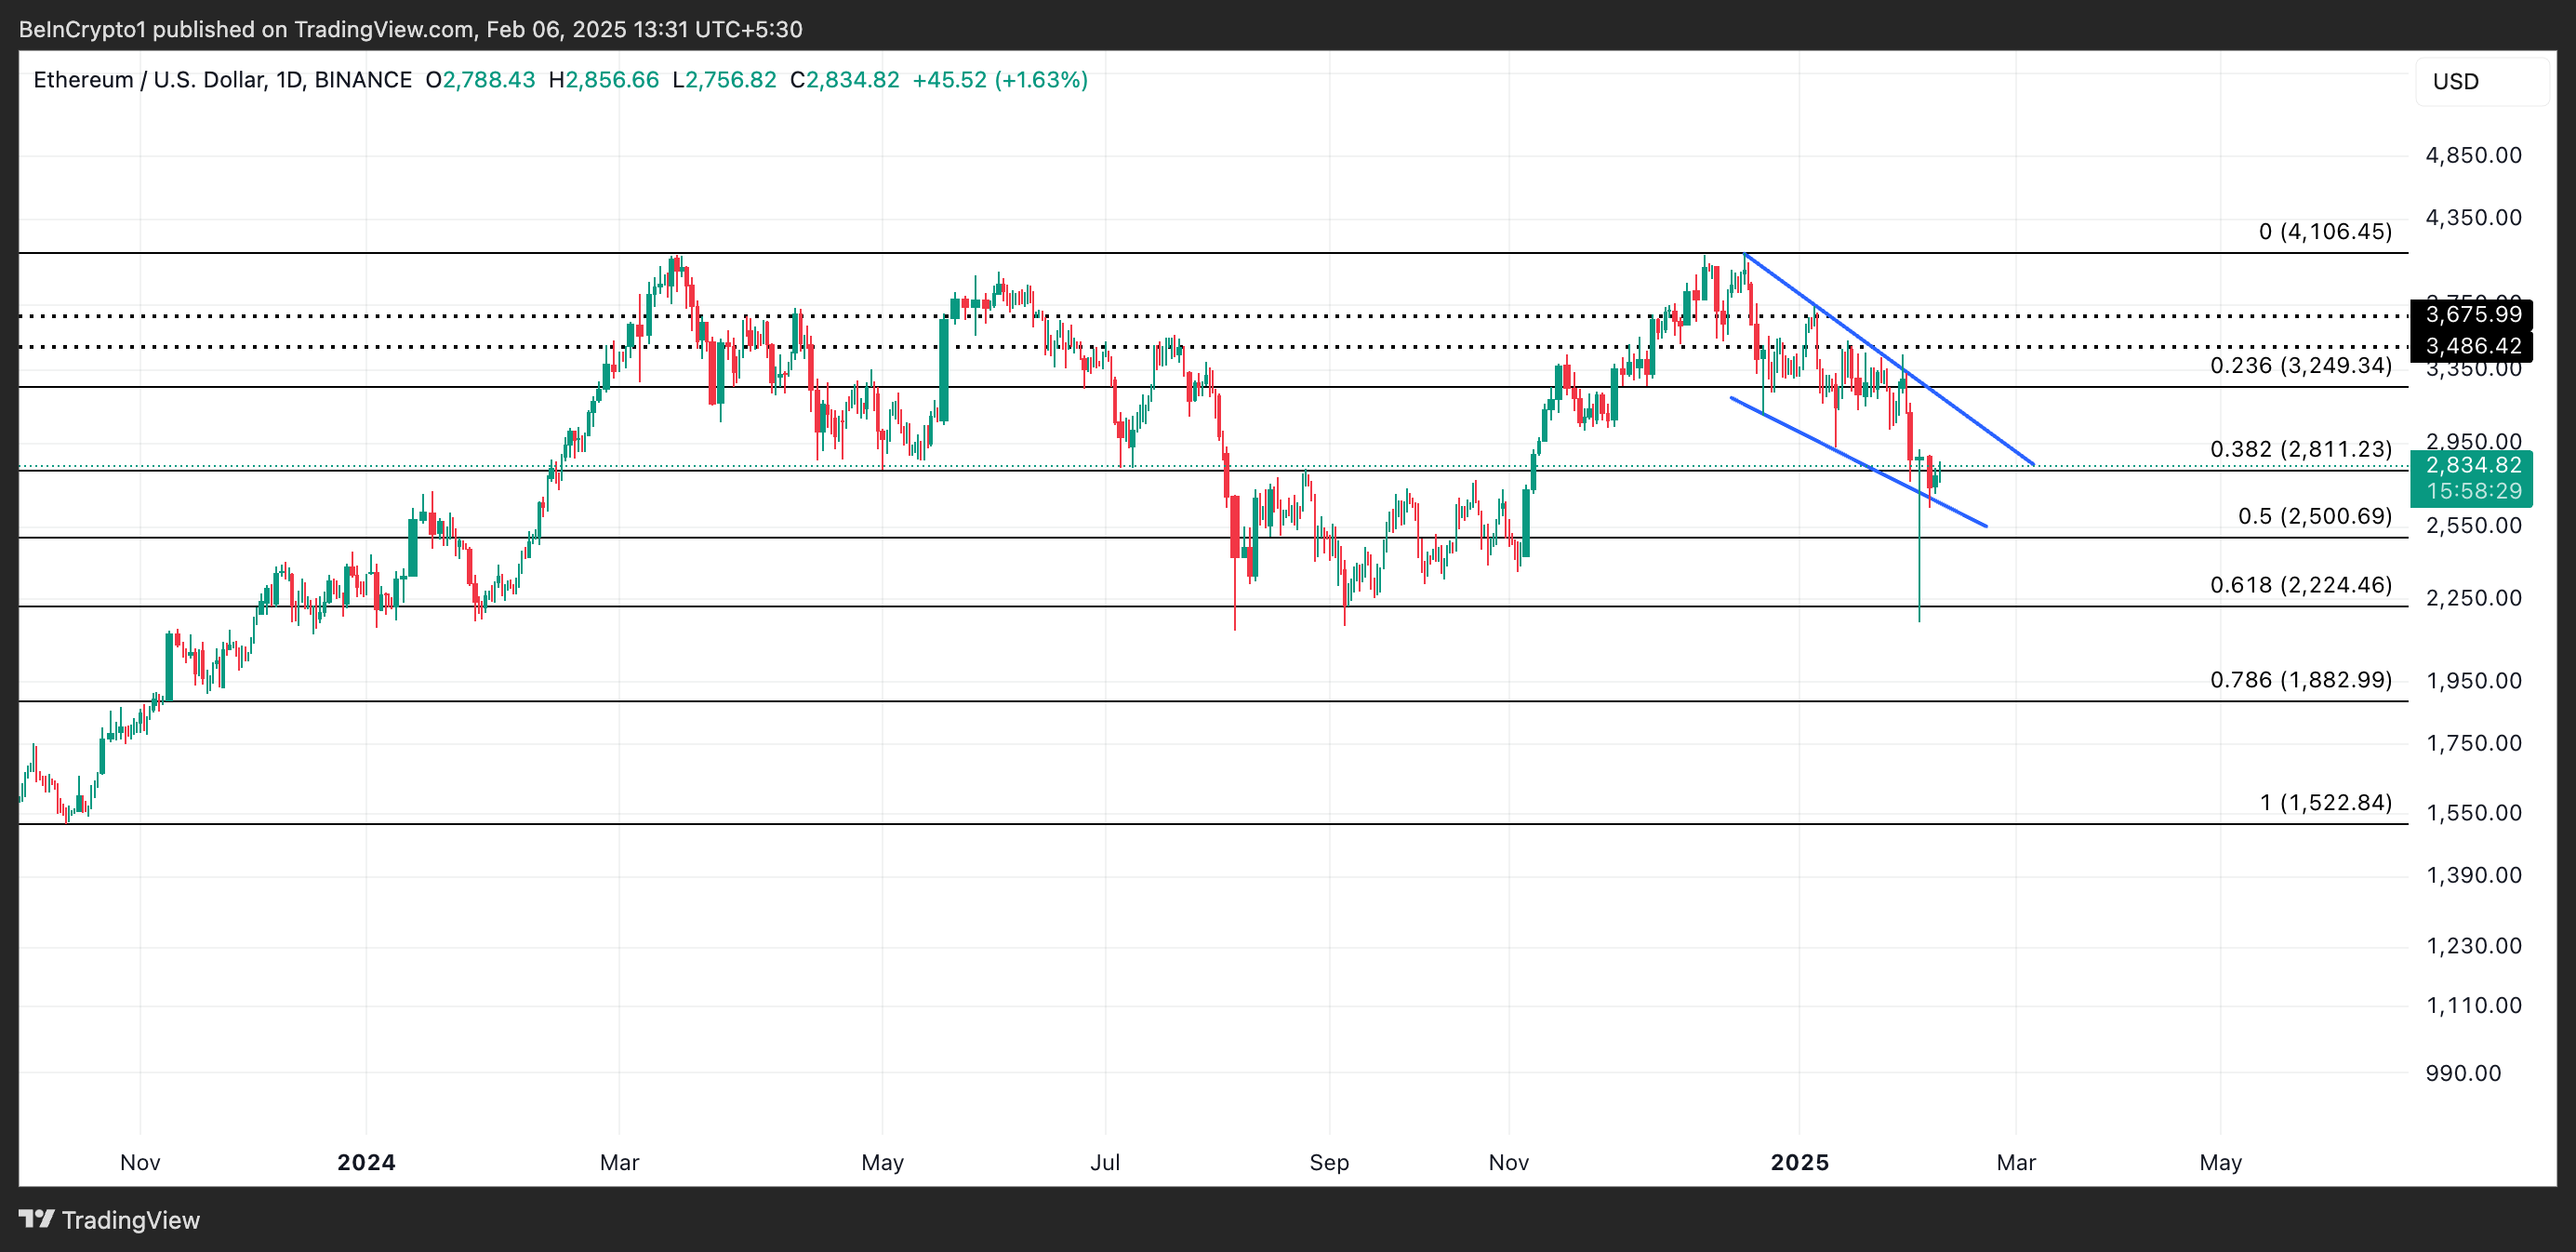 ETH Price Analysis. Source: TradingView
On the other hand, a failed breakout attempt could cause a price decline toward the channel’s support at $2,553.
The post Ethereum (ETH) Gears Up for $3,000 as Bullish Divergence Emerges appeared first on BeInCrypto.


 English (US) ·