
 2 months ago
34
2 months ago
34
Key Takeaways
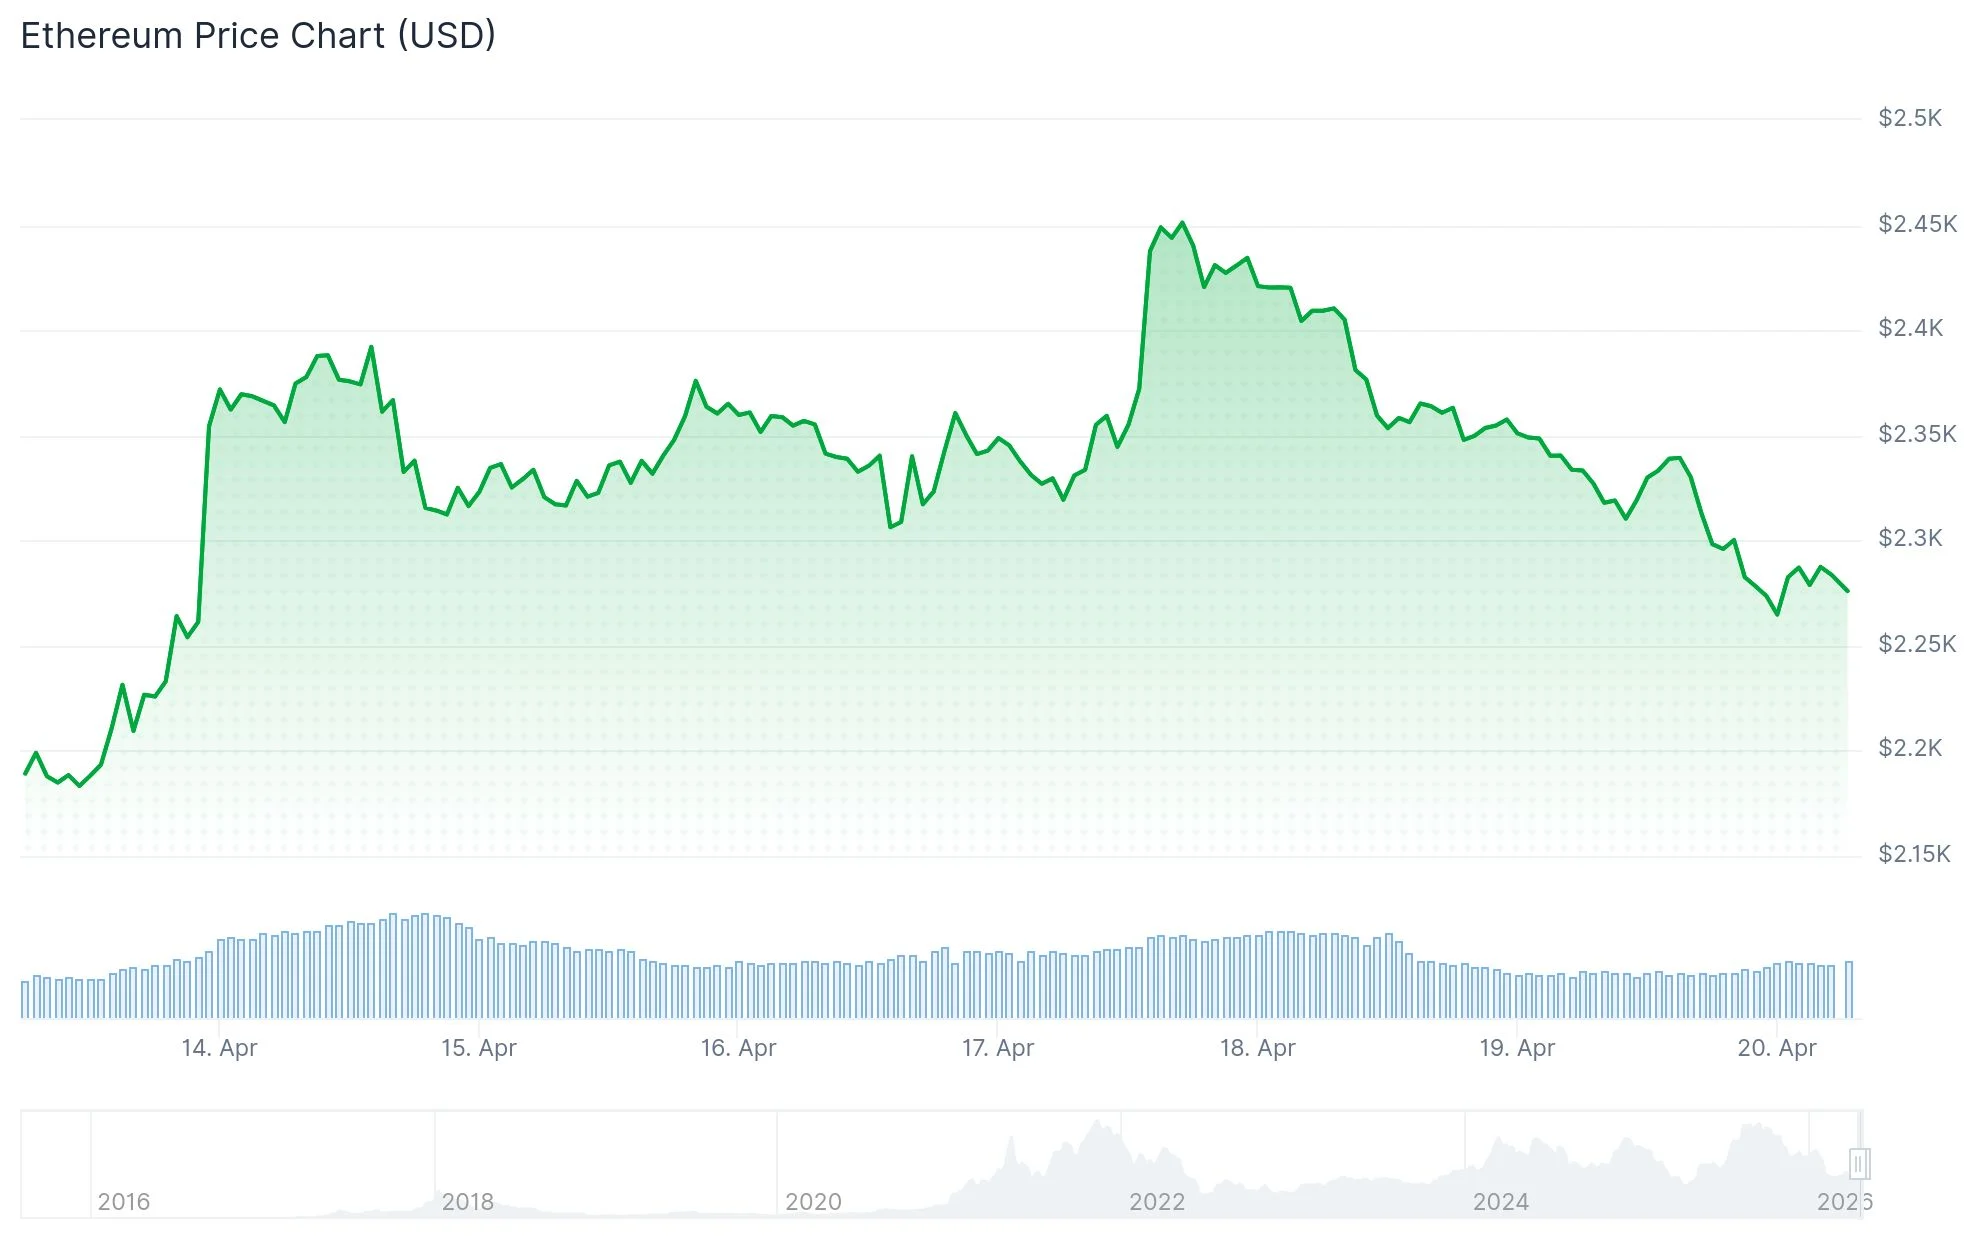
- ETH has fallen beneath $2,350, currently trading around $2,253 following a rejection at $2,420
- Hourly chart reveals a descending trend line forming resistance near the $2,300 mark
- Spot Ethereum ETFs recorded $276 million in weekly net inflows, with Fidelity’s FETH leading at $126 million
- More than 32% of total ETH supply is locked in staking, reducing exchange liquidity
- Net Taker Volume has turned positive at approximately +$102 million since March, indicating renewed buying interest
Ethereum experienced a significant decline from $2,465 down to $2,253 in a rapid downward movement. Currently, the asset is stabilizing beneath both the 100-hour Simple Moving Average and the 23.6% Fibonacci retracement zone from the recent price swing.
 Ethereum (ETH) Price
Technical analysis shows a descending trend line developing on the one-hour ETH/USD chart, creating resistance around the $2,300 threshold. The digital asset is presently maintaining position slightly above $2,250, a level market observers identify as crucial short-term support.
Should ETH successfully defend the $2,250 zone, another upward attempt becomes possible. Initial resistance barriers include $2,300 followed by $2,335. Breaking through $2,360—which corresponds with the 50% Fibonacci retracement from the latest downturn—might trigger a rally toward $2,415 and potentially $2,465.
Conversely, failure to maintain $2,220 could accelerate selling toward $2,200, then $2,150, with $2,120 representing a deeper downside target.
Institutional Demand Remains Robust
Despite bearish price movement, spot Ethereum ETFs attracted $276 million in net capital during the April 13-17 trading period. Fidelity’s FETH dominated flows with $126 million weekly, pushing its aggregate historical inflows to $2.36 billion.
BlackRock’s ETHA secured second position with $99.2 million in weekly additions. ETHA’s total cumulative inflows have reached $11.83 billion. Grayscale’s ETHE was the sole fund experiencing outflows, recording $16.7 million in redemptions. Combined net assets across all Ethereum spot ETFs total $14.26 billion.
Market Dynamics and Supply Constraints
Over 32% of the entire Ethereum supply remains locked in staking protocols, withdrawing substantial volume from active market circulation. This dynamic continuously reduces exchange-available inventory and creates increasingly thin order books.
CryptoQuant data reveals perpetual futures volume hit $34.74 billion versus spot trading volume of $14.29 billion, indicating market participants favor derivatives over direct purchases. Open interest contracted 5.75% to $31.18 billion, while funding rates shifted marginally negative—suggesting mounting bearish positioning.
Neverthstanding, emerging signals suggest accumulation may be underway. Net Taker Volume has reversed to positive territory at roughly +$102 million since March, contrasting sharply with intense selling pressure observed during prior rallies, including a -$568 million reading when ETH approached $5,000.
Current market data shows ETH trading beneath $2,350, with immediate directional momentum dependent on whether buyers can successfully protect the $2,250 support threshold.
The post Ethereum (ETH) Price Slips 8% Amid Geopolitical Concerns — Key Support Zones to Monitor appeared first on Blockonomi.


 English (US) ·