
 1 week ago
22
1 week ago
22
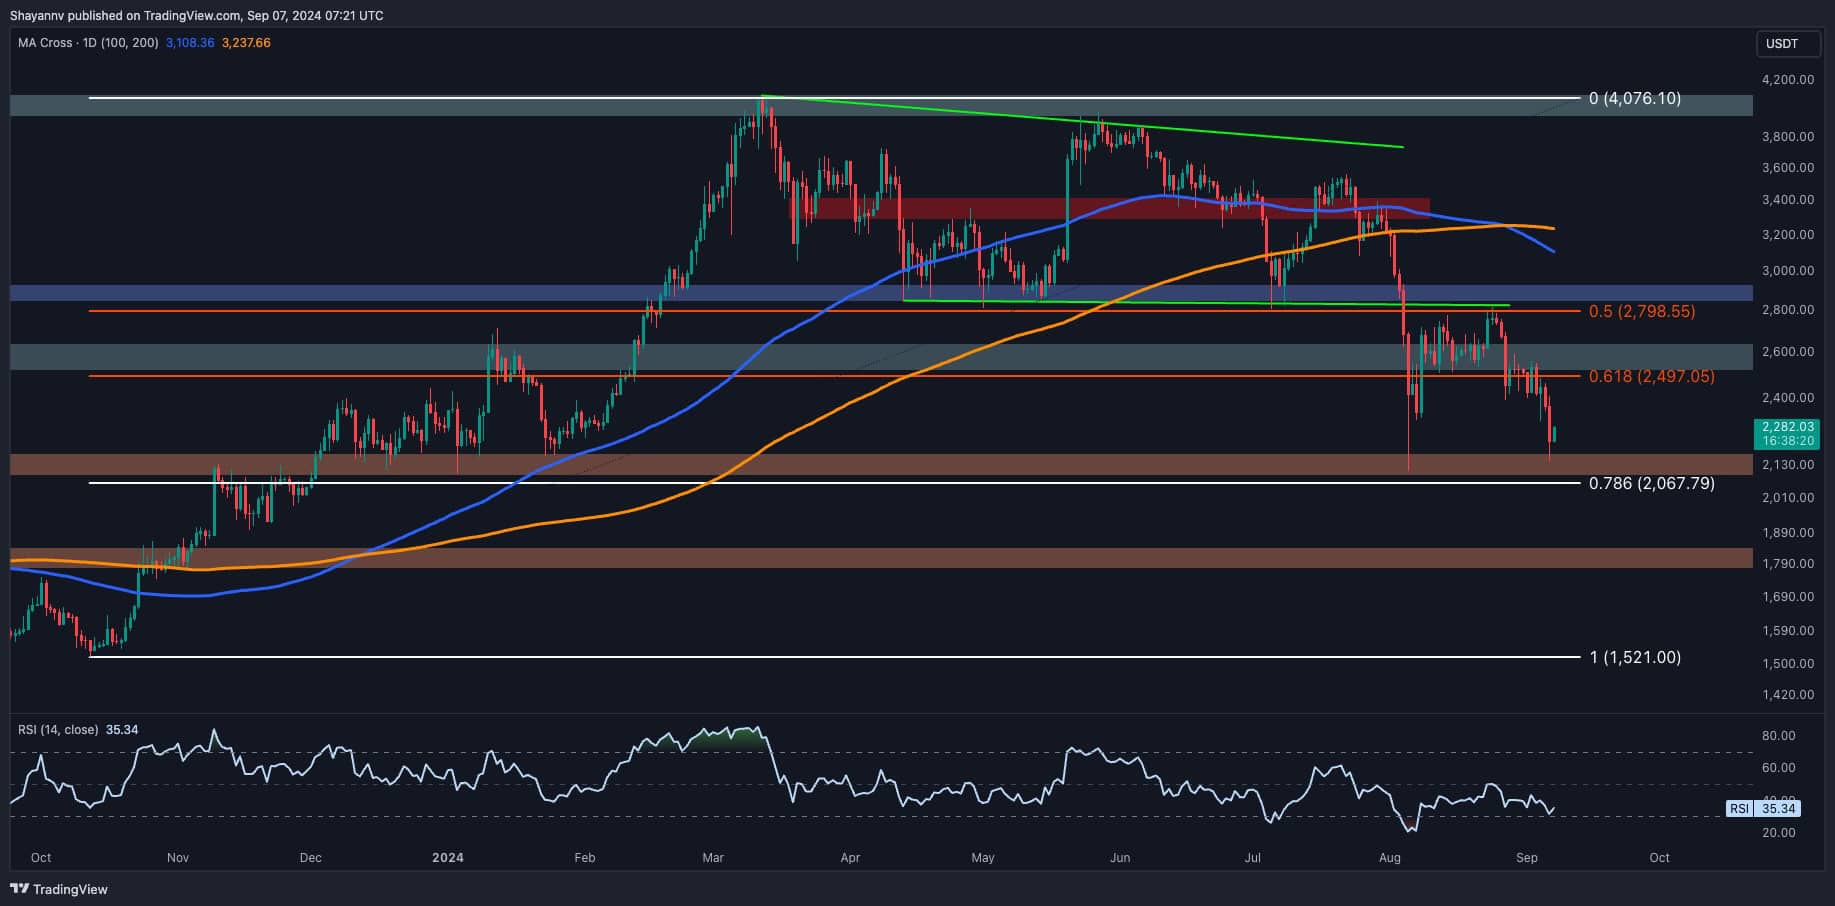
Ethereum has been notably bearish, marked by a sharp decline following a pullback to the lower boundary of a broken wedge, coupled with the formation of a death cross.
Despite this, the price is nearing a crucial support level that could lead to a short-term sideways consolidation.
Technical Analysis
By Shayan
The Daily Chart
Ethereum has been in a strong downtrend, instilling fear and uncertainty among market participants. Low inflows into spot ETH ETFs have further underscored this sentiment, signaling reduced investor interest and the appearance of the death cross, where the 100-day moving average crosses below the 200-day moving average.
Following a rejection at the lower boundary of the multi-month wedge and the 0.5-0.618 Fibonacci levels, Ethereum has continued its decline, confirming the strength of sellers in the market.
However, the price is approaching a critical support zone, defined by the static $2.1K level and the 0.786 Fibonacci retracement level at $2,067. This area is expected to have a substantial demand, which could lead to a short-term pause in the downtrend, with potential sideways consolidation before Ethereum’s next move is determined.
 Source: TradingView
The 4-Hour Chart
On the 4-hour chart, ETH was firmly rejected from the resistance zone between the 0.5 ($2.6K) and 0.618 ($2.7K) Fibonacci levels, resulting in continued bearish momentum toward the $2.1K support. This level has held previously, particularly in early August, suggesting it might attract buyers looking to accumulate at these price points.
If demand resurfaces at the $2.1K mark, Ethereum may experience a temporary consolidation phase, pausing the downward pressure. However, if this crucial support is breached, it could trigger a long-liquidation event, potentially driving the price down toward the $1.8K region.
The coming days will be crucial in determining whether Ethereum can hold this support or if a deeper correction is on the horizon.
 Source: TradingView
Onchain Analysis
By Shayan
Ethereum’s value is fundamentally tied to its decentralized network and the active engagement of its users. One key metric to gauge this engagement is the number of unique active addresses on the network, which can serve as a valuable proxy for Ethereum’s overall market demand and valuation.
The chart showcases the 14-day moving average of Ethereum Active Addresses, which represents the total number of distinct active addresses, including both senders and receivers of ETH transactions. Since late March 2024, this metric has rapidly declined, highlighting a drop in user activity and transaction volumes.
This downward trend reflects a bearish market sentiment, with reduced demand and lower investor participation. For Ethereum to recover and potentially embark on a long-term sustainable rally, this trend must reverse. A resurgence in the number of active addresses would indicate growing interest and accumulation of Ethereum, signaling more robust demand and the possibility of a bullish market reversal.
 Source: TradingView
The post Ethereum Price Analysis: Critical Technical Warning Flashes for ETH as $2.1K Seems Imminent appeared first on CryptoPotato.


 English (US) ·