
 3 months ago
49
3 months ago
49
- Ethereum shows bearish divergence between price and on-chain metrics
- Breakdown below key support band adds technical weakness
- $2,150 level becomes critical for potential stabilization or further decline
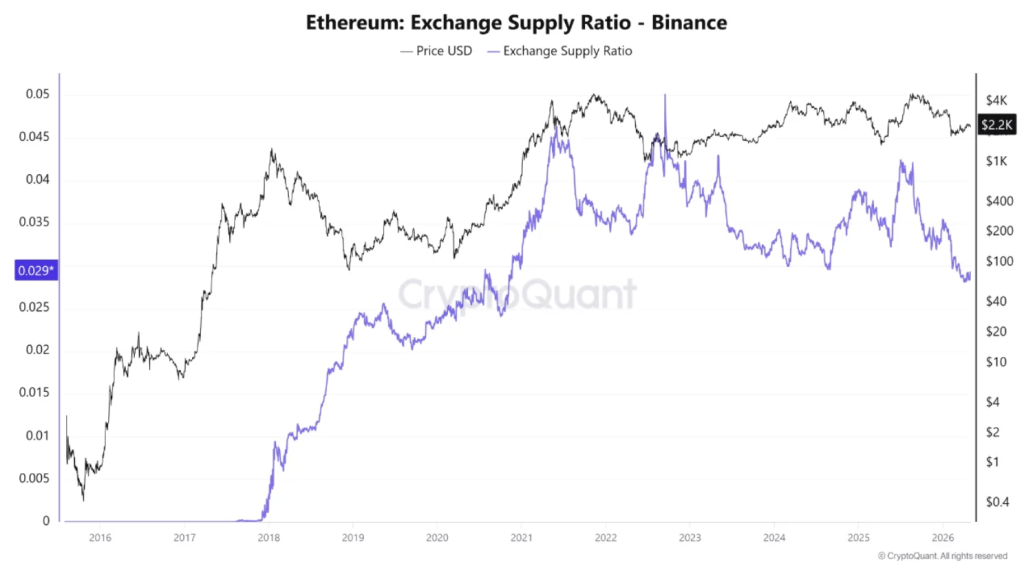
Ethereum might be setting up for another drop, and this time the warning signs aren’t just coming from one place. Both on-chain data and technical structure are starting to lean in the same direction, which, honestly, tends to get traders a bit uneasy. One metric in particular, the Exchange Supply Ratio, has fallen to unusually low levels, but price hasn’t followed with the kind of bottom you’d expect. That mismatch is where things start to feel… off.
On-Chain Divergence Raises Red Flags
The Exchange Supply Ratio basically tracks how much ETH is sitting on exchanges, ready to be traded. When it drops, it usually suggests less selling pressure, which in many cases lines up with price bottoms forming. But right now, that relationship isn’t holding. The ratio has dropped, yet ETH price hasn’t really responded in the way it historically does.
That gap hasn’t gone unnoticed. Analysts, including CryptoQuant’s PelinayPA, have pointed out that this kind of divergence doesn’t usually stick around for long. And when it resolves, it’s often price that adjusts, not the metric. In other words, instead of the ratio bouncing back up, ETH might move lower to close that gap, which isn’t exactly the outcome bulls are hoping for.
There’s also the derivatives market to consider. Leveraged positions can sometimes hold prices up longer than they should, creating a kind of artificial stability. But that support doesn’t last forever, and when it unwinds, things can move pretty quickly, sometimes faster than expected.
Technical Structure Begins to Crack
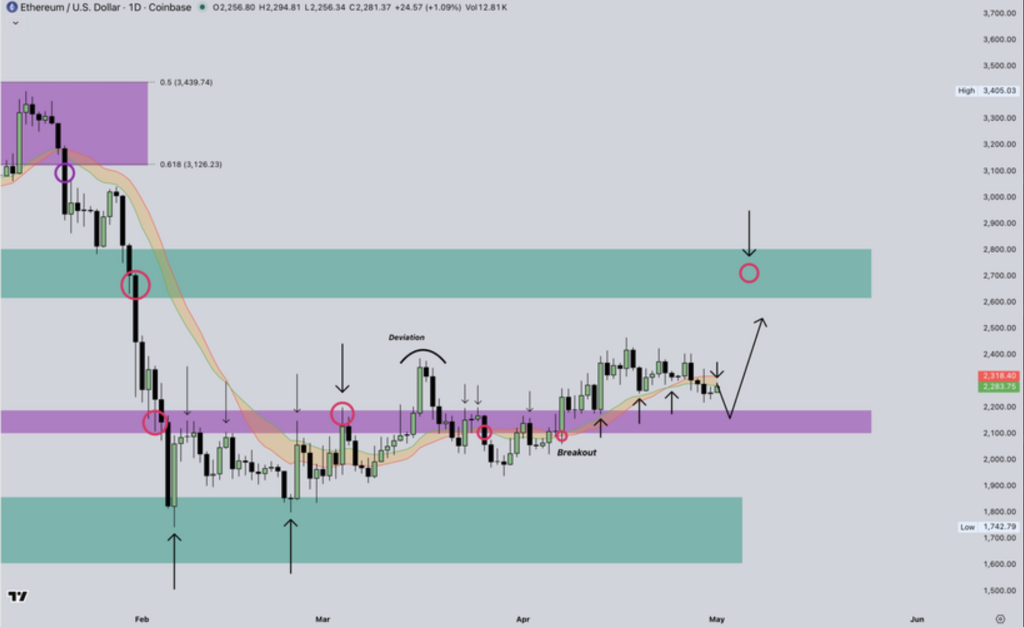
Looking at the chart, the situation doesn’t get much more reassuring. ETH has slipped below the 1-Day Bull Market Support Band, which has acted as a reliable bounce zone in the past. Losing that level, even temporarily, changes the tone of the market a bit. It doesn’t guarantee a breakdown, but it definitely opens the door for one.
Some analysts think this could still be a short-term deviation, just a brief dip before recovery. But if price fails to reclaim that band soon, attention shifts lower, and fairly quickly. There’s a growing sense that the structure is starting to weaken, even if it’s not fully broken yet.
Key Levels Could Decide the Next Move
The next major level to watch sits around $2,150, which previously acted as resistance and could now flip into support. That area is already on the radar for some traders looking to accumulate, assuming price stabilizes there. If ETH holds that zone, it might set the stage for a more sustained move higher later on, but that’s still a big if.
If, on the other hand, that level doesn’t hold, the downside could extend further, and momentum might shift more clearly in favor of sellers. For now, the setup feels a bit fragile, like it’s waiting for a push in either direction.
Downside Risk Remains Until Signals Align
At the moment, both the on-chain data and technical structure are pointing toward caution. The divergence hasn’t resolved, and key support levels are being tested rather than firmly held. Until ETH manages to reclaim its Bull Market Support Band and align more cleanly with its on-chain signals, the risk of another dip remains very real.
It’s not a certainty, of course, markets rarely are, but right now, the downside case seems a bit more grounded than the bullish one.
Disclaimer: BlockNews provides independent reporting on crypto, blockchain, and digital finance. All content is for informational purposes only and does not constitute financial advice. Readers should do their own research before making investment decisions. Some articles may use AI tools to assist in drafting, but every piece is reviewed and edited by our editorial team of experienced crypto writers and analysts before publication.


 English (US) ·