
 1 month ago
41
1 month ago
41
- Ethereum remains below $1,600 after weeks of heavy selling, but bearish positioning in derivatives has begun to cool.
- Leverage across ETH futures has dropped sharply, reducing liquidation risk even as ETF outflows continue.
- Technical indicators remain bearish, with key support levels sitting at $1,524 and $1,404.
Ethereum continues to trade under pressure as the broader crypto market struggles to regain momentum. ETH remains below the $1,600 mark after falling nearly 7% over the past week, extending its monthly decline to more than 23%. While the price action still favors the bears, a closer look beneath the surface suggests the selling frenzy may be starting to lose some steam.
The latest derivatives data shows that many short traders have already locked in profits following Ethereum’s sharp fall from above $2,000 to around $1,560. That shift doesn’t necessarily signal a trend reversal, but it does hint that downside momentum may not be as aggressive as it was just a few weeks ago.
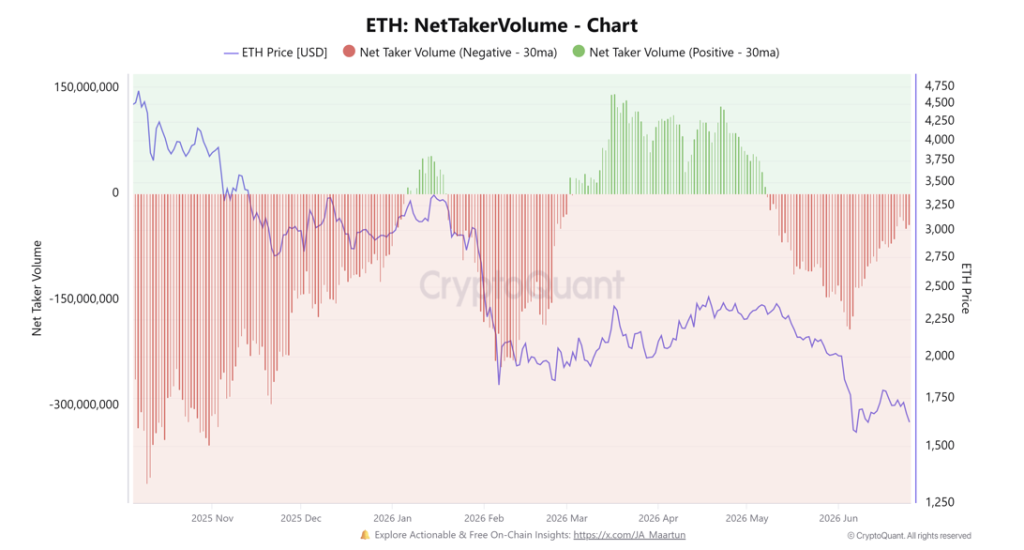
Short Sellers Are Beginning to Ease Off
One of the clearest signs comes from Ethereum’s Net Taker Volume, which has been steadily recovering after spending weeks deep in negative territory.
This metric measures the balance between aggressive buyers and aggressive sellers in perpetual futures markets. When it remains heavily negative, sellers dominate. As the indicator begins moving back toward neutral, it suggests short-side pressure is gradually fading.
The reason isn’t complicated. Many bearish positions have already become profitable after Ethereum’s steep decline, reducing the urgency for traders to continue opening new shorts at current prices.
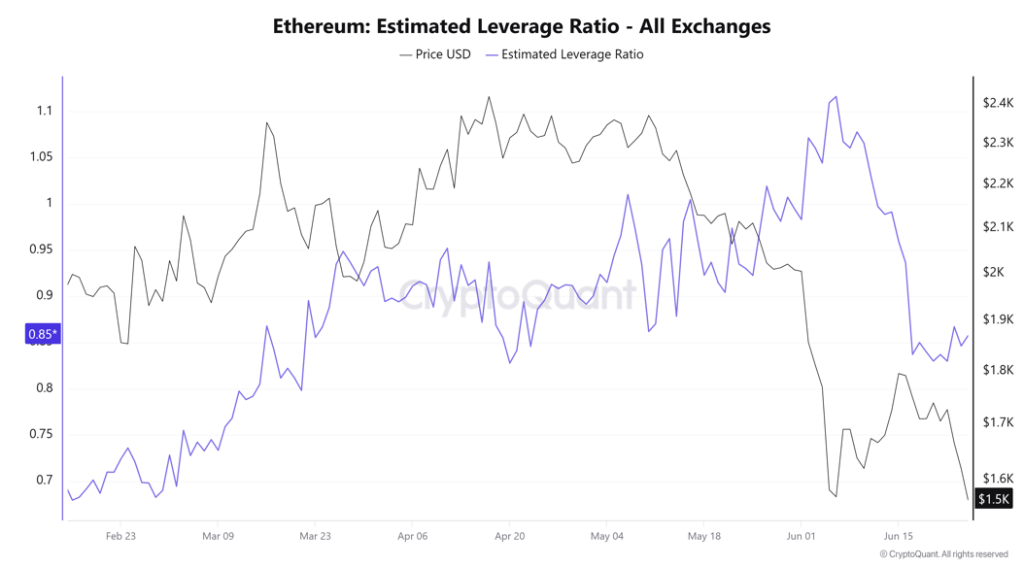
Futures Market Has Undergone a Healthy Reset
Ethereum’s Estimated Leverage Ratio has also fallen considerably during the past three weeks, dropping from roughly 1.11 to 0.85.
That decline is significant because it shows much of the excessive leverage that previously built up in the market has now been flushed out. Large liquidations have removed many highly leveraged positions, leaving the futures market in a healthier state with less risk of another chain reaction of forced selling.
Still, caution remains warranted.
Funding rates across ETH perpetual futures continue to lean slightly negative, indicating bearish sentiment has not disappeared entirely. Traders are still paying to maintain short positions, although conviction appears noticeably weaker than before.
Institutional Demand Remains Soft
The spot ETF market has offered little encouragement.
U.S. spot Ethereum ETFs have now recorded six consecutive days of net outflows, according to SoSoValue data, putting the products on pace for a seventh straight week of withdrawals. If that trend continues, it would mark the largest weekly outflow since January.
Institutional demand has clearly slowed, and that lack of fresh capital continues weighing on Ethereum’s recovery attempts.
Another metric investors are watching closely is Ethereum’s Realized Price Lower Band, an on-chain indicator that has historically identified major bear market bottoms. Based on previous cycles, the model suggests ETH could still decline by nearly 30% before establishing a long-term floor. That isn’t a prediction, but it remains an important level many analysts are monitoring.
Key Technical Levels Remain in Focus
From a technical perspective, Ethereum still faces an uphill battle.
The weekly chart shows ETH trading below every major exponential moving average. The 7-week EMA near $1,817, the 20-week EMA around $2,118, and the longer-term 50-week EMA near $2,525 all remain well above the current price, reinforcing the broader downtrend.
Momentum indicators paint a slightly more balanced picture. The Relative Strength Index has fallen to around 30, placing Ethereum close to oversold territory, while the Stochastic Oscillator has dropped below 10. Those readings suggest selling pressure may be reaching exhaustion, even though buyers have yet to seize control.
Earlier this week, ETH attempted to recover but was rejected near the descending trendline resistance around $1,741 before falling back toward support.
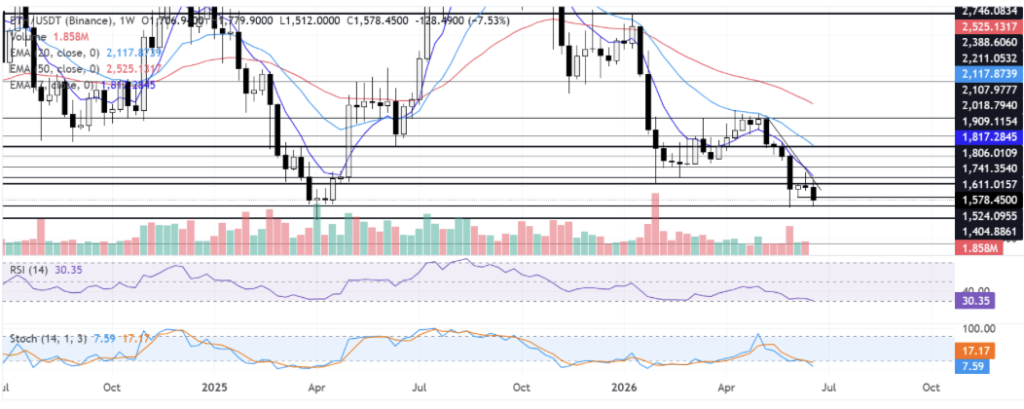
Where Ethereum Could Move Next
The first level bulls need to reclaim remains the descending trendline, followed by resistance around $1,741, $1,806, and the 7-week EMA. Beyond those areas, additional hurdles appear near $1,909, $2,019, $2,108, and finally $2,211.
On the downside, immediate support sits near $1,524, which Ethereum recently tested. If that level breaks, attention shifts toward $1,404. A deeper correction could eventually expose the stronger long-term support zone near $1,156.
For now, Ethereum remains trapped between weakening bearish momentum and an overall trend that still points lower. The derivatives market looks healthier than it did a few weeks ago, but until institutional demand returns and key resistance levels are reclaimed, the broader outlook remains cautious.
Disclaimer: BlockNews provides independent reporting on crypto, blockchain, and digital finance. All content is for informational purposes only and does not constitute financial advice. Readers should do their own research before making investment decisions. Some articles may use AI tools to assist in drafting, but every piece is reviewed and edited by our editorial team of experienced crypto writers and analysts before publication.


 English (US) ·