
 2 months ago
40
2 months ago
40
Ethereum (ETH) price is flashing the same bearish warning that preceded a near 9% correction last week, with the signal reappearing on April 22.
However, underlying positioning has shifted. Whale accumulation and a flip in funding rate suggest the path this time could differ from the April 17 unwind, even though the core divergence remains intact.
RSI Divergence Flashes a Second Time as Whales Shift Stance
Ethereum (ETH) price is flashing a regular bearish divergence for the second time in five weeks. The Relative Strength Index (RSI), a momentum indicator, peaked at 66.54 on March 16. When price pushed to a higher high on April 22, RSI failed to match that peak, leaving a lower high on the oscillator. The reading signals weakening momentum.
The same pattern appeared between March 16 and April 17. Back then, it triggered an 8.88% correction before ETH found its footing at $2,252.
Want more token insights like this? Sign up for Editor Harsh Notariya’s Daily Crypto Newsletter here.
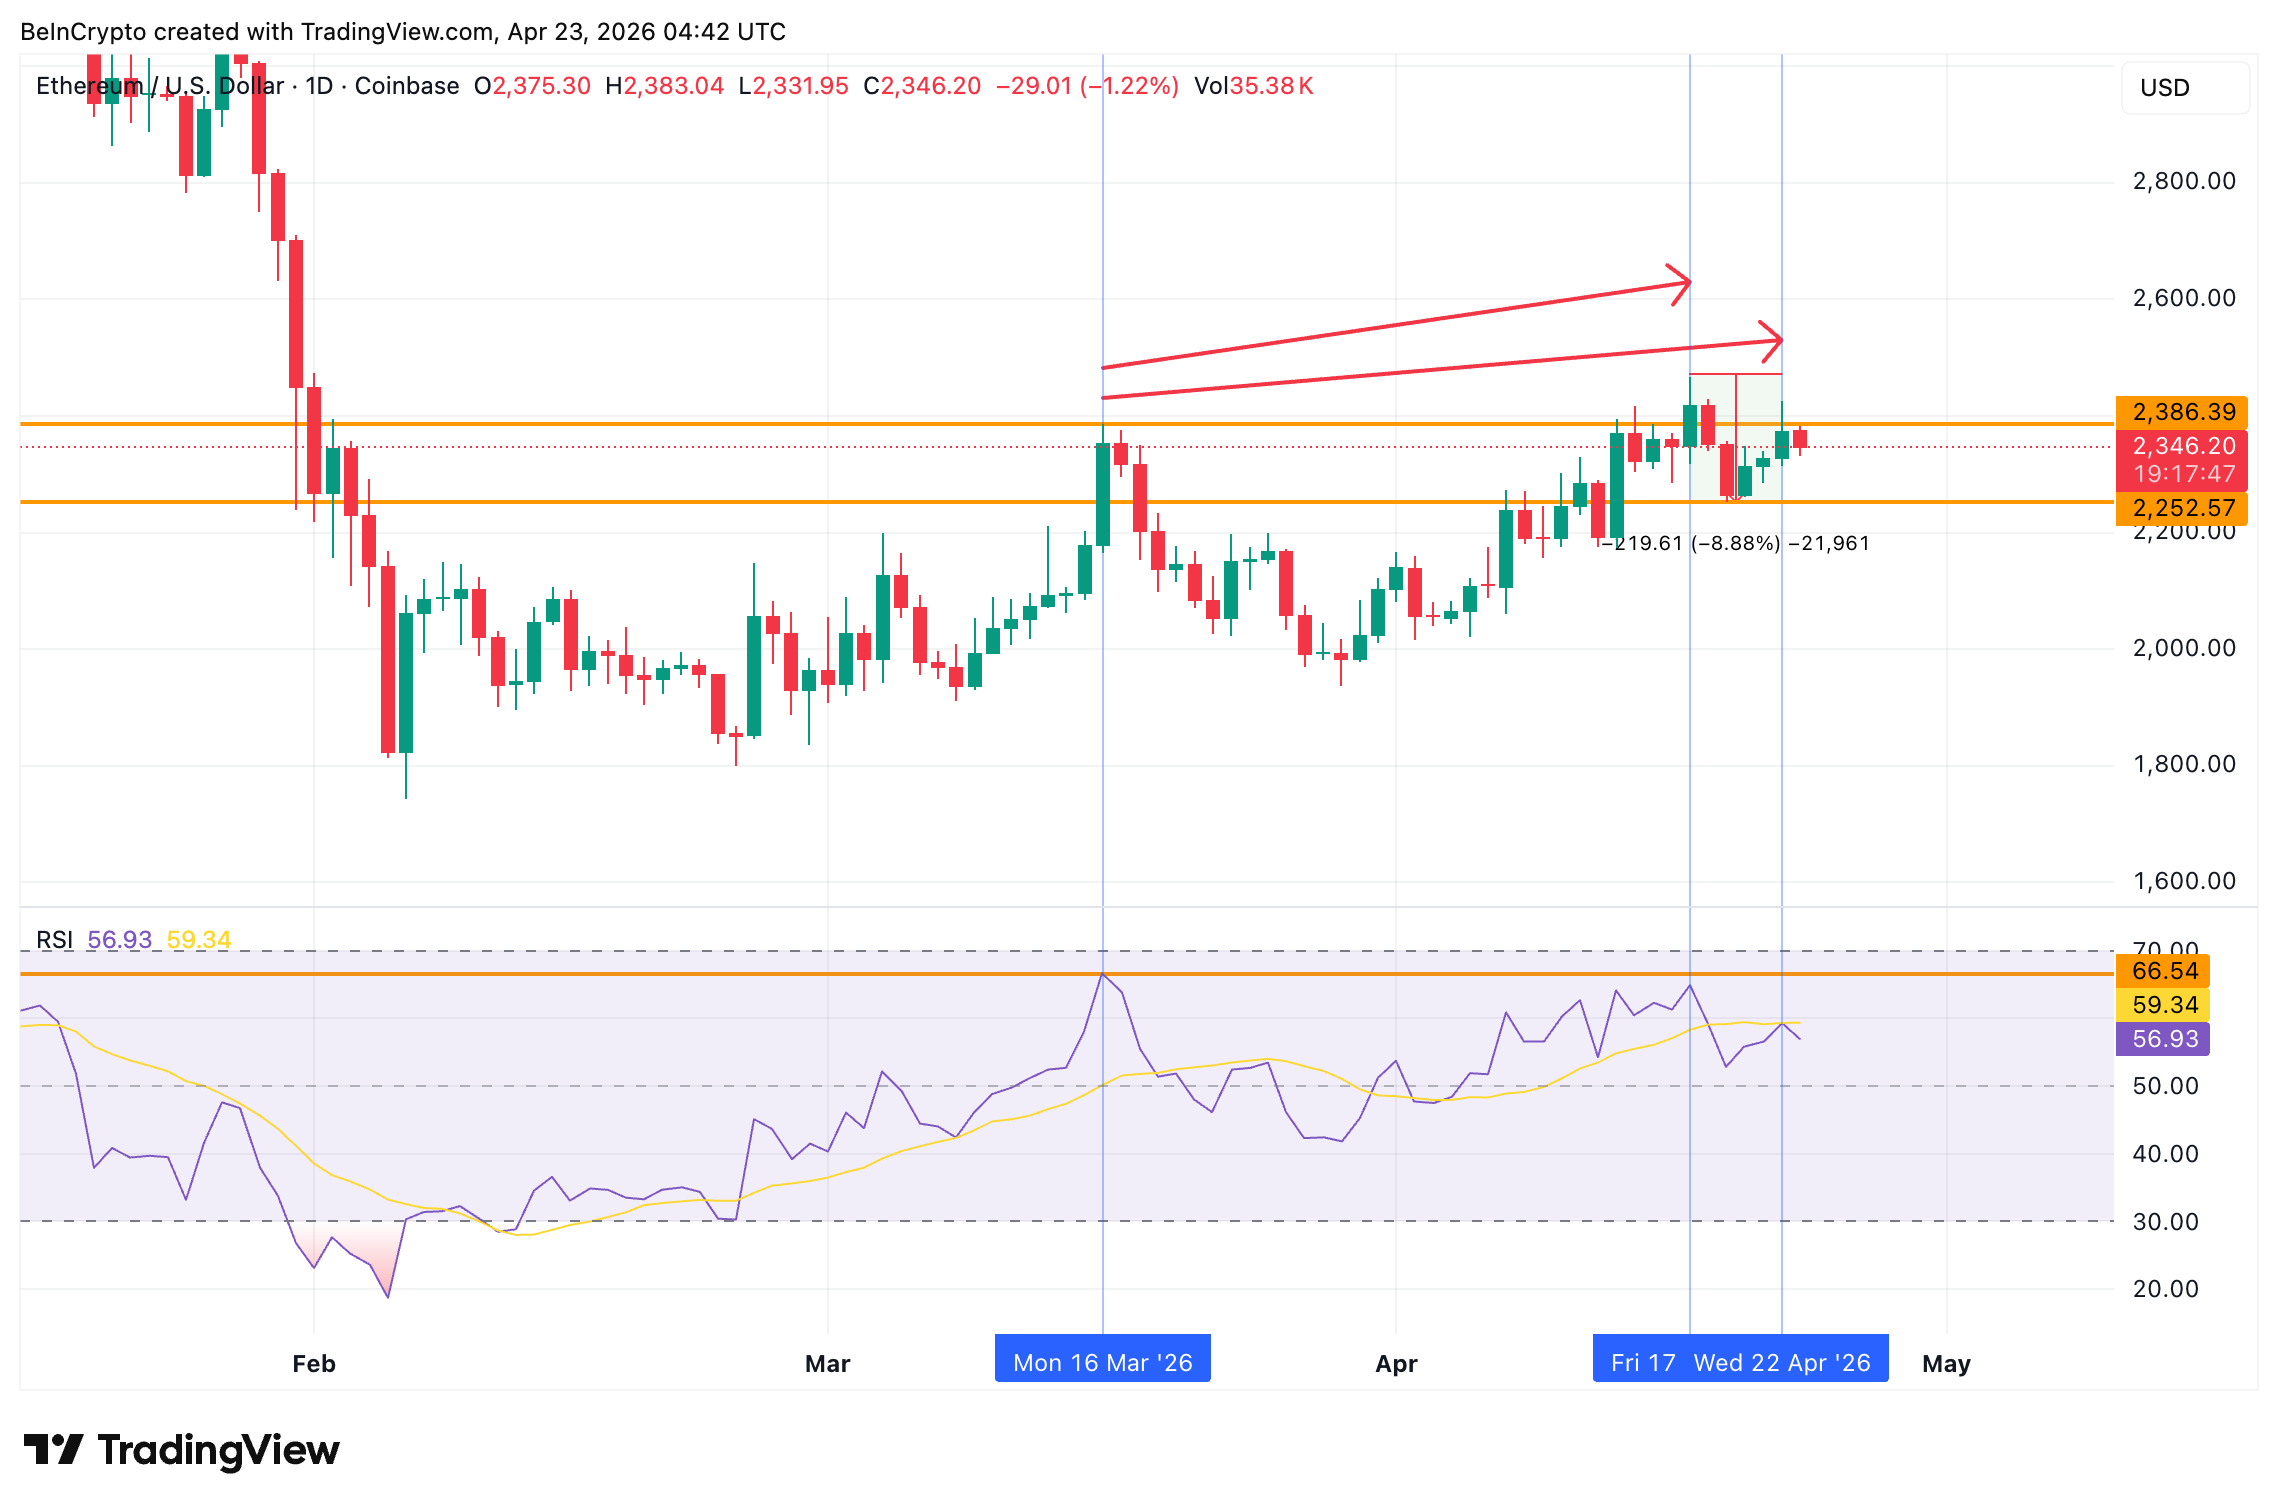 Ethereum Price Divergence: TradingView
However, whale behavior looks different this time. The data suggests Ethereum whales may have begun adding supply again. Their holdings rose from 123.75 million on April 19 to 123.91 million by April 22.
In contrast, during the April 16-19 unwind, whales dumped reserves as price corrected. The shift in positioning suggests a different backdrop, though the divergence itself remains active. However, traders must keep an eye on whale positioning going ahead as this cohort as a tendency to drop reserves suddenly.
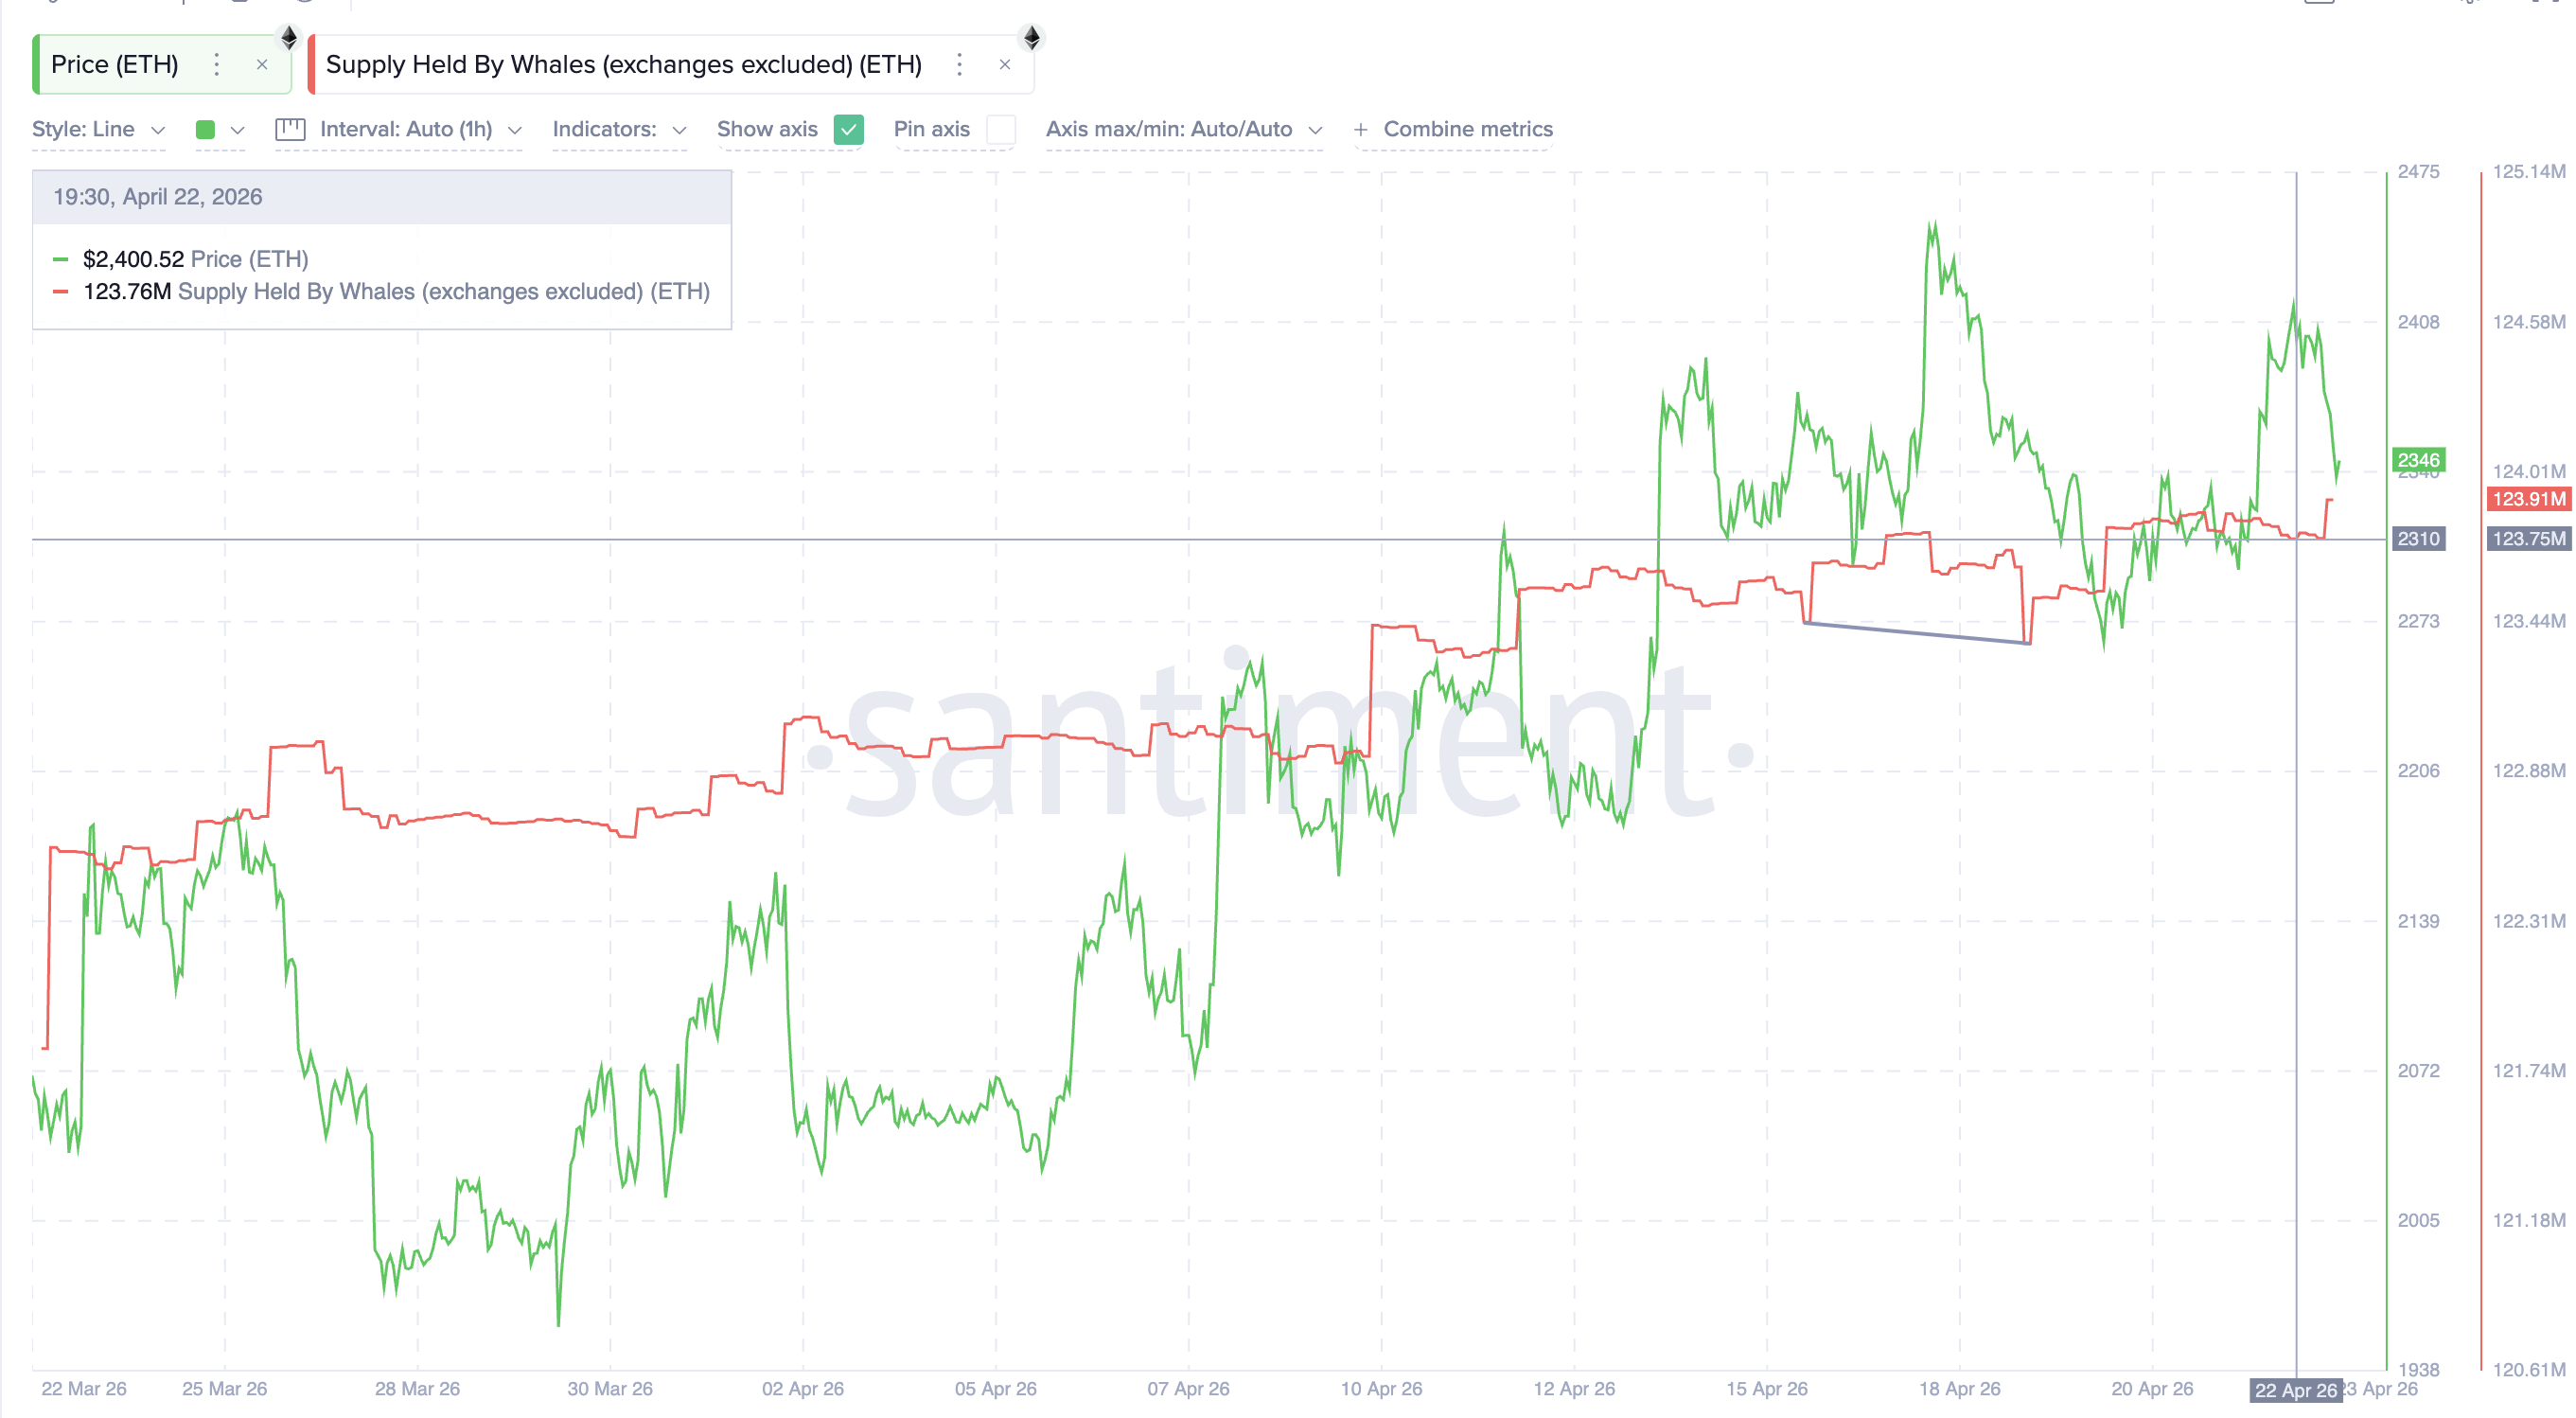 Ethereum Whale Supply: Santiment
Whether funding rate and open interest confirm this shift determines whether the divergence produces another deep pullback.
Funding Rate Flip Contrasts With Last Week’s Setup
The derivatives market shows a different positioning setup versus mid-April. ETH open interest sits near $12.3 billion, comparable to the reading when the April 17 divergence fired. However, Ethereum funding rate has flipped.
On April 17, funding sat at -0.003%, pointing to a short-biased market. That short-biased skew set up a squeeze dynamic. Once price reversed off the April 19 low (after the divergence played out), the trapped shorts had to cover, which helped fuel the rebound. In contrast, funding rate now sits slightly positive, implying traders are leaning long.
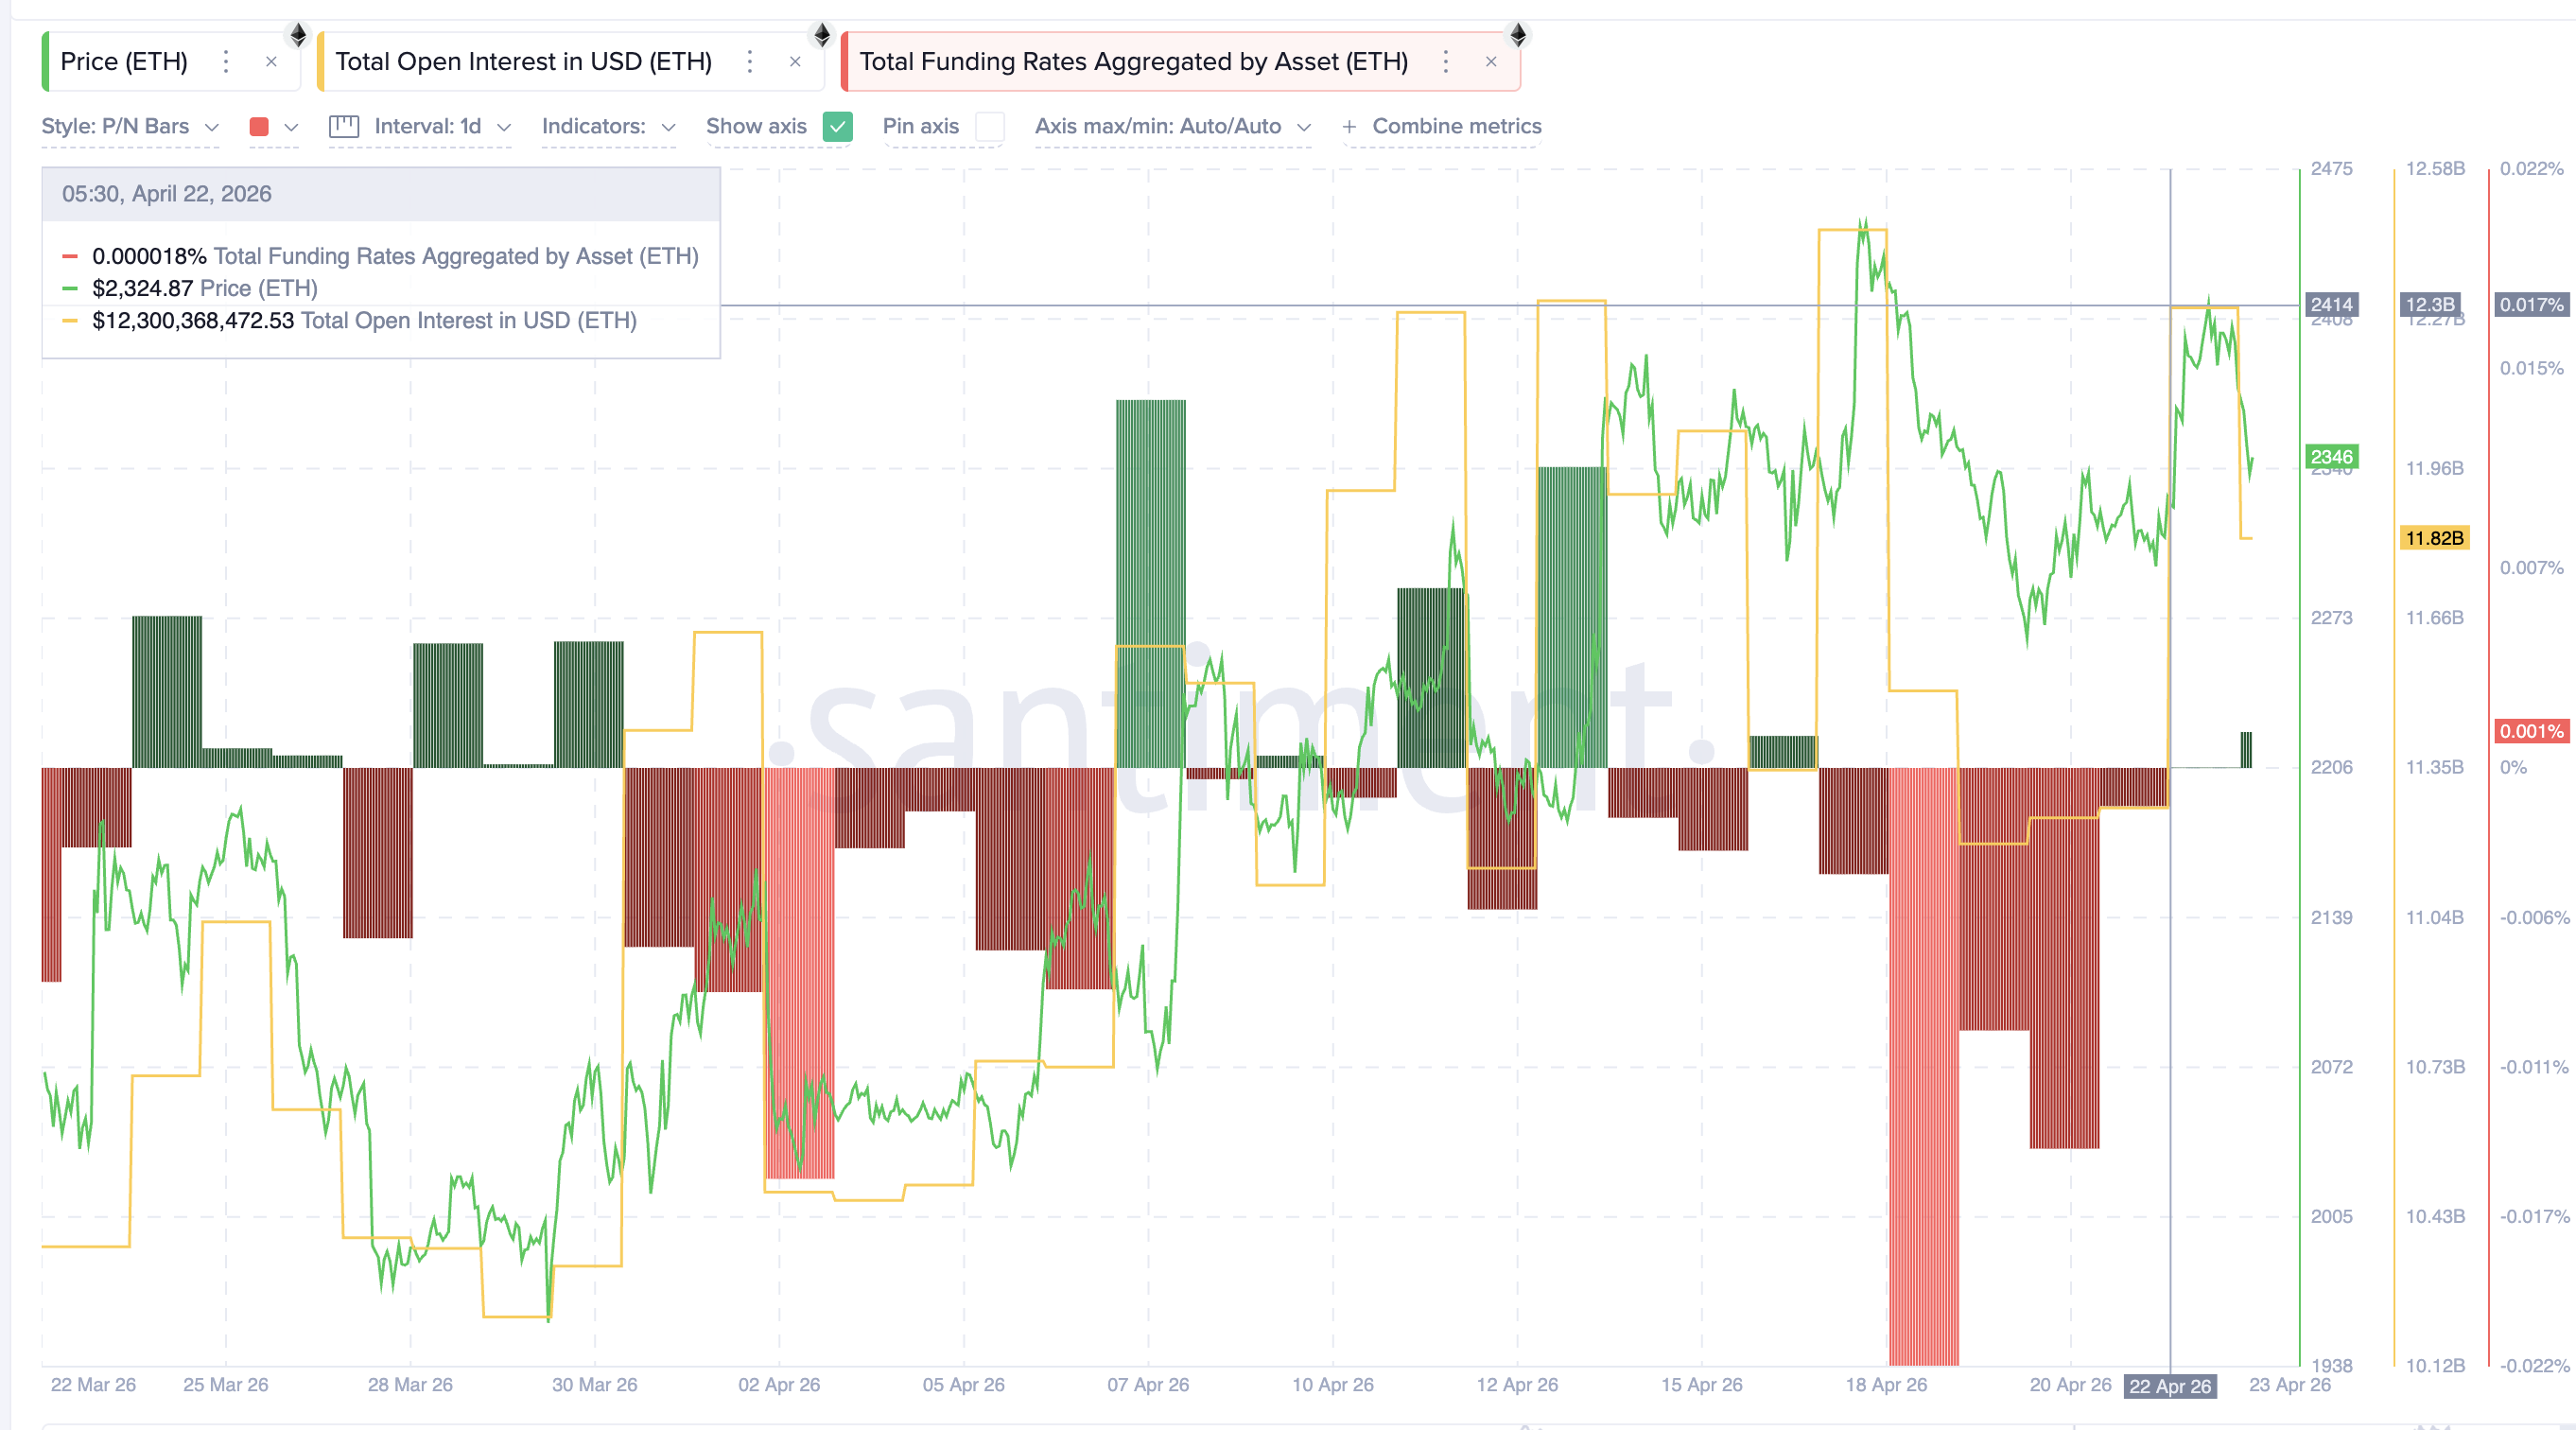 Ethereum Open Interest and Funding: Santiment
The shift matters. Long-biased positioning, albeit mild, facing a bearish divergence creates the opposite setup from last week. If a pullback does start, long liquidations would amplify the downside rather than squeeze shorts into a rebound. Yet funding rates remain far from the extremes needed to force an immediate squeeze in either direction.
With whale flow supporting the upside but positioning leaning long, the Ethereum price chart becomes the decider.
Key Ethereum Price Levels Define the Next Move
The ETH price chart lays out the decision zones. For invalidation of the bearish setup, ETH needs to close above $2,377, the 0.236 Fibonacci level, which currently caps the bounce.
The downside case hinges on whales holding their current stance. If ETH cannot reclaim $2,377 and whale reserves drop, the $2,252 level becomes the first test, mentioned earlier. That level aligns with a concentrated ETH cost basis cluster.
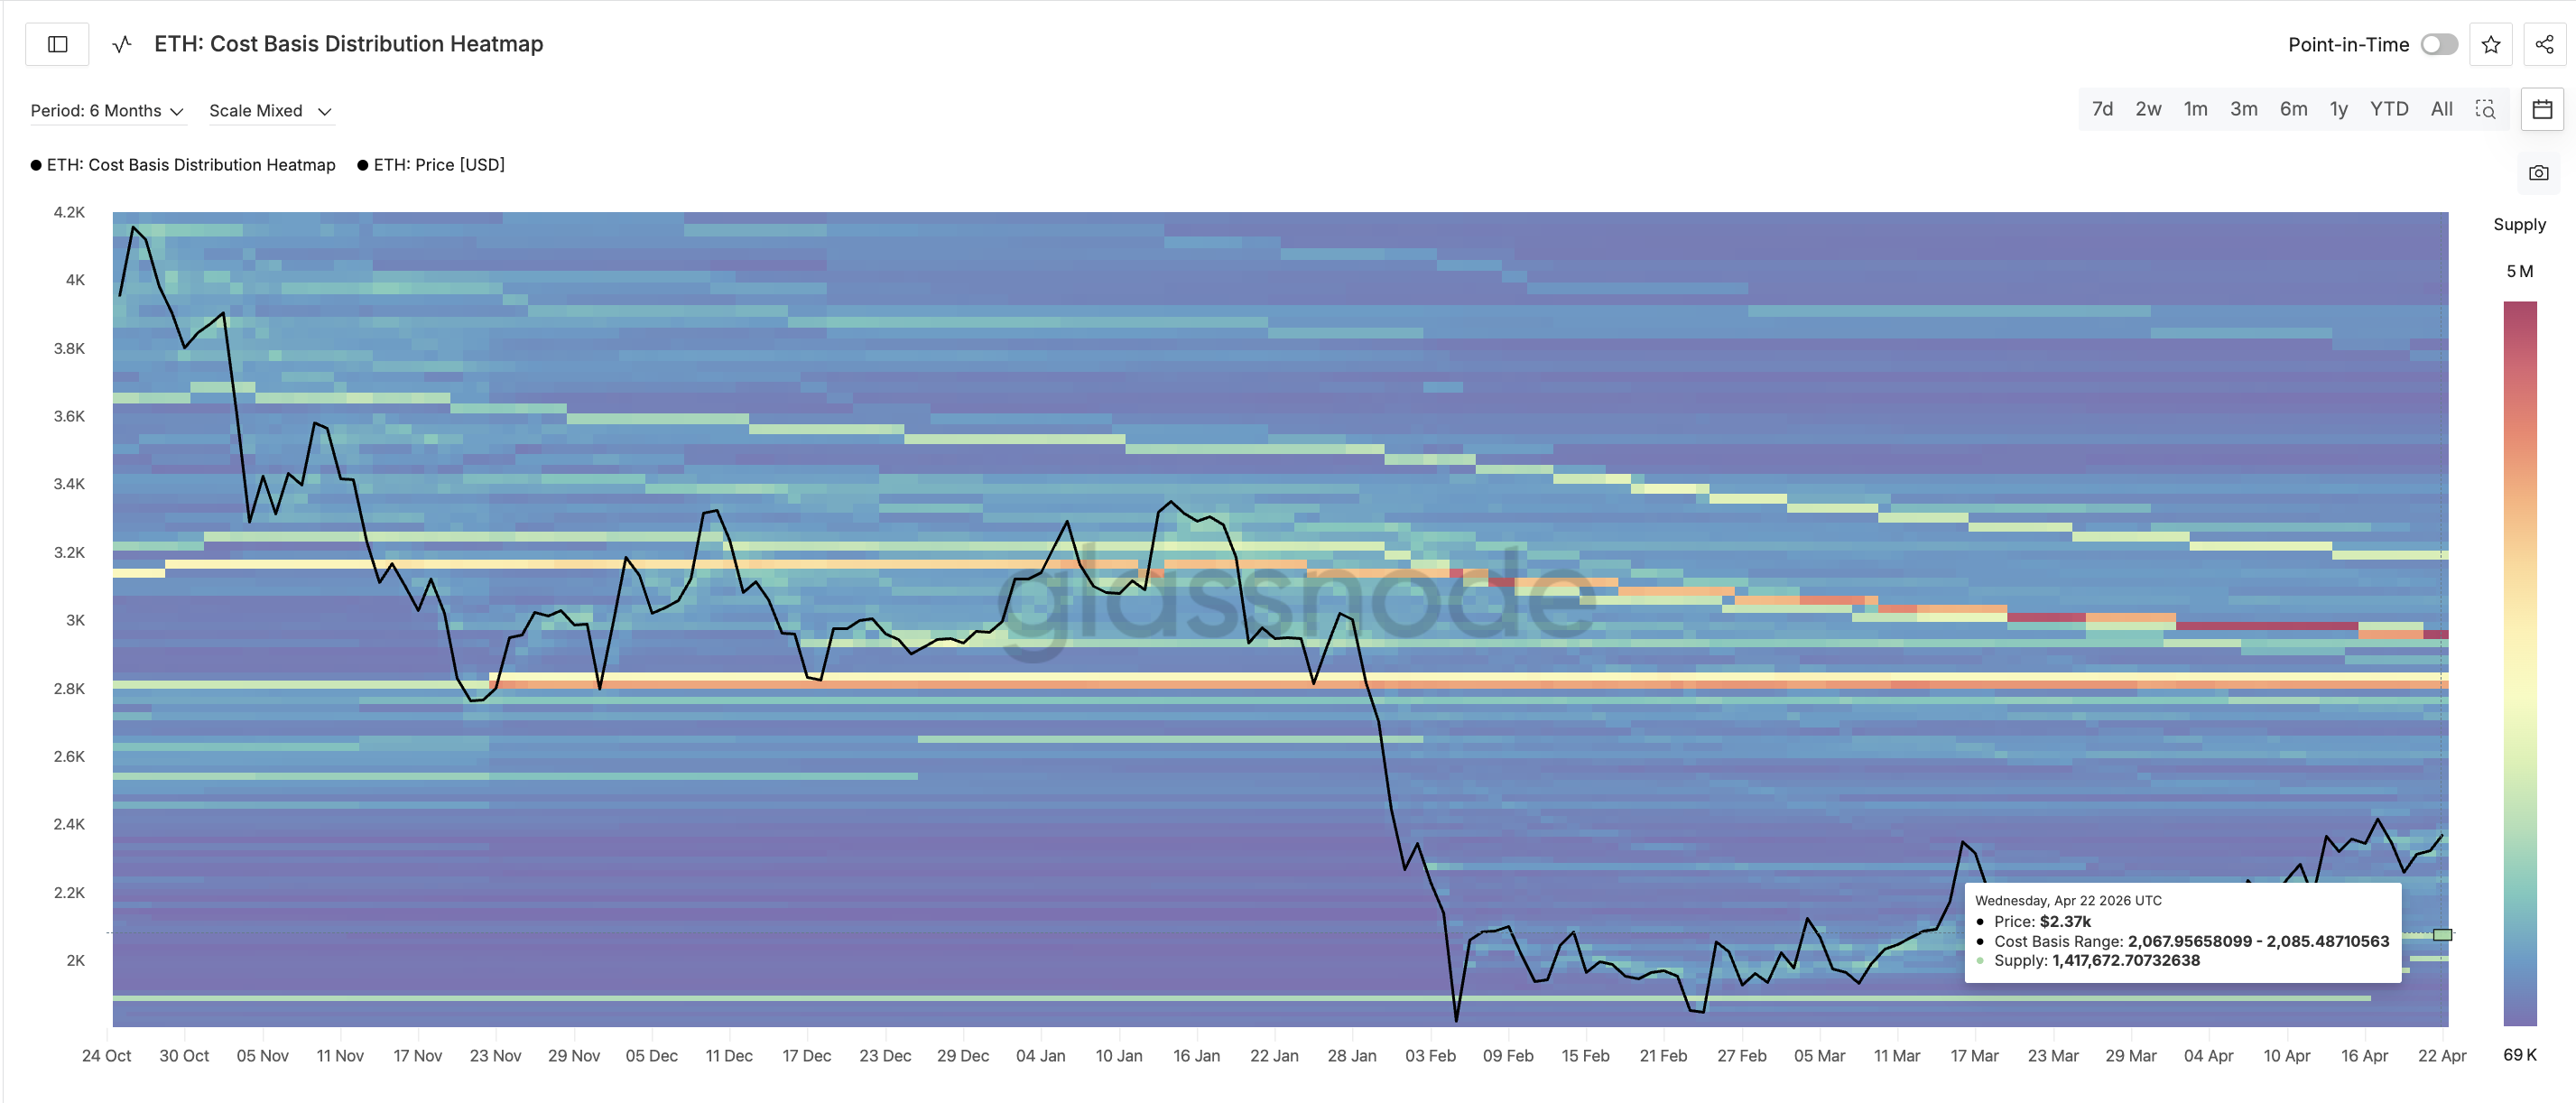
Glassnode data shows 716,028 ETH sitting between $2,231 and $2,250 in cost basis terms. Holders at this cost basis did not sell during the April 17-19 correction. That is likely why $2,252 held as support last time.
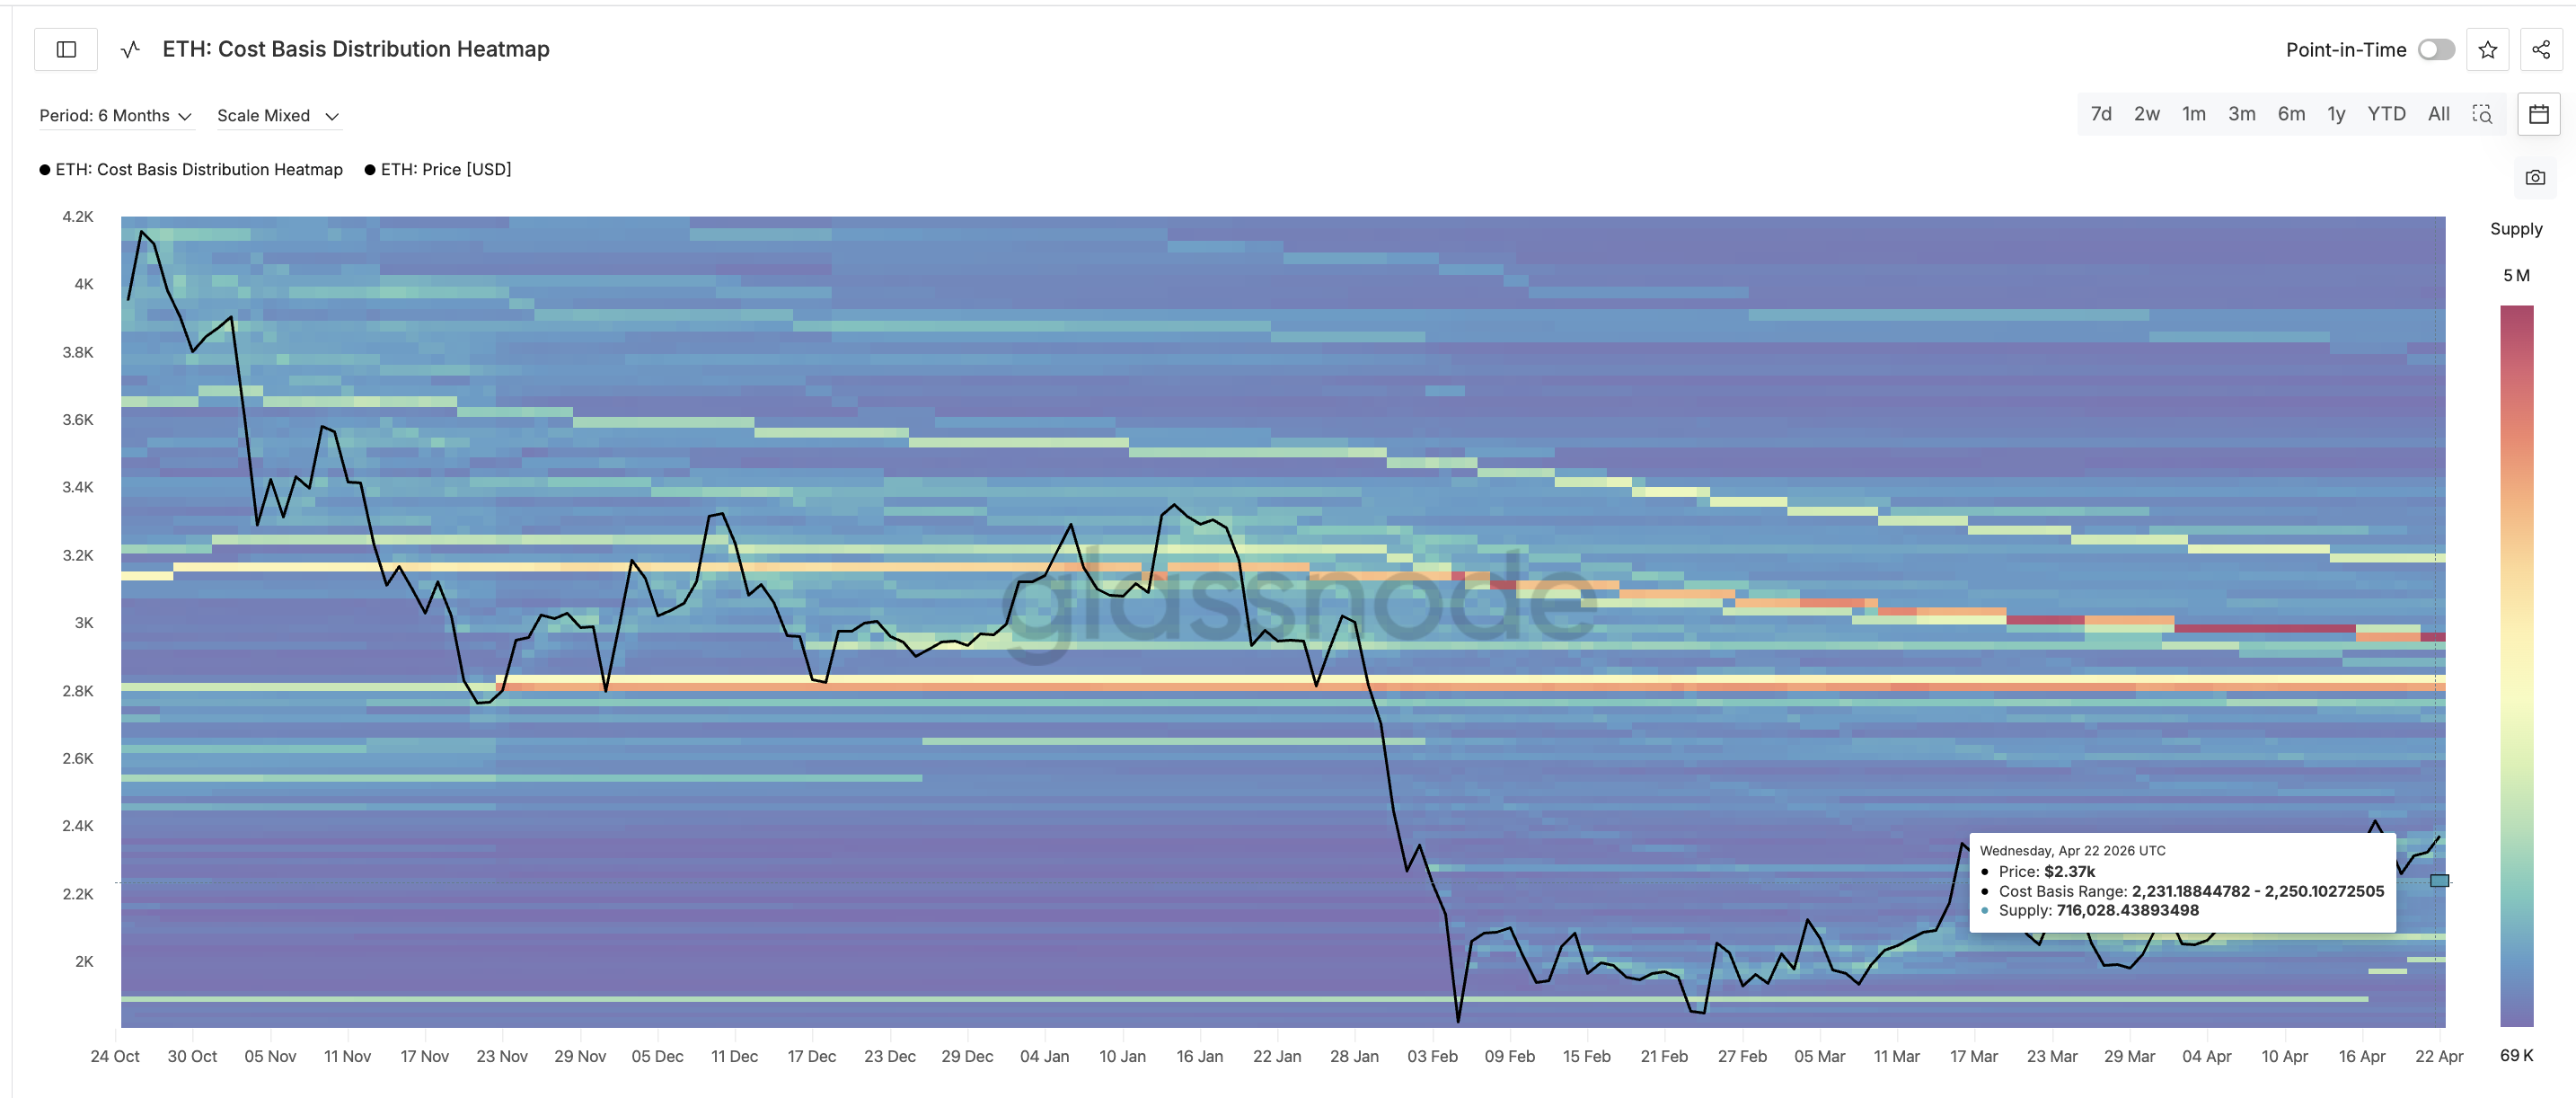 ETH Cost Basis Cluster $2252: Glassnode
If $2,252 fails, the next key demand zone sits between $2,067 and $2,085. That cluster holds 1,417,672 ETH at cost basis, nearly double the supply anchored at the $2,252 level.
 ETH Cost Basis Cluster $2085: Glassnode
A break below that exposes lower levels on the ETH price chart, something around $1,935.
One nuance matters. The divergence is active, but whale flow has shifted since April 17. A correction may not play out as deeply this time. However, a sustained whale distribution would strip away the primary difference between last week’s setup and today’s.
A daily close above $2,455, the 0.382 Fib, opens a path toward $2,517. Extended targets sit at $2,580, $2,783, and $3,112.
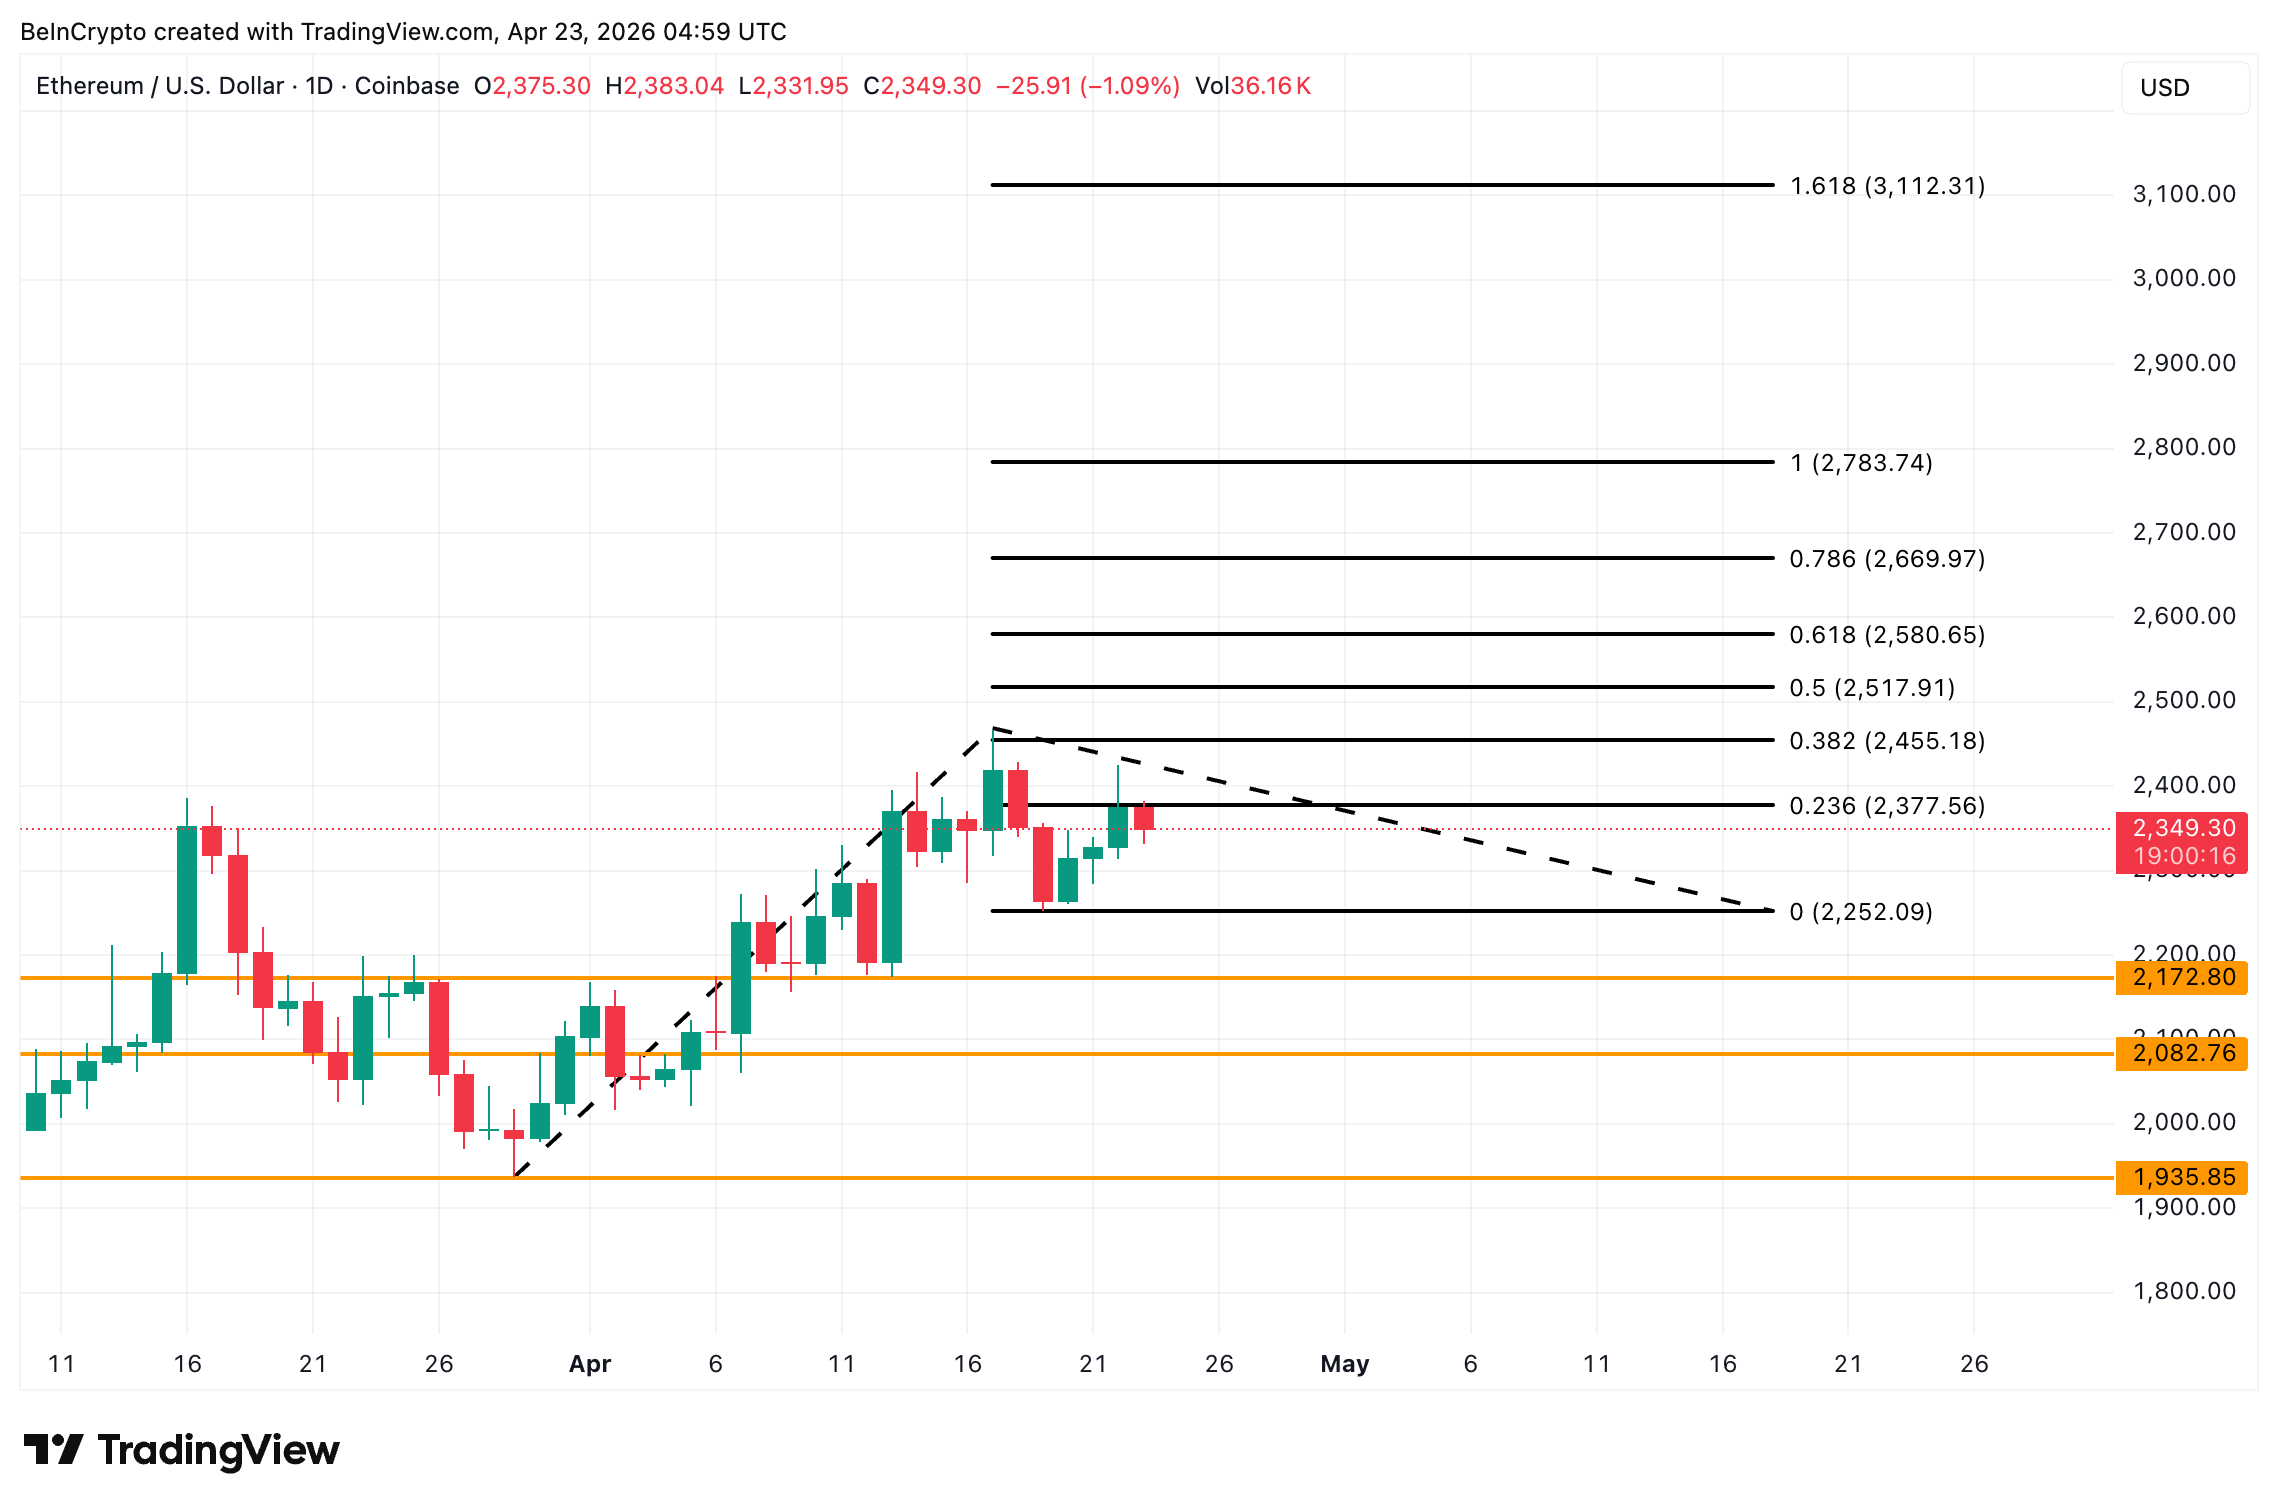 Ethereum Price Analysis: TradingView
However, if $2,252 breaks, the chart has a key level at $2,082, which aligns with the biggest demand zone above $2,000. This means that the $2,252 level separates a shallow pullback from a deeper flush into the 1.4-million-ETH cost basis zone.
The post Ethereum Price Warning Fires Again After a 9% Drop Last Week appeared first on BeInCrypto.


 English (US) ·