
 3 weeks ago
10
3 weeks ago
10
Fantom (FTM) price has yet to validate a bullish pattern that was first registered towards the end of February.
This could occur over the coming days, given the support of the whales, and if FTM reclaims $1 as support.
Fantom Accumulation Continues
FTM price is bouncing back from a key support range, following which it could potentially attempt to push through the resistance at $1.0.
This endeavor is being supported by whales, who have accumulated heavily over the past few days. Addresses holding between 100,000 to 10 million FTM have added more than 19 million FTM worth almost $19 million in the last seven days.
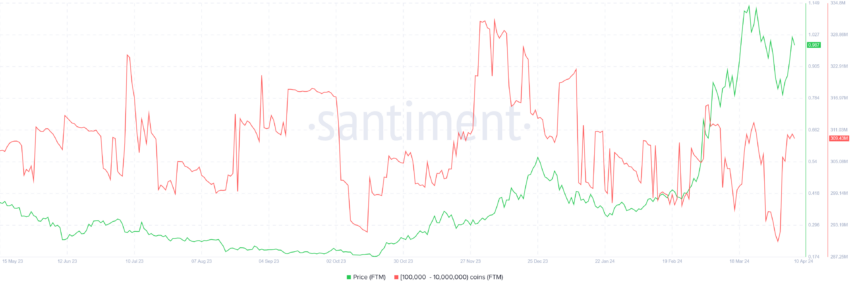 Fantom Whale Accumulation. Source: Santiment
Since whale addresses happen to dominate the circulating supply, their actions tend to impact the price. Accumulation will likely lead to an increase in FTM price if accumulation from these whales continues.
Read More: 9 Best Fantom (FTM) Wallets in 2024
Fantom’s native token on the daily chart also observes bullish cues from the Relative Strength Index (RSI). The Relative Strength Index (RSI) is a momentum oscillator that measures the speed and change of price movements.
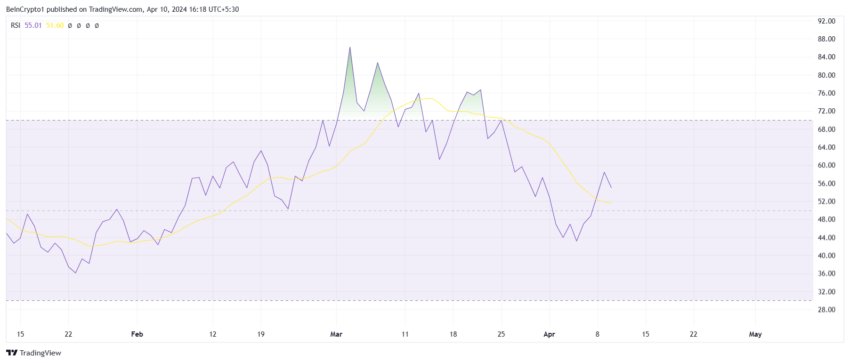 Fantom RSI. Source: TradingView
RSI values range from 0 to 100, indicating overbought conditions above 70 and oversold conditions below 30. Given that it is currently above the neutral mark at 50.0, the RSI is in the bullish zone, suggesting that the Fantom token has the potential to push higher as the RSI remains in a neutral zone.
FTM Price Prediction: Crossing $1 Is the Key
FTM price is presently trading at $0.98, closing in on $1.00. Flipping this level into support will enable the Fantom token to reach the target price of $1.61, which would mark a 55% price increase.
This target was established by the Parabolic Curve Pattern that FTM had noted back in mid-February. Although the altcoin did successfully correct to test the support zone of base 3 price levels, it did not manage to chart the upside.
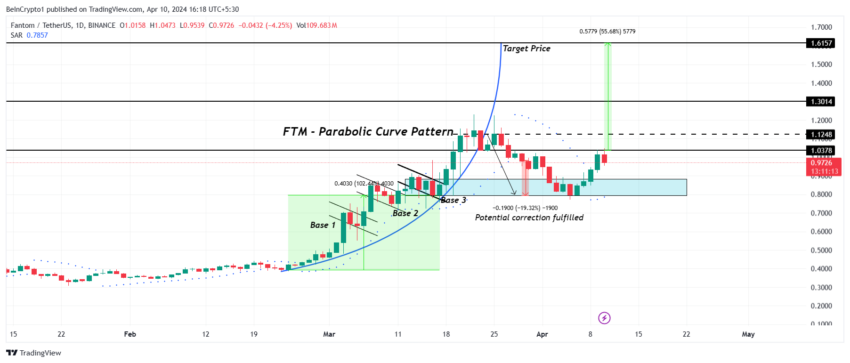 FTM/USDT 1-day chart. Source: TradingView
Read More: Fantom (FTM) Price Prediction 2024/2025/2030
The downside is that if the FTM price fails to breach $1 and trickles back down, it would likely test the support zone again. However, should the Fantom native token fall through this zone, it will invalidate the bullish outlook and likely re-test $0.80 as support.
The post Fantom (FTM) Price Accumulation: Catalyst for a 55% Rally? appeared first on BeInCrypto.


 English (US) ·