
 2 months ago
34
2 months ago
34

Ferrari Stock (RACE) is stabilizing beneath near-term resistance. The daily bias tilts higher, the 1H backdrop remains bullish, yet the 200-day average still caps the broader trend.
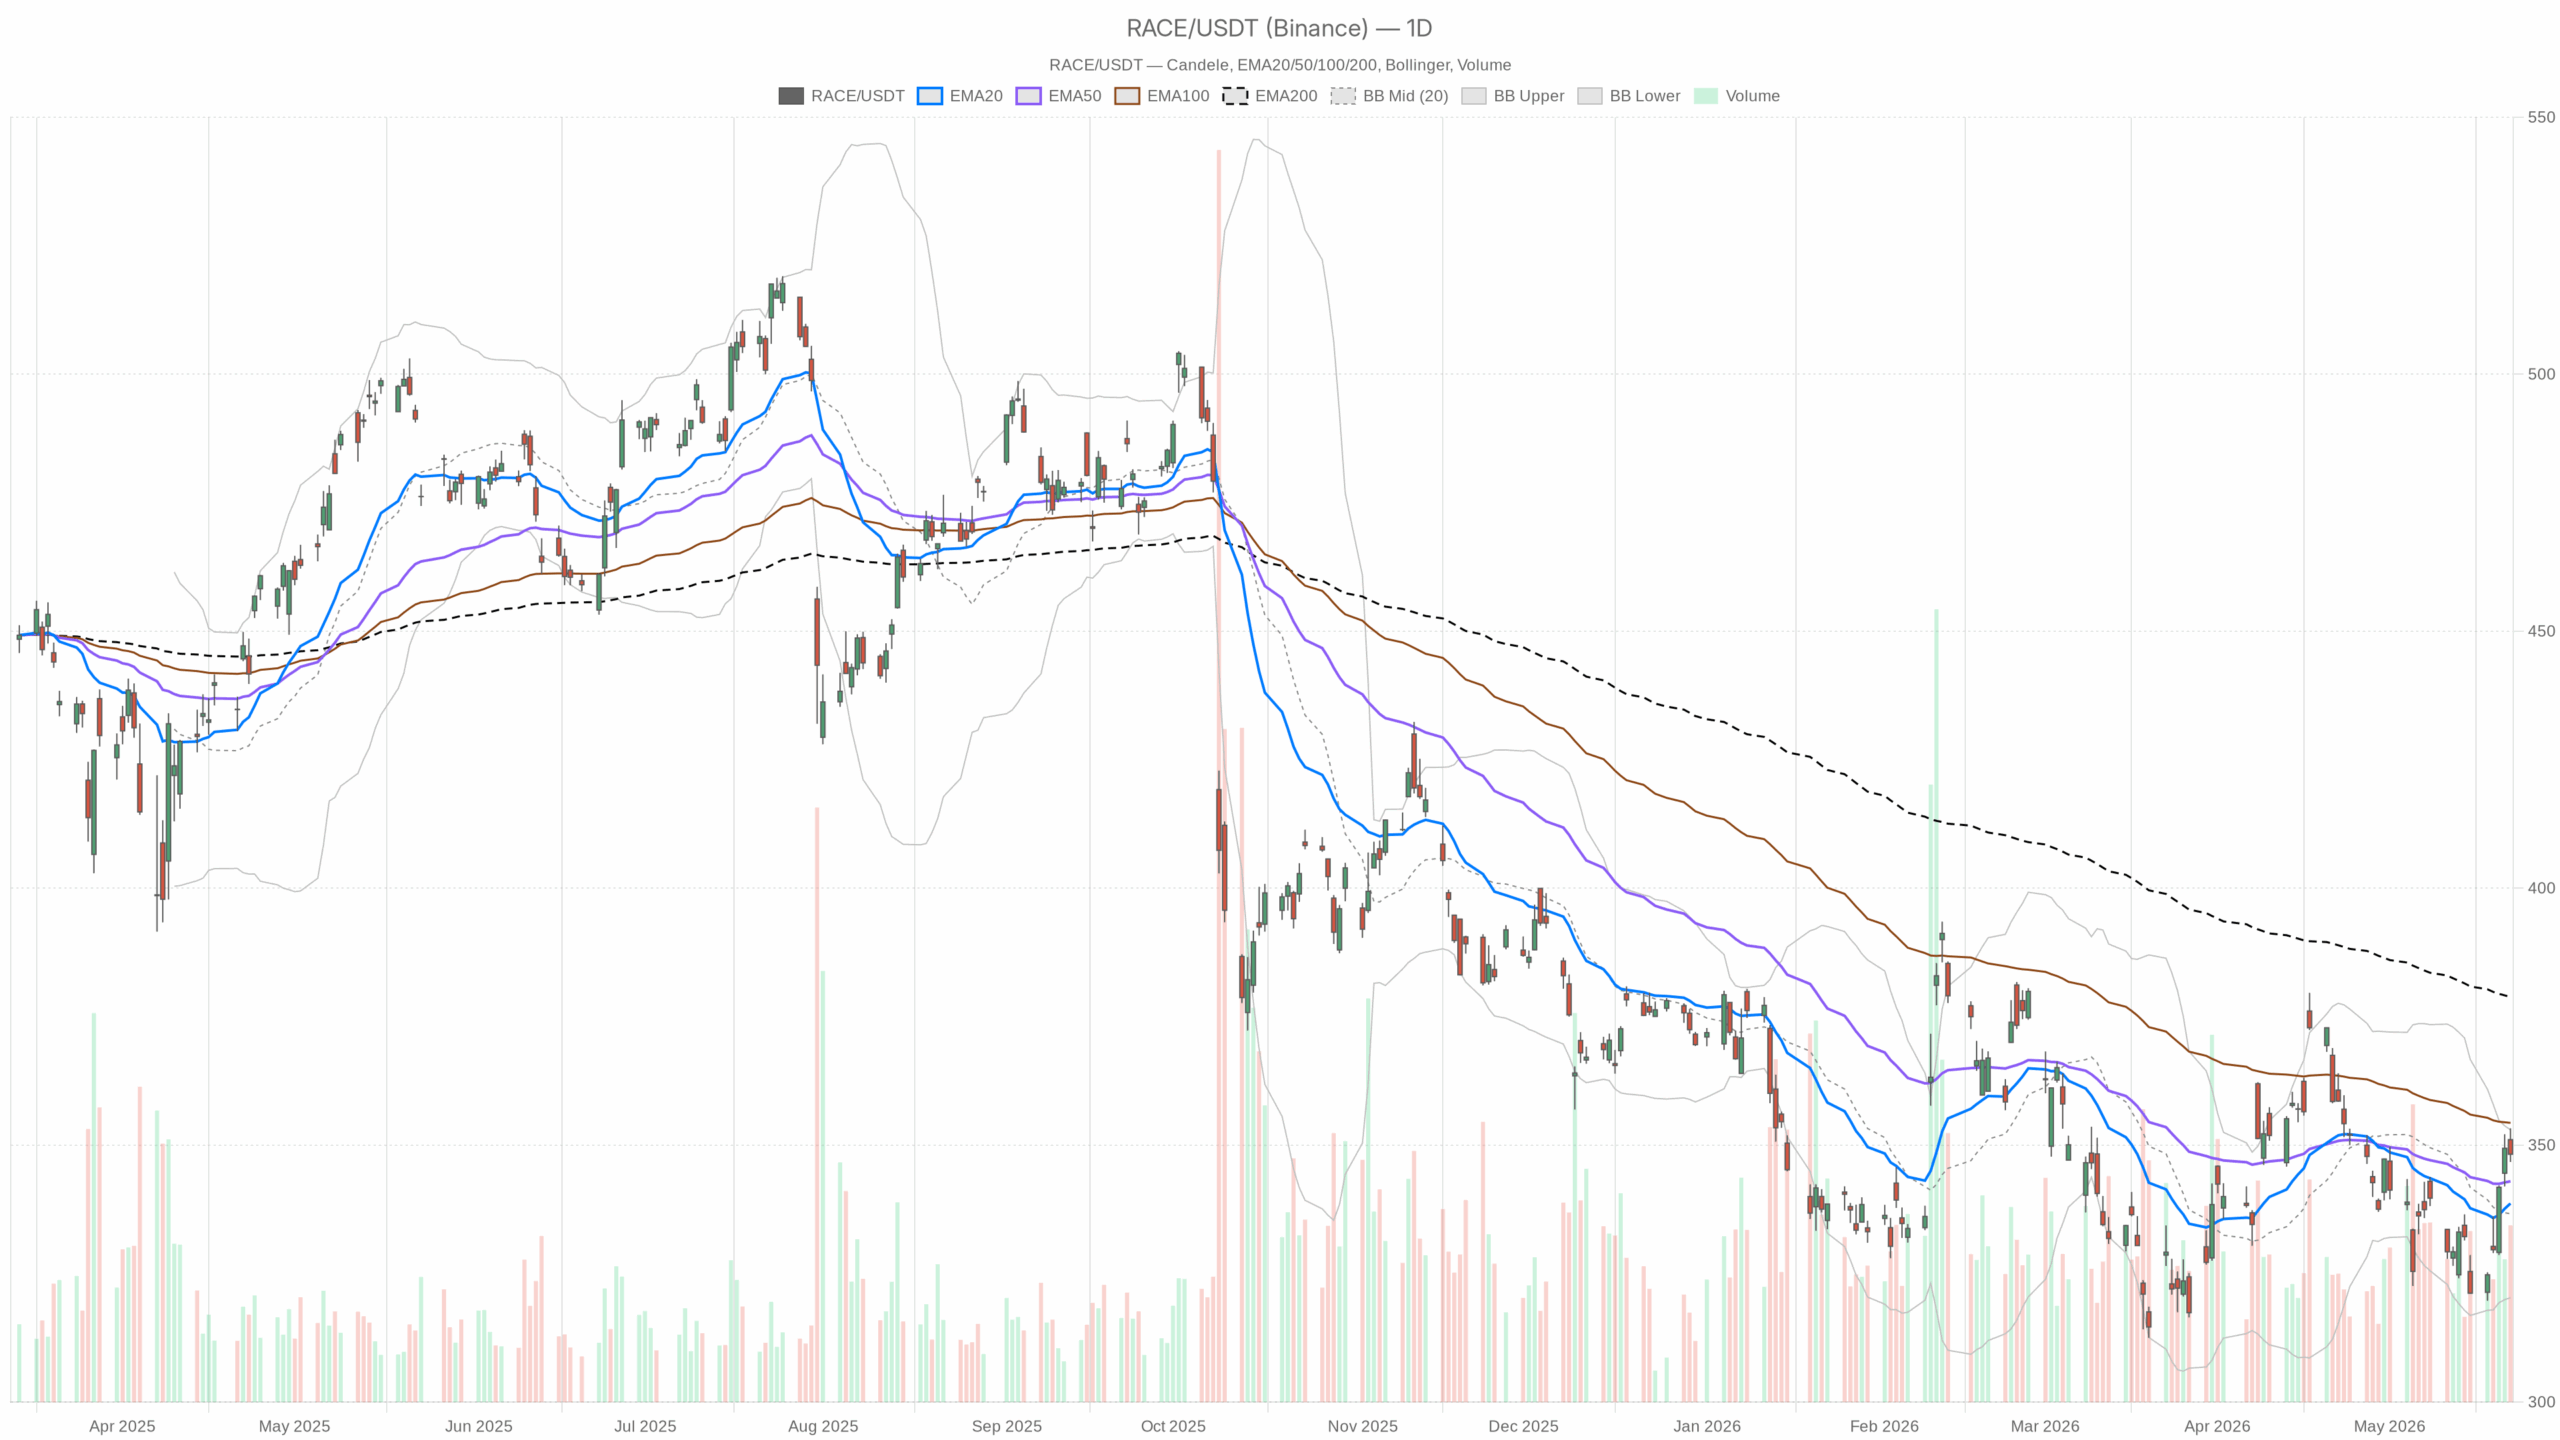 RACE — daily chart with candlesticks, EMA20/EMA50 and volume.
Ferrari Stock Technical Overview
On the daily chart, RACE closed the last session at 348.24. Interpretation: price is holding recent gains but has not broken decisively higher. It sits above the 20-day EMA 338.65 and the 50-day EMA 342.97. Interpretation: short‑term trend support is intact. It remains below the 200-day EMA 378.84. Interpretation: the long‑term trend is still down, keeping rallies in check.
Daily Momentum, Volatility, and Bands
Daily momentum has improved. The RSI(14) at 55.97 signals moderate positive momentum without being stretched. Meanwhile, the daily MACD shows the line at -1.52 vs signal at -3.39 with a +1.86 histogram. Interpretation: momentum is turning up from a weak state.
Bollinger Bands have a mid at 336.66 and an upper band at 352.98. Interpretation: price is leaning toward the upper band, indicating upward pressure but nearby resistance. The ATR(14) is 9.43. Interpretation: volatility is moderate for a stock at this price level.
Daily Reference Levels
Daily reference levels are tight. The pivot point is 349.42 with R1 at 352.10 and S1 at 345.55. Interpretation: the 349–352 zone is the first meaningful ceiling; 345–346 is the first floor.
Intraday Structure: 1H Trend and Signals
On the 1H timeframe, the trend backdrop remains constructive. Price is above the 20-EMA 345.37, the 50-EMA 339.42, and the 200-EMA 339.09. Interpretation: intraday trend alignment is bullish.
The RSI(14) is 62.66. Interpretation: buyers control the tape, though not in extreme fashion. The MACD prints a small negative histogram (-0.47) with the line at 4.27 vs signal at 4.74. Interpretation: momentum is cooling after an advance, not reversing. Bollinger Bands have a mid at 346.13. Interpretation: price is holding above the mean, which supports shallow dip buying.
The 1H ATR is 2.66. Interpretation: intraday swings are manageable. Hourly pivot levels show PP at 347.71 with R1 at 348.68. Interpretation: price is working on resistance just overhead.
15-Minute Execution Layer
On the 15m layer, conditions are mixed. Price is near 348.10 with the EMA20 at 348.93 and EMA50 at 347.37. Interpretation: a short‑term equilibrium with slight resistance overhead and support below.
The RSI(14) is 44.99. Interpretation: momentum is flat to soft short term. The MACD shows a negative histogram (-0.33). Interpretation: consolidation rather than trend. The Bollinger mid is 349.18 with the lower band at 347.40. Interpretation: price is hovering under the mean and near initial support.
The 15m pivot is 347.71 with R1 at 348.68 and S1 at 347.12. Interpretation: the immediate decision zone sits 347.7–348.7.
Headlines and Sentiment Drivers
Notably, recent headlines complicate sentiment. Ferrari unveiled the fully electric Luce, and early retail reaction appeared cautious. Interpretation: headlines can inject event risk near resistance. At the same time, an active buyback program and a recent quarterly beat that lifted shares earlier in the month remain supportive. Interpretation: corporate flows and execution strength offer a downside buffer.
Scenarios and Key Triggers for Ferrari Stock
Primary view: neutral with a bullish tilt on the daily chart. A sustained push above the daily pivot at 349.42 and the hourly R1 at 348.68 would keep buyers engaged. Interpretation: clearing these thresholds should open a run toward the daily upper Bollinger at 352.98 and the 1H upper band near 355.25. Follow‑through would be reinforced if the daily RSI holds above 55 and the 1H MACD histogram turns positive again. Interpretation: momentum confirmation would validate upside continuation.
Bear case: failure in the 348.7–352.1 zone and a close back below 345.55 would hand the tape to sellers. Interpretation: loss of first support would target the daily Bollinger mid at 336.66 or the 50-day EMA at 342.97 on deeper weakness. The bearish scenario gains traction if the daily RSI slips toward 50 and the MACD histogram rolls negative. Interpretation: fading momentum would undermine the constructive bias. Invalidation for bears would be a firm daily close above 352.10 and sustained trade near the 352.98 band. Interpretation: that would indicate resistance has turned into support.
Positioning and Risk Framework
Overall, positioning remains tactical. Therefore, traders face a constructive bias supported by the 1H trend, yet the 200-day overhead keeps upside measured. Meanwhile, volatility is moderate, so pivots and Bollinger references should frame risk. On the other hand, EV‑related headlines can swing sentiment quickly, so respect levels and momentum confirmation.






 English (US) ·