
The post FLARE Challenges $0.021 Amid V-Shaped Recovery, Targets $0.052 appeared first on Coinpedia Fintech News
FLARE has reached a market price of $0.020 with a market cap exceeding a billion dollars. As the FLR price surpasses the critical psychological barrier, the bull run will likely create a new 50-day high. Let’s look at the FLR price analysis to find the next buying opportunity.
Flare Price Analysis
In the daily chart, the FLR price action has surpassed the 200-day EMA and is challenging the $0.021 resistance level. The annual price action of the FLR token shows a bullish breakout of a long-coming resistance trendline.
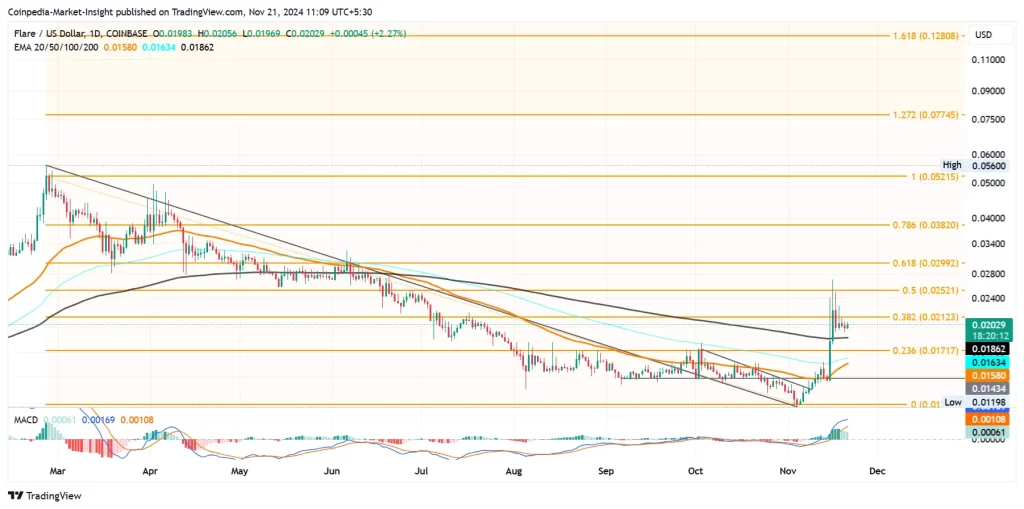
However, the trendline breakout rally took a long detest, resulting in a falling channel pattern. Nevertheless, with the broader market recovery, the FLR price took a massive V-shaped reversal from the $0.011 mark.
The recovery run surpassed the 50-day 100-day and 200-day EMA. It is now trading at the psychological level of $0.020. This accounts for a massive rally of nearly 70%. Furthermore, the bullish rally also challenged the 38.20% Fibonacci level at $0.021.
Currently, Flare faces higher price rejection from this resistance level, keeping the bullish growth under check. However, the intraday gain of 2.32% creates a new bullish engulfing candle, aiming to break above the resistance level.
Technical Indicators:
MACD: Supporting the bullish trend possibility, the MACD and signal line maintain a positive alignment but one of a negative crossover if the consolidation is prolonged.
EMA: The uptick in the 50-day EMA prepares for a crossover with the 100-day EMA. The bullish crossover will increase the overall sentiment and the chances of a golden crossover.
Will Flare Price Cross $0.30?
The breakout rally is likely to challenge the 50% Fibonacci level at $0.025. This level has also been known to provide a massive surge in supply, as reflected by the long-awaited candles last week.
The bullish breakout of the $0.021 will challenge the $0.025. This will be the critical crossroads for the FLR token. The FLR price is likely to surge to $0.052 to create a new 52-week high above $0.056.
Conversely, a downfall below the 200-day EMA at $0.018 will result in a plunge to $0.01717, or the 23.60% Fibonacci level.
With the increasing bullish momentum, will Flare reach the $0.10 mark in 2024? Find out NOW in Coinpedia’s Flare price prediction, and subscribe to us for the latest crypto updates.
FAQs
FLARE (FLR) is trading at $0.020, up 70% in its recovery rally, with bullish momentum challenging the $0.021 resistance.
A V-shaped recovery, positive MACD alignment, and potential EMA bullish crossovers signal a continuation of the uptrend.
Resistance lies at $0.021 and $0.025, while support stands at $0.018 and $0.01717 based on Fibonacci retracement levels.

 3 months ago
33








 English (US) ·