
 4 hours ago
11
4 hours ago
11

Gap stock is showing a classic short-term recovery inside a longer-term downtrend. GPS closed the daily session at $21.15, up from an open of $20.59, after tagging a high of $21.50. Momentum has turned constructive, yet the stock remains well below its 200-day average.
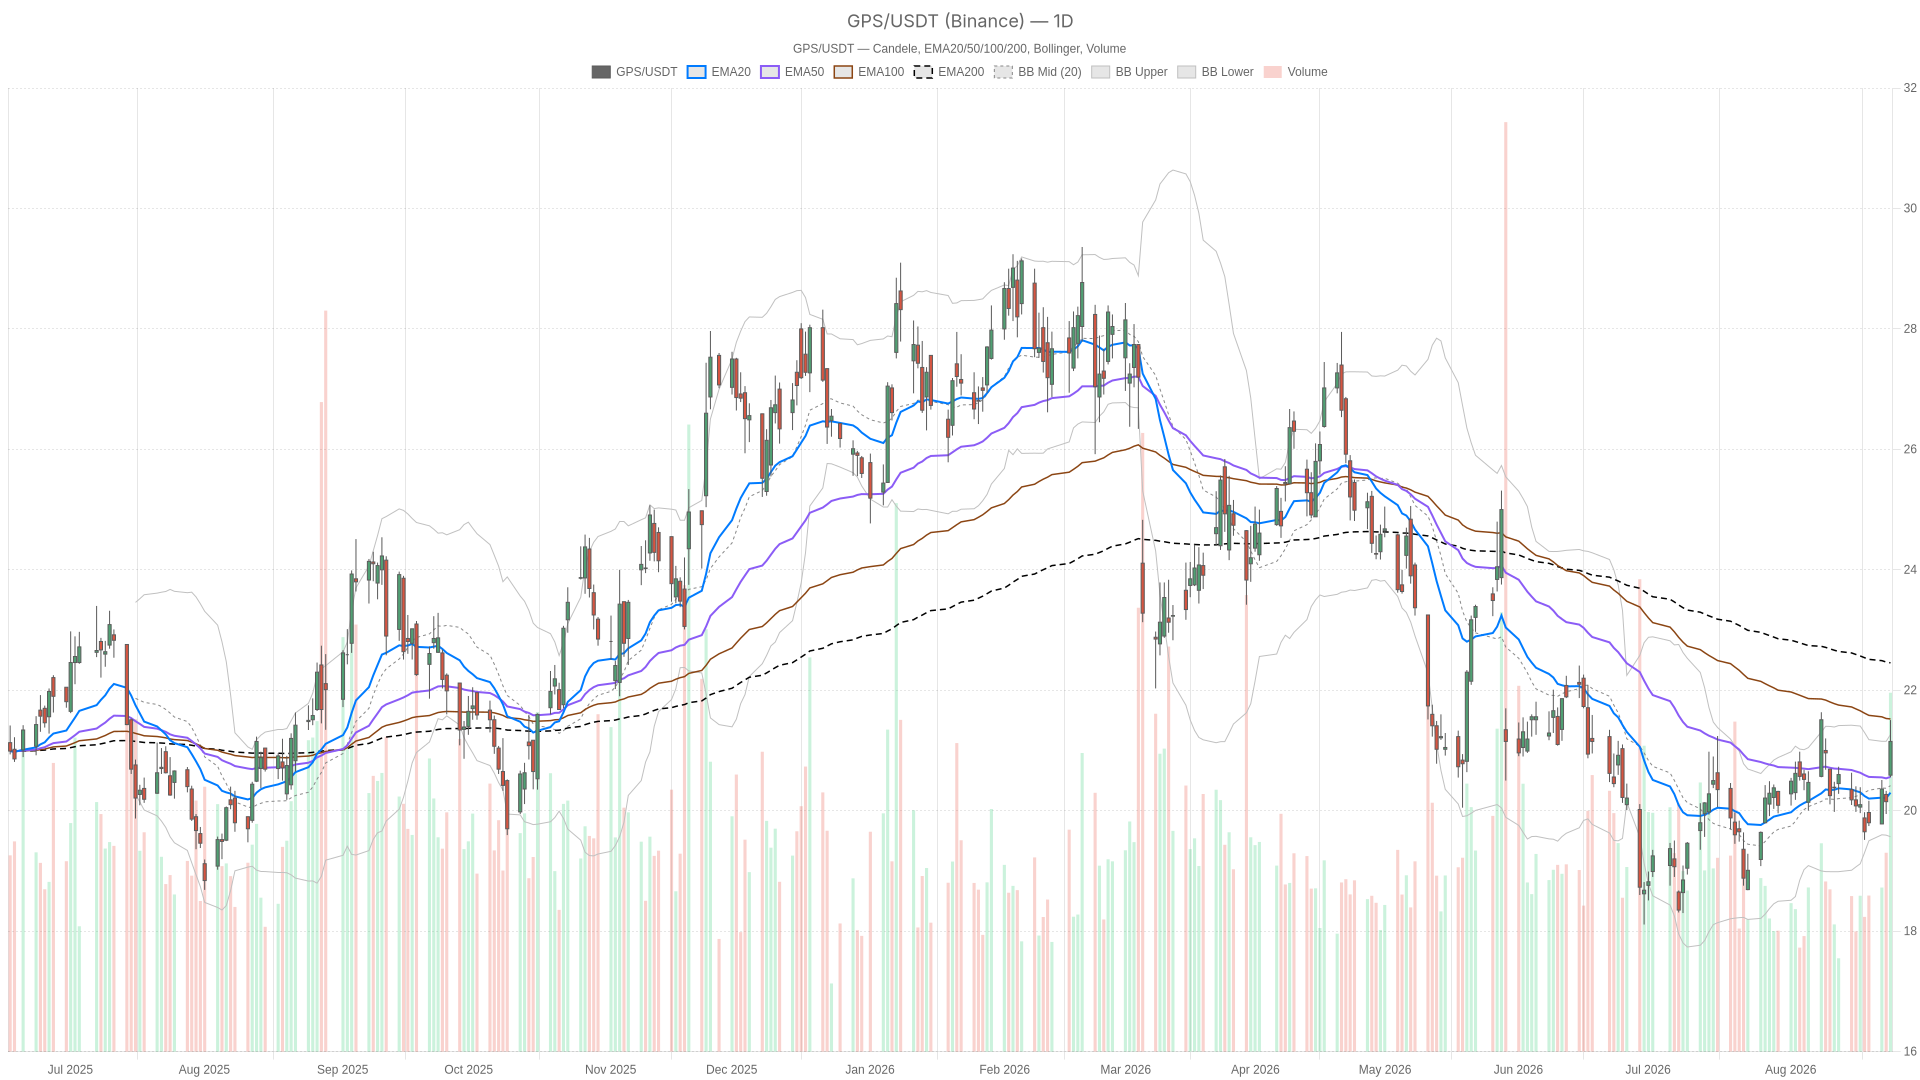 GPS — daily chart with candlesticks, EMA20/EMA50 and volume.
Key takeaways
- GPS closed at $21.15, up from a $20.59 open and a $21.50 intraday high.
- Daily RSI14 reads 58.86, with MACD positive at 0.04 above its signal line.
- Price trades above the 20-day EMA ($20.30) and 50-day EMA ($20.56), but below the 200-day EMA ($22.46).
- The bullish case requires a decisive break above R1 at $21.58.
- Losing the daily pivot at $21.07 and the 50-day EMA at $20.56 would reactivate the bearish scenario.
Gap Stock Daily Structure: Bullish Momentum, But Still Under the 200 EMA
Gap stock is building short-term bullish momentum on the daily chart, but it remains below the 200-day EMA. Price now trades above both the 20-day EMA ($20.30) and the 50-day EMA ($20.56). That alignment shows short-term buyers have taken control of the tape. Meanwhile, the 200-day EMA sits far above at $22.46. In other words, this is a recovery move inside a bigger downtrend, not yet a full trend reversal.
RSI14 on the daily timeframe reads 58.86, comfortably in bullish territory without being stretched. Momentum is building, but there is still room before overbought conditions become a concern. The MACD line at 0.04 sits above its signal line at 0.02, with a positive histogram of 0.03. That is a modest but genuine bullish signal, consistent with the recent grind higher.
Price is also pressing against the upper Bollinger Band. The mid-band sits at $20.42 and the upper band at $21.26. Closing near the top of that range typically reflects strong short-term demand. However, it also means volatility could compress or price could stall right where it is. Bands this tight often precede a decisive move rather than a smooth continuation.
The daily pivot structure reinforces the bullish tilt for now. GPS closed above the pivot point of $21.07, with resistance at R1 ($21.58) and support at S1 ($20.64). Daily ATR14 stands at 0.67. That gives a sense of how far price can realistically travel in a single session without breaking the current range.
1H Timeframe: Momentum Confirms, But Intraday Action Complicates the Picture
The hourly chart confirms the bullish daily bias, though intraday action shows hesitation near resistance. RSI14 on the 1H reads 61.52, slightly stronger than the daily reading. The MACD histogram at 0.13 is more pronounced than on the daily chart. Both point to active buying pressure building into the close.
At the same time, the intraday tape tells a slightly different story. GPS opened the hour at $21.36 and touched $21.39, only to close lower at $21.15. That fade from the highs, combined with a close below the hourly pivot of $21.21, suggests some hesitation near resistance. The hourly Bollinger upper band sits at $21.76. There is still technical room to run, but the pullback from session highs is worth noting.
Therefore, the 1H timeframe confirms the underlying momentum shown on the daily chart. It also flags near-term indecision right at the resistance zone. This is not a contradiction so much as a normal pause within an otherwise constructive setup.
15m Execution View: Short-Term Pullback Inside the Broader Move
The 15-minute chart points to a short-term pullback inside the broader move, rather than a trend change. RSI14 has cooled to 51.69, essentially neutral. The MACD histogram has turned slightly negative at -0.05. The MACD line at 0.17 sits just below its signal line at 0.23.
Price is also trading near the lower Bollinger band ($21.07), below its own 20-period EMA of $21.22. None of this overturns the bullish daily or hourly picture on its own. Instead, it reflects a short-term breather after the recent push higher. That is common after a stock tests resistance intraday. The 15-minute pivot at $21.19 and support at $21.05 frame the range traders are likely watching for the next directional cue.
Bullish Scenario for GPS
The bullish case for gap stock depends on a decisive break above daily resistance at $21.58. A close above that level would strengthen the case for further upside. Continued positive MACD readings on both the daily and hourly charts would reinforce that view.
Holding above the 50-day EMA ($20.56) and the daily pivot ($21.07) would keep the short-term structure intact. From there, the next real test becomes the 200-day EMA near $22.46. That level has capped the stock over the longer term and would need a sustained breakout to be considered meaningful.
Bearish Scenario and What Would Invalidate the Bullish Case
On the other hand, the bearish scenario would activate if GPS loses the daily pivot at $21.07. A slip back below the 50-day EMA at $20.56 would confirm the shift. That kind of breakdown would open the door toward S1 at $20.64. In a deeper pullback, the lower daily Bollinger band at $19.57 becomes the next reference.
Notably, a negative MACD crossover on the daily chart would be an early warning that the recovery attempt is losing steam. This would mirror what already appears on the 15-minute timeframe. Given that the stock remains below its 200-day EMA, any failure at current resistance levels would simply reaffirm the dominant longer-term downtrend.
Closing Take
Overall, GPS is caught between a genuine short-term bullish push and a longer-term trend that has not yet been repaired. Daily and hourly momentum indicators align in favor of buyers. The 15-minute chart shows a natural pause right at resistance. Volatility, as measured by ATR across timeframes, remains moderate rather than extreme.
That suggests the next move may take some time to develop rather than erupt immediately. Positioning around this gap stock setup should account for that uncertainty. The stock is testing a meaningful resistance zone with a major daily EMA still looming well above current price.
FAQ
What is the key resistance level for GPS?
The first key resistance is R1 at $21.58. A decisive close above that level would strengthen the bullish case, with the next major test at the 200-day EMA near $22.46.
Is gap stock in an uptrend or a downtrend?
GPS trades above the 20-day EMA ($20.30) and the 50-day EMA ($20.56), which supports a short-term recovery. However, it remains below the 200-day EMA ($22.46), so the longer-term trend is still down.
What would invalidate the bullish scenario?
A loss of the daily pivot at $21.07 and a move back below the 50-day EMA at $20.56 would shift the bias bearish. That could open the door toward S1 at $20.64 and the lower daily Bollinger band at $19.57.
How strong is current momentum?
Daily RSI14 reads 58.86 and hourly RSI14 reads 61.52, both in bullish territory without being overbought. MACD is positive on the daily and hourly charts, while the 15-minute chart shows a short-term pause.
Disclaimer: This article is for informational purposes only and does not constitute financial advice, an investment recommendation, or a solicitation to buy or sell any financial instrument or cryptocurrency. The analysis provided is not indicative of future results. Investing in crypto assets and financial markets carries a high risk of capital loss. Always do your own research (DYOR) and consult a qualified financial advisor before making any decision.
Article produced with the assistance of artificial intelligence and reviewed by the editorial team.








 English (US) ·