The post GRT Price Breaks $0.20: Will It Hit $0.3292 After Wedge Breakout? appeared first on Coinpedia Fintech News
With a falling wedge breakout setting a trend reversal rally, the GRT price trend reclaims the $0.20 psychological mark. As the broader market is on the verge of a next high momentum bullish phase, GRT price trend prepares for a moonshot rally.
However, with the ongoing recovery, the Graph coin price nears a crossroads. Will this retest result in a bounce-back rally crossing $0.30?
Graph (GRT) Price Analysis
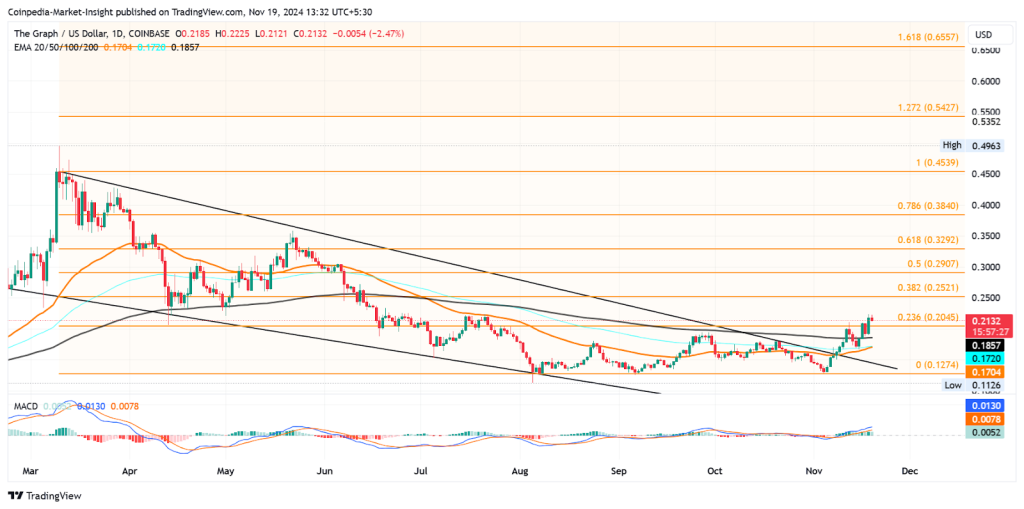
In the daily chart, the GRT price action shows a falling wedge breakout rally gaining momentum. The recovery rally started at $0.1274 and has now surpassed the $0.20 mark. Currently, it is trading at $0.2106 with an intraday pullback of 3.48%.

However, the recovery rally surpassing the overhead resistance trendline has also crossed above the 200-day exponential moving average line. This marks a change of character in the GRT price trend.
Furthermore, the 23.60% Fibonacci level breakout sets a trend reversal tone in GRT price trend. Following the 13.74% jump last night creating a bullish engulfing candle, the GRT price action shows a retest phase of the 23.60% Fibonacci level.
The bull run is likely to continue with a post-retest reversal heading to challenge the immediate resistance of $0.2521. This price target is derived from the 38.20% Fibonacci level.
Technical Indicators:
EMA: Amid the recovery rally gaining momentum, the 50-day EMA will give a positive crossover with the 100-day EMA. This crossover increases the possibility of a golden crossover in the daily chart.
MACD indicator: The MACD and signal lines sustain a gradual bullish trend with gradual positive histograms.
Will The GRT Price Skyrocket to $0.30?
Using the Fibonacci retracement tool, the uptrend is likely to challenge the 50% or 61.80% Fibonacci level by the end of the month. These Fibonacci levels are situated at $0.290 and $0.3292. Conversely, a failed retest could result in a drop to $0.18 or the 200-day EMA or the $0.17 near the 50-day EMA.
Will the bullish trend in Graph result in a price jump to $1? Find out the revised bull run price targets in Coinpedia’s latest GRT price prediction for 2024-2030.
FAQs
The Graph (GRT) is currently trading at $0.2106, with a 3.48% intraday pullback after surpassing the $0.20 mark.
The next immediate resistance is at $0.2521 (38.20% Fibonacci level), with higher targets at $0.290 (50% Fibonacci level) and $0.3292 (61.80% Fibonacci level).
The 50-day EMA is about to cross above the 100-day EMA, signaling a potential golden crossover, supported by a sustained bullish MACD trend.

 3 months ago
35


 English (US) ·