
 7 months ago
61
7 months ago
61
Hedera (HBAR) has dropped nearly 20% in the past seven days, but in the last 24 hours, it has rebounded by almost 5%, signaling a potential trend shift. While the broader trend remains bearish, key indicators suggest that buying pressure is increasing, and a reversal could be forming.
If HBAR breaks resistance at $0.219, it could climb toward $0.258 and even $0.287, but failure to sustain upward momentum could see it retesting $0.179 or lower.
HBAR DMI Shows Buyers Are Taking Control
The Average Directional Index (ADX) for HBAR is currently at 27.4, down from 31.4 yesterday, indicating that the downtrend strength is weakening.
ADX measures the strength of a trend on a scale from 0 to 100, with values above 25 typically signaling a strong trend, while anything below 20 suggests a weak or non-trending market.
Despite the decline, ADX remains above the key 25 threshold, meaning HBAR downtrend is still intact but losing momentum.
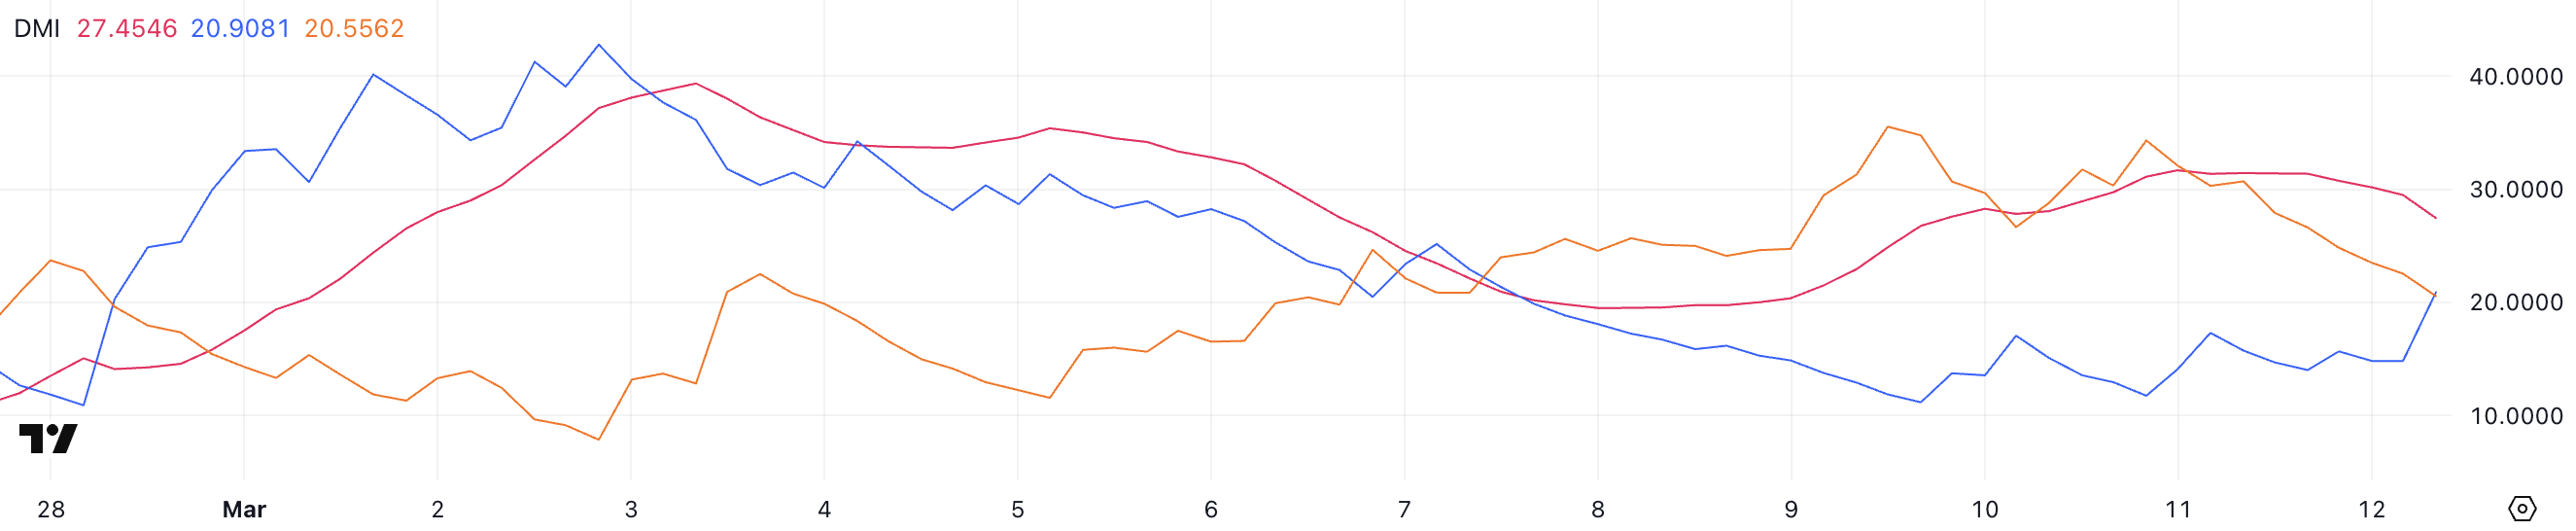 HBAR DMI. Source: TradingView.
Meanwhile, the +DI (Directional Indicator) has risen to 20.9 from 11.7, while the -DI has dropped from 30.3 to 20.5. This shift suggests that selling pressure is fading while buying pressure is increasing.
However, with ADX declining and both directional indicators still close to each other, Hedera has not confirmed a trend reversal yet.
The price remains in a downtrend, but if +DI continues rising above -DI, it could signal the beginning of a shift toward bullish momentum.
Hedera Ichimoku Cloud Suggests The Trend Could Shift Soon
The Ichimoku Cloud chart shows that Hedera price has recently moved above the blue Tenkan-Sen (conversion line), a short-term trend indicator.
This suggests that momentum is shifting, but the price remains below the Kijun-Sen (baseline) and inside the cloud’s resistance zone.
The cloud itself is red ahead, signaling that bearish pressure still dominates. Until the price clears this resistance, the trend remains uncertain.
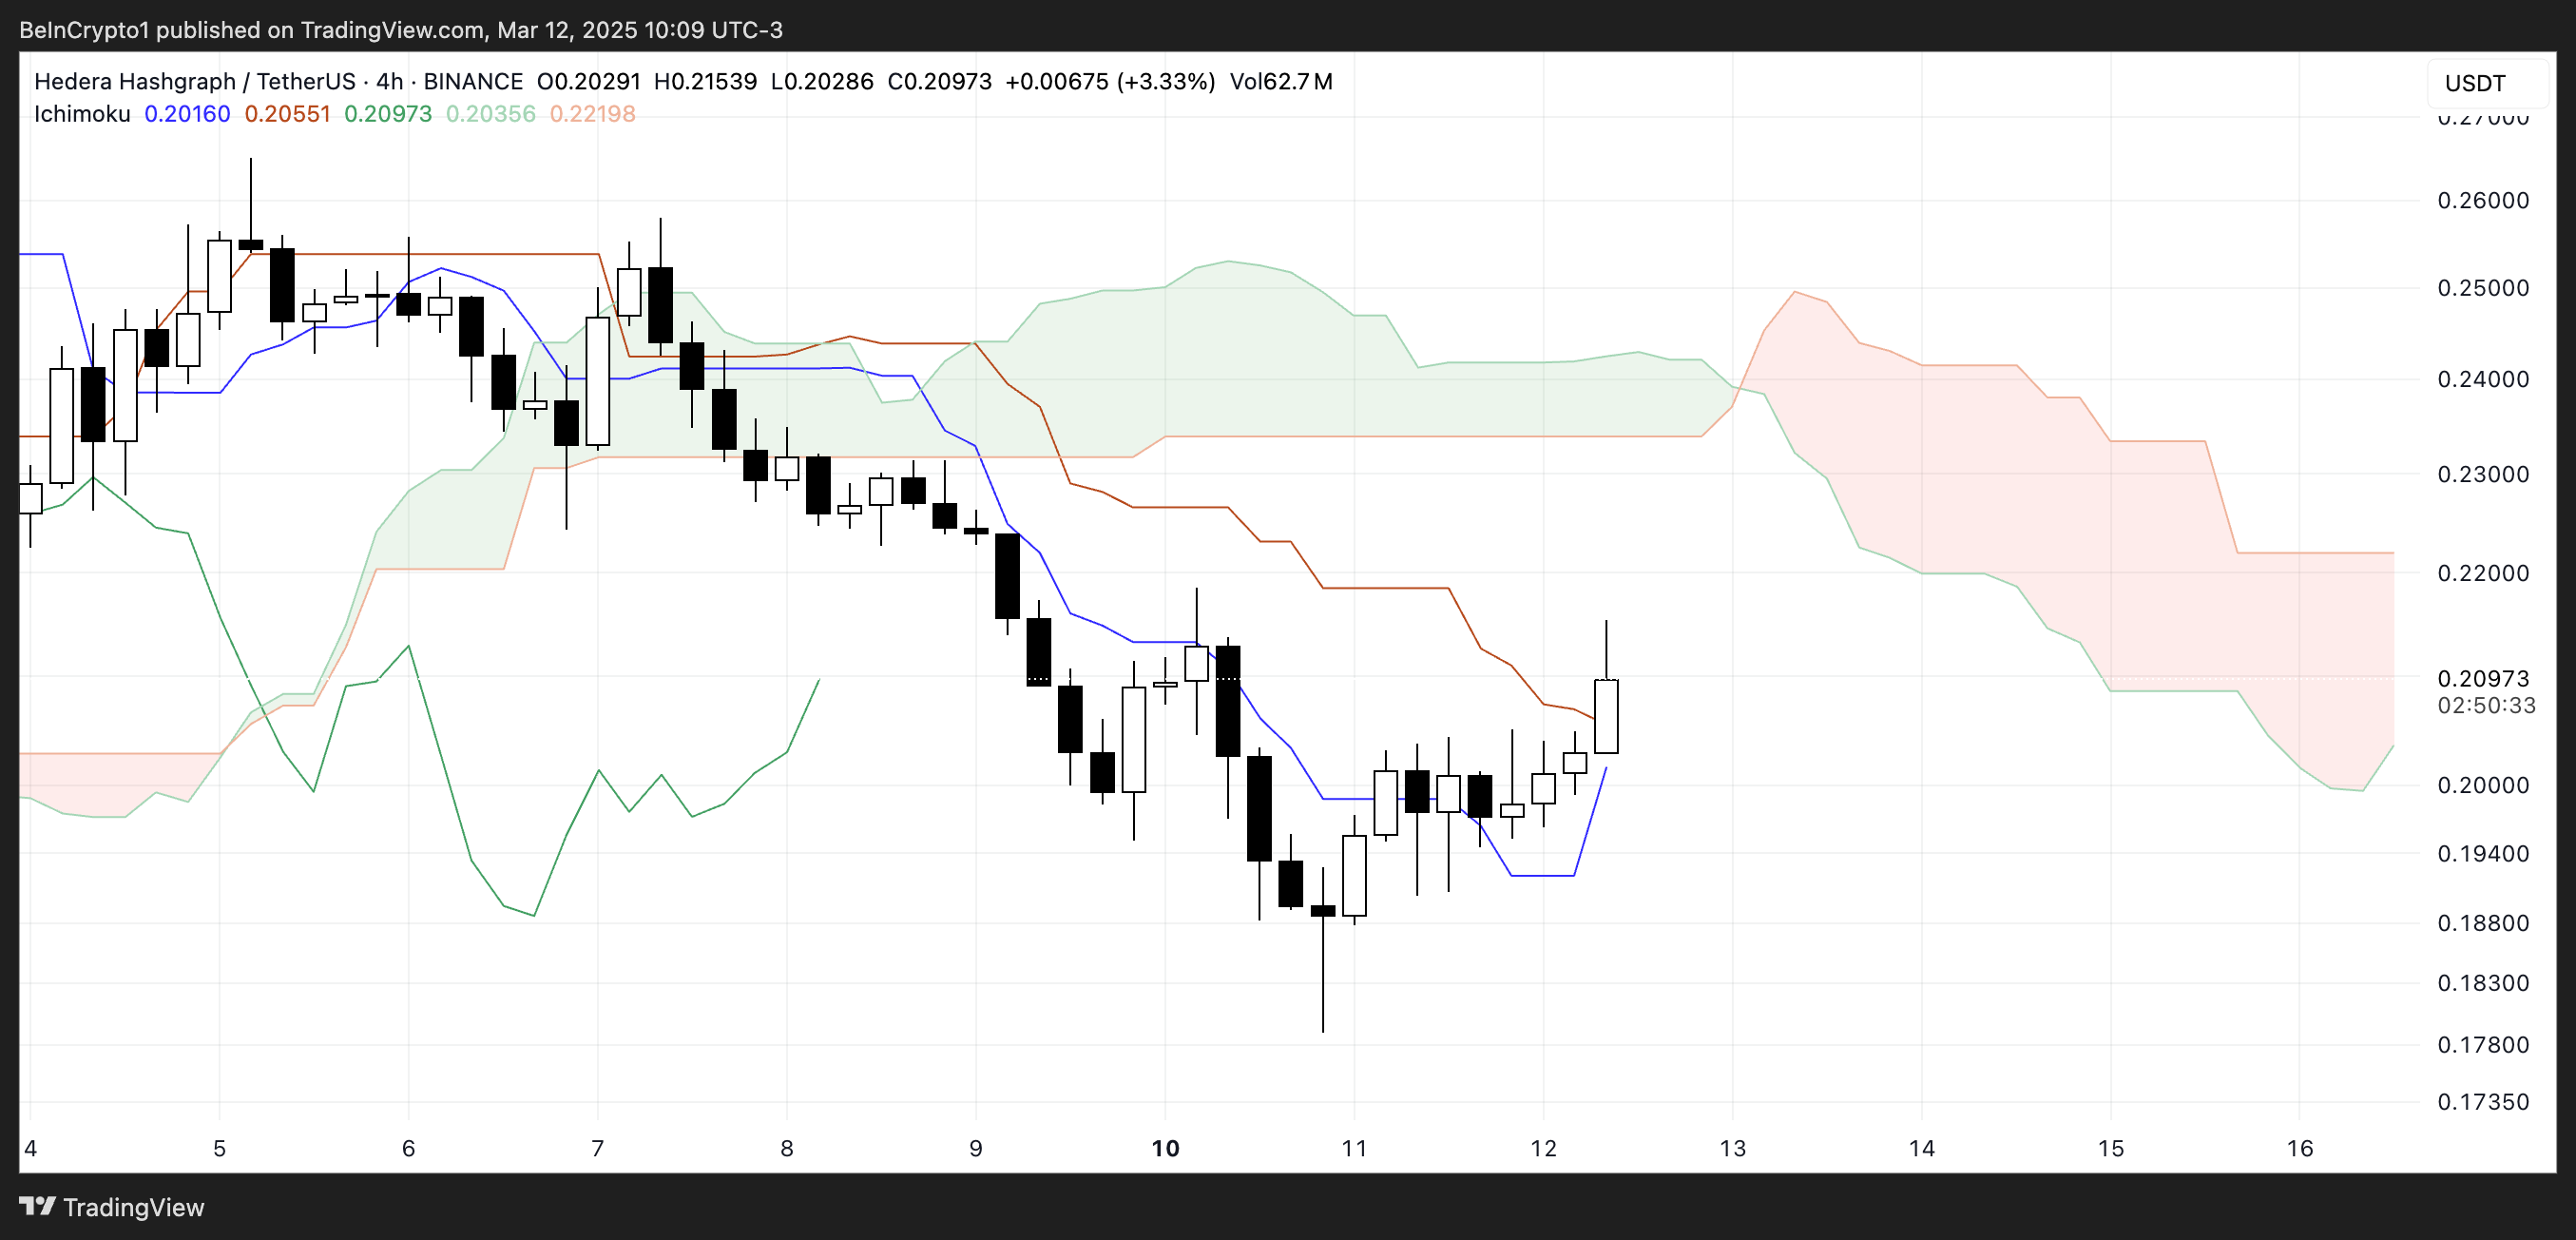 HBAR Ichimoku Cloud. Source: TradingView.
While the recent price action indicates a potential short-term reversal, the Kumo (cloud) remains bearish, suggesting that the overall trend is still downward.
HBAR would need to break above the cloud to confirm a trend shift more strongly. If the price faces rejection here, it could indicate continued weakness, leading to another downward move.
The battle between buyers and sellers at this level will determine whether HBAR can sustain this rebound or resume its broader downtrend.
Will Hedera Get Close To $0.30 Soon?
Hedera’s EMA lines indicate that the trend is still bearish, as short-term EMAs remain below long-term ones. However, the short-term EMAs are starting to turn upward, suggesting that a trend reversal could be forming.
If HBAR breaks the key resistance at $0.219, it could trigger a rally toward $0.258 and even $0.287, representing a potential 40% upside.
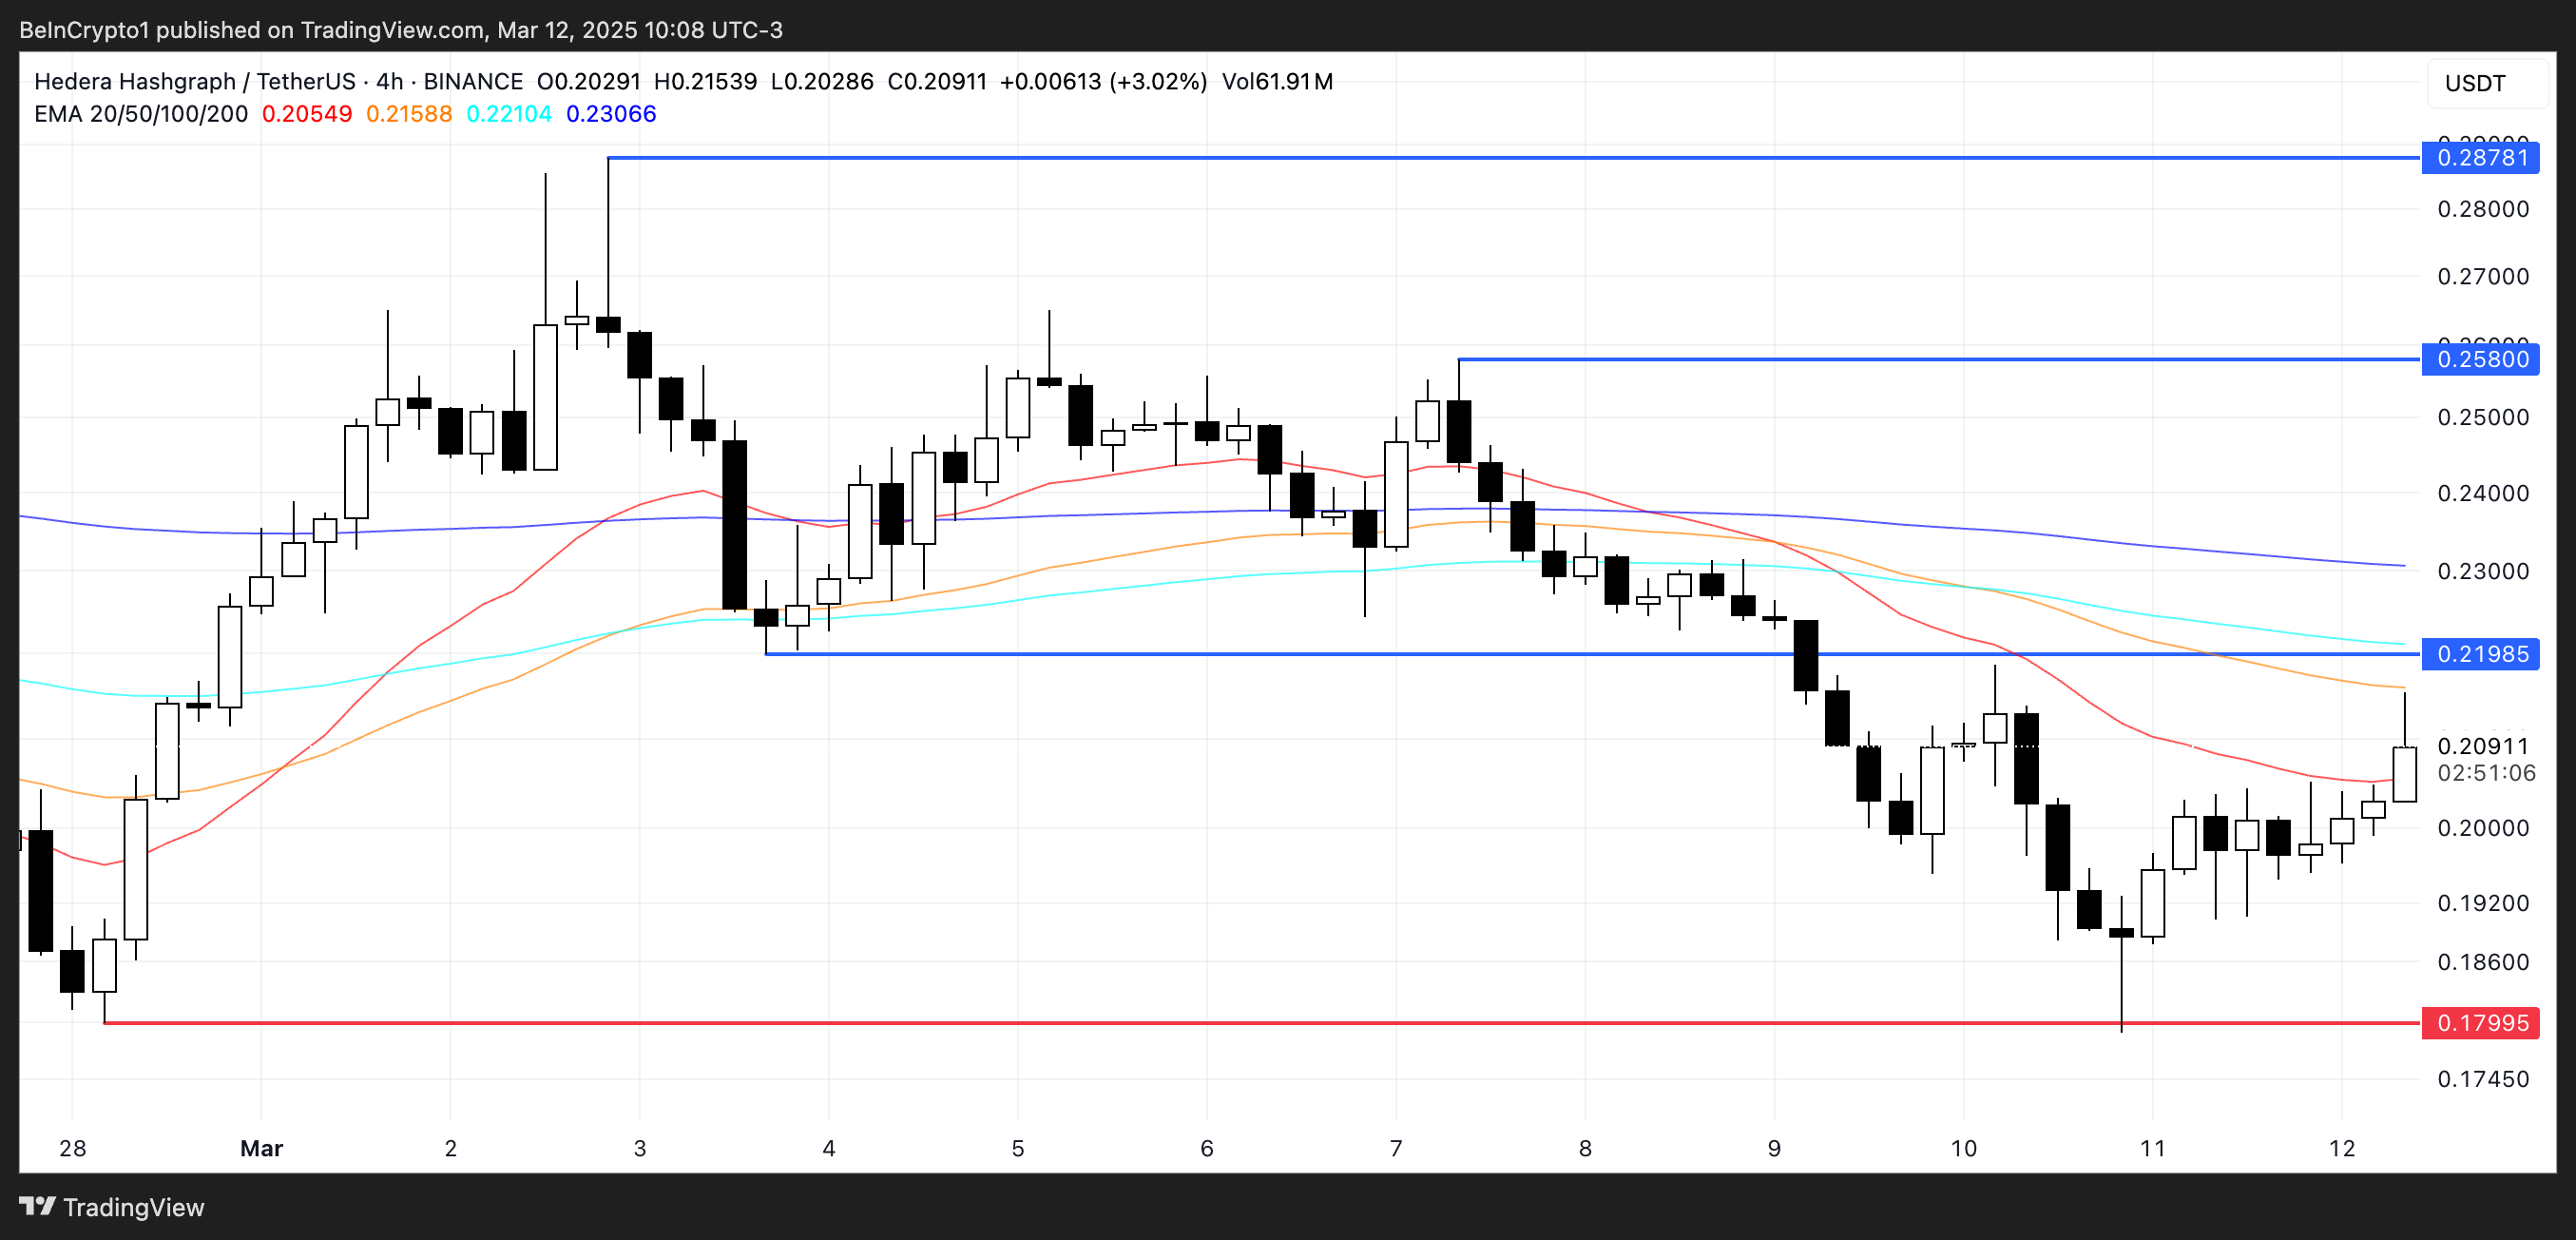 HBAR Price Analysis. Source: TradingView.
On the downside, if the trend fails to reverse, HBAR could continue its decline and test the $0.179 support level.
A break below that would open the door for a drop below $0.17, marking its lowest price since November 2024.
The post Hedera (HBAR) Could Be Ready For A Surge As Buyers Take Control appeared first on BeInCrypto.


 English (US) ·