The post Hedera (HBAR) Price Targets $0.10 Post 60% Surge appeared first on Coinpedia Fintech News
With the altcoin market facing a minor pullback, HBAR price trend continues to sustain the bullish breakout rally. Surpassing a long-coming resistance line, the altcoin is heading towards the $0.10 psychological mark.
Are you considering to buy Hedera before the breakout rally gains momentum? Let’s find out critical buying opportunities in our latest HBAR price action analysis.
Hedera Breakout Run Gains Momentum
In the weekly chart, the HBAR token shows a trendline breakout rally gaining momentum. The trendline breakout concludes the pullback phase started in early 2024, after creating a peak at $0.14.
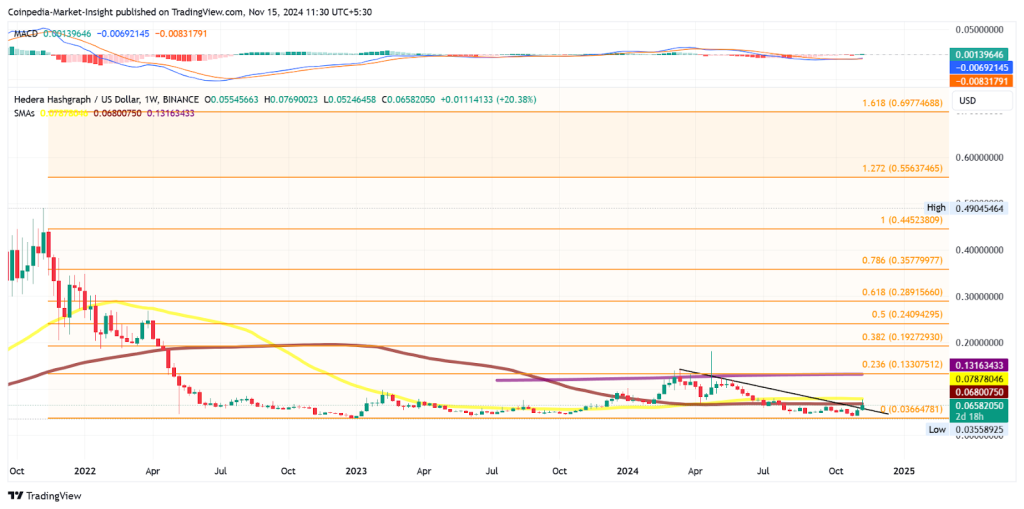
Currently, it is trading at $0.065 and is currently creating a second consecutive weekly bullish candle. As the bullring gains momentum, the HBAR price has increased by nearly 60% in the last 12 days.
In the weekly chart, the bullish reversal is currently challenging the 100-day simple moving average line, as it had faced higher price rejection from the 50-day SMA. A bullish breakout above the 50-day SMA line is likely to challenge the 23.60% Fibonacci level at $0.133.
As the bullish influence grows, the MACD and signal lines are giving a positive crossover, as furthermore the positive histograms are resurfacing, increasing the possibility of a bullrun.
Will HBAR Price Hit $0.10?
If the uptrend continues, a price surge above the 50-day SMA is likely to challenge the 200-day SMA line. On the flip side, a crucial support for the evolved coin remains at $0.050 psychological mark.
Curious to know on the HBAR price trend? Find out future price targets in our HBAR price prediction.
FAQs
Is it a good time to invest in HBAR?
Yes, with the recent bullish breakout rally and strong momentum, HBAR presents a potential buying opportunity. However, monitoring key support and resistance levels is crucial.
What are the key resistance levels for HBAR?
The immediate resistance lies at $0.10 (psychological mark), followed by $0.133 (23.60% Fibonacci retracement), and $0.14 (2024 peak).
What happens if HBAR drops below $0.050?
A fall below the $0.050 psychological support could signal bearish momentum, risking a pullback to lower levels.

 3 months ago
37







 English (US) ·