
 6 hours ago
14
6 hours ago
14
Hedera (HBAR) price rebounded over 10% in the last 24 hours, as some technical indicators are beginning to flash early signs of a potential recovery. The BBTrend has flipped positive after a full week in the red, hinting at a possible momentum shift.
Hedera BBTrend Is Positive After Seven Days
Hedera’s BBTrend indicator has turned positive, currently sitting at 3.96 after spending the past seven days in negative territory and hitting a low of -17.12 on April 1.
The BBTrend (Bollinger Band Trend) is a momentum-based indicator used to assess the strength and direction of a trend relative to its position within the Bollinger Bands.
Readings above 0 suggest bullish momentum and potential upside movement, while readings below 0 indicate bearish pressure and downward momentum.
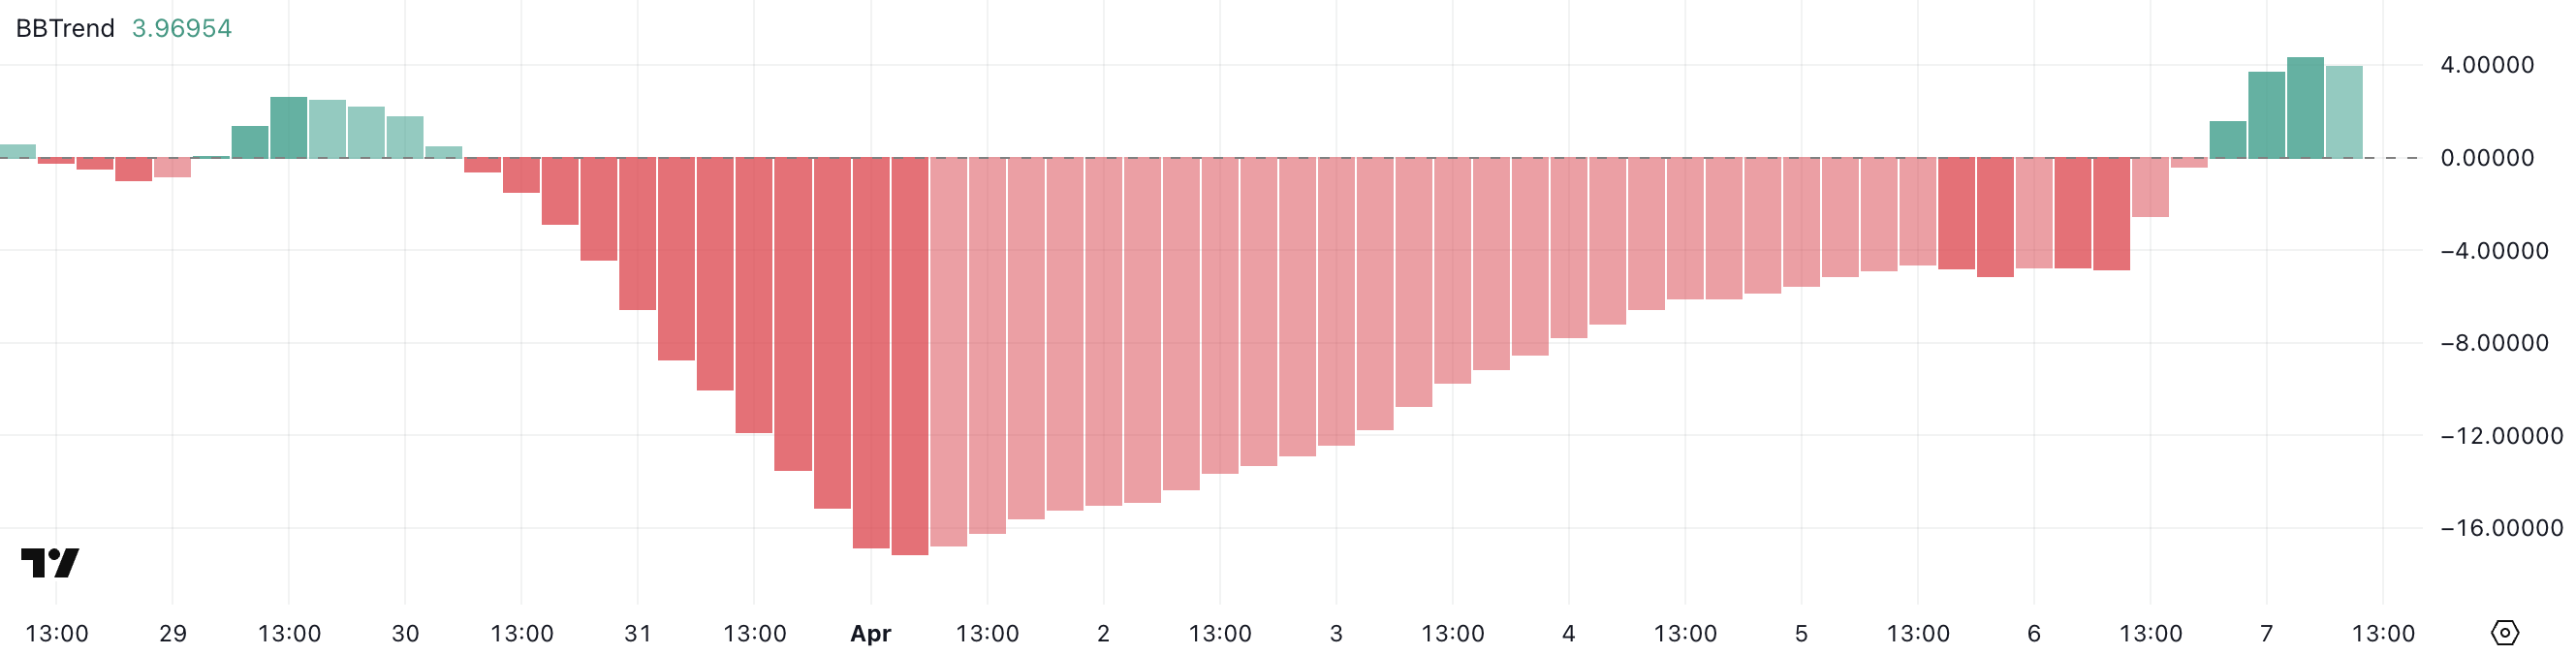 HBAR BBTrend. Source: TradingView.
The current BBTrend value of 3.96 suggests that Hedera is showing early signs of a potential bullish reversal following a prolonged downtrend. The shift into positive territory could mean that buying pressure is returning and, if sustained, may support a price recovery.
However, given the recent volatility and overall weakness in the broader market, HBAR will need consistent follow-through above its mid-range levels to confirm this upward shift.
A failure to maintain a positive BBTrend could result in the continuation of sideways or downward movement.
HBAR Ichimoku Cloud Paints A Bearish Picture
The Ichimoku Cloud chart for Hedera currently displays a bearish structure. The price is positioned well below the Kumo (cloud), indicating that downward momentum remains dominant.
The Tenkan-sen (blue line) and Kijun-sen (red line) are both sloping downward and acting as immediate resistance levels, suggesting that sellers still have control over the trend.
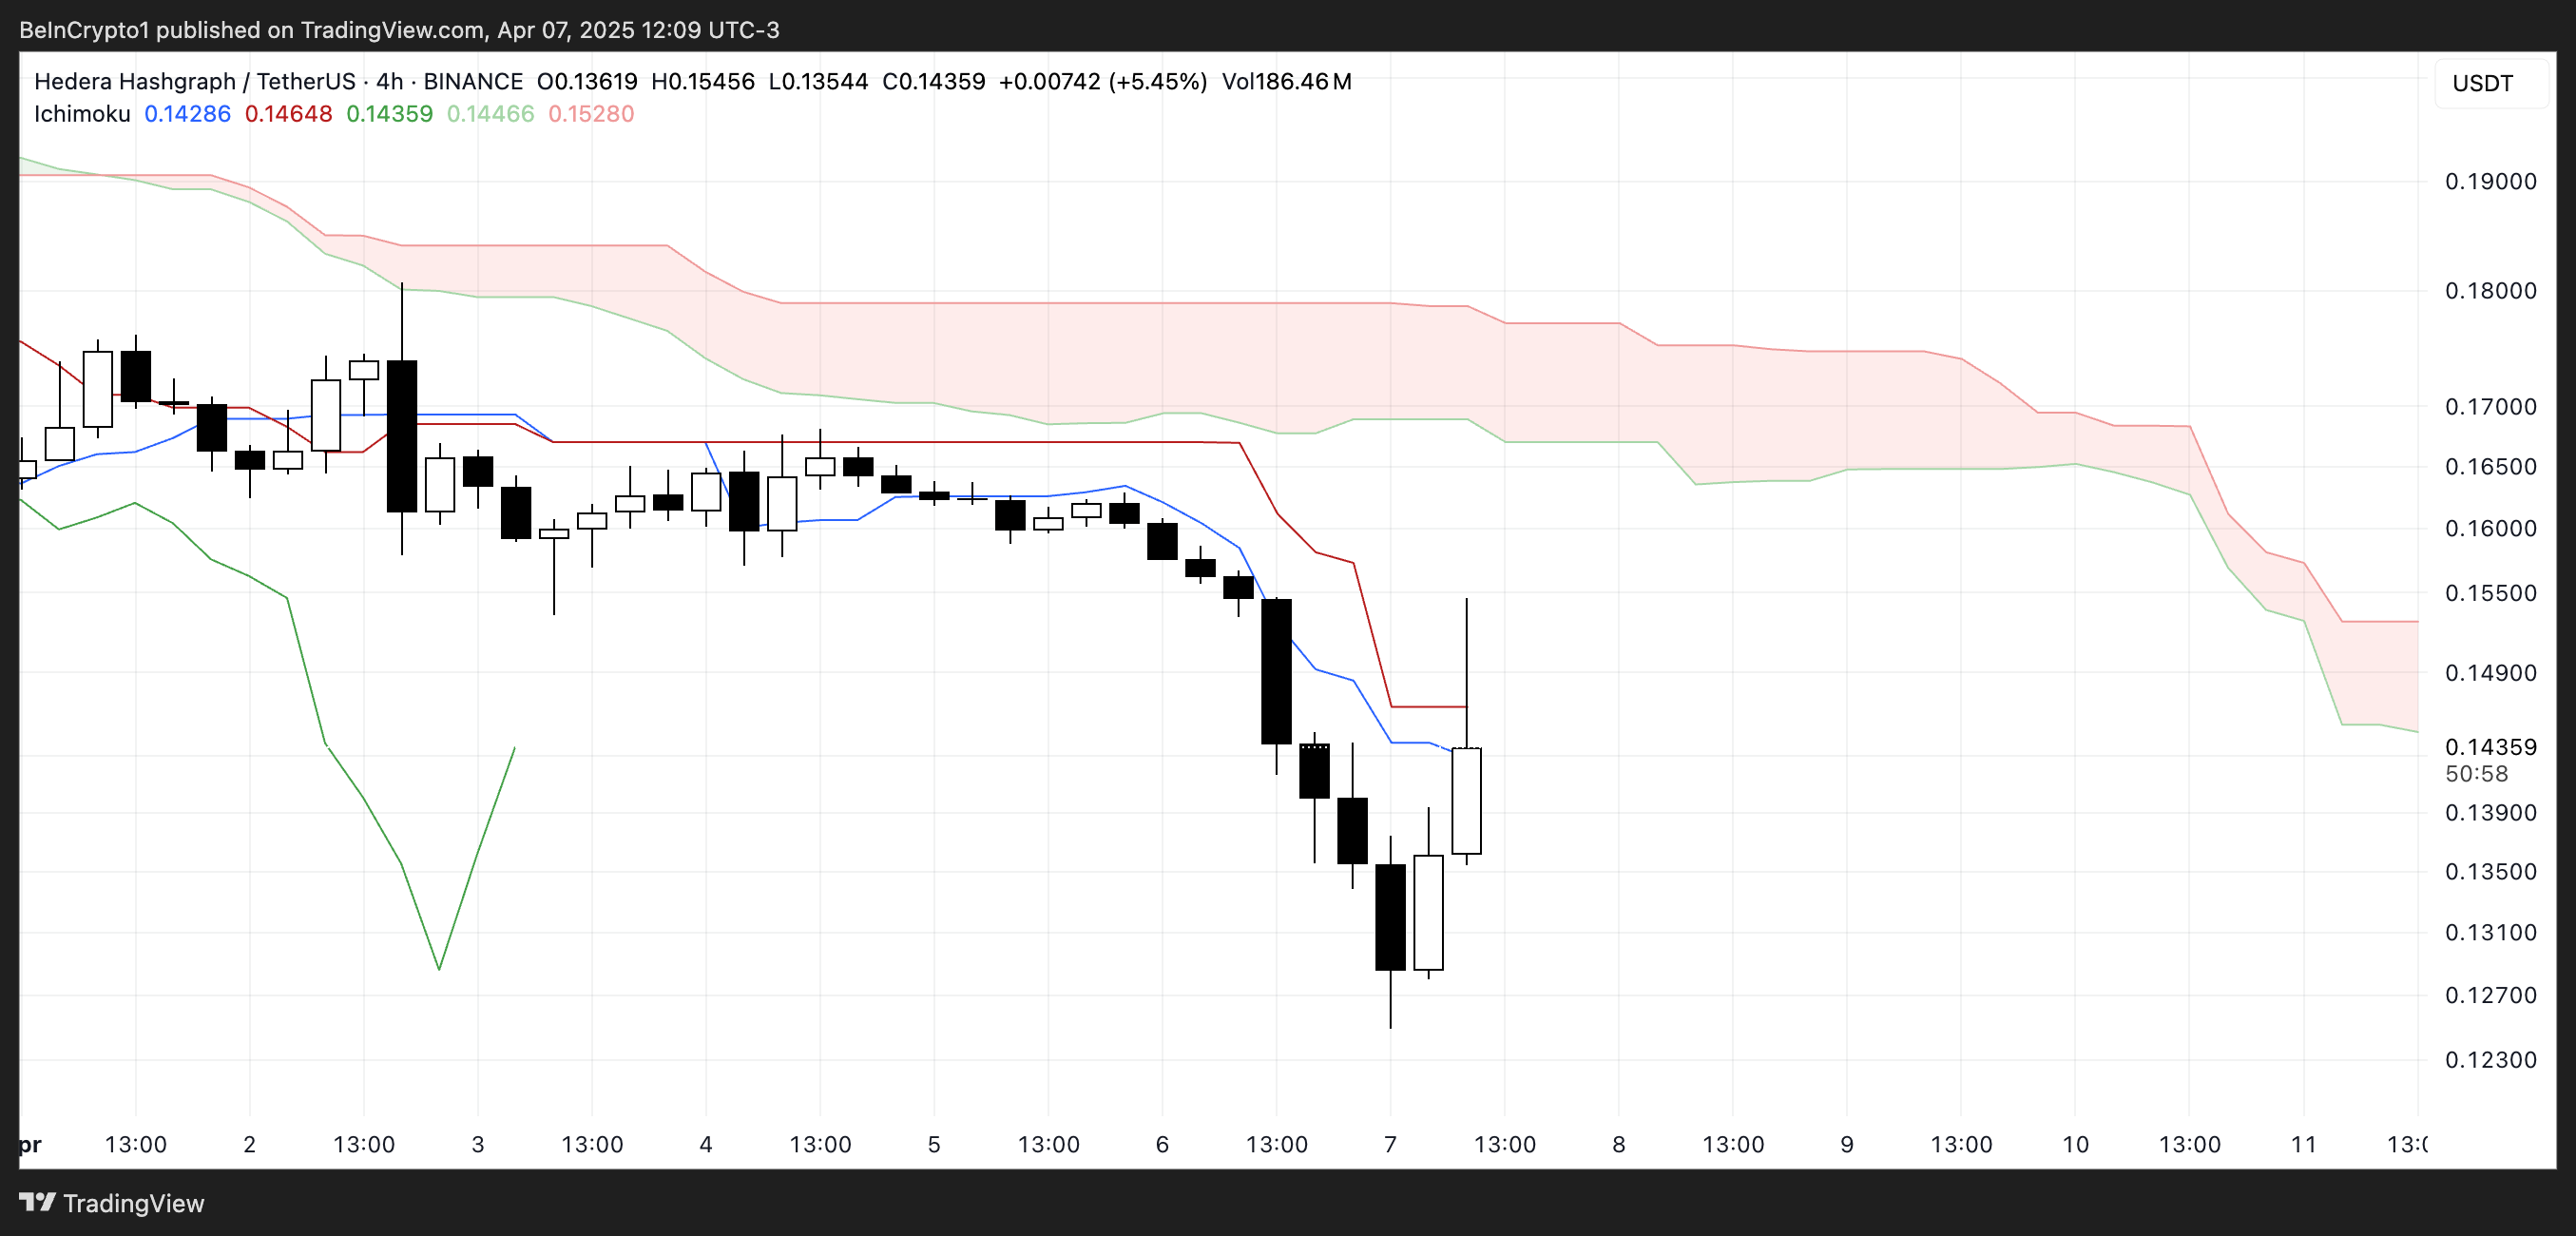 HBAR Ichimoku Cloud. Source: TradingView.
The cloud ahead is thick and red, reinforcing a bearish outlook and signaling that strong resistance lies above the current price action. However, a recent bullish candle pushing toward the Tenkan-sen suggests early signs of a possible relief rally.
For any meaningful trend reversal to occur, HBAR would need to break above both the Tenkan-sen and Kijun-sen, and eventually move into the cloud itself—a challenging task given the current setup.
Overall, the Ichimoku configuration confirms that while some short-term upside is possible, the broader trend remains firmly bearish for now.
Will Hedera Fall To 5-Month Lows?
Hedera’s EMA (Exponential Moving Average) lines continue to signal a bearish trend, with short-term averages positioned below the long-term ones—a classic indication of downward momentum.
As long as this alignment holds, HBAR remains vulnerable to further declines.
If selling pressure resumes, the token could fall to test support at $0.124. A breakdown below that level would mark the first move under $0.12 since November 2024.
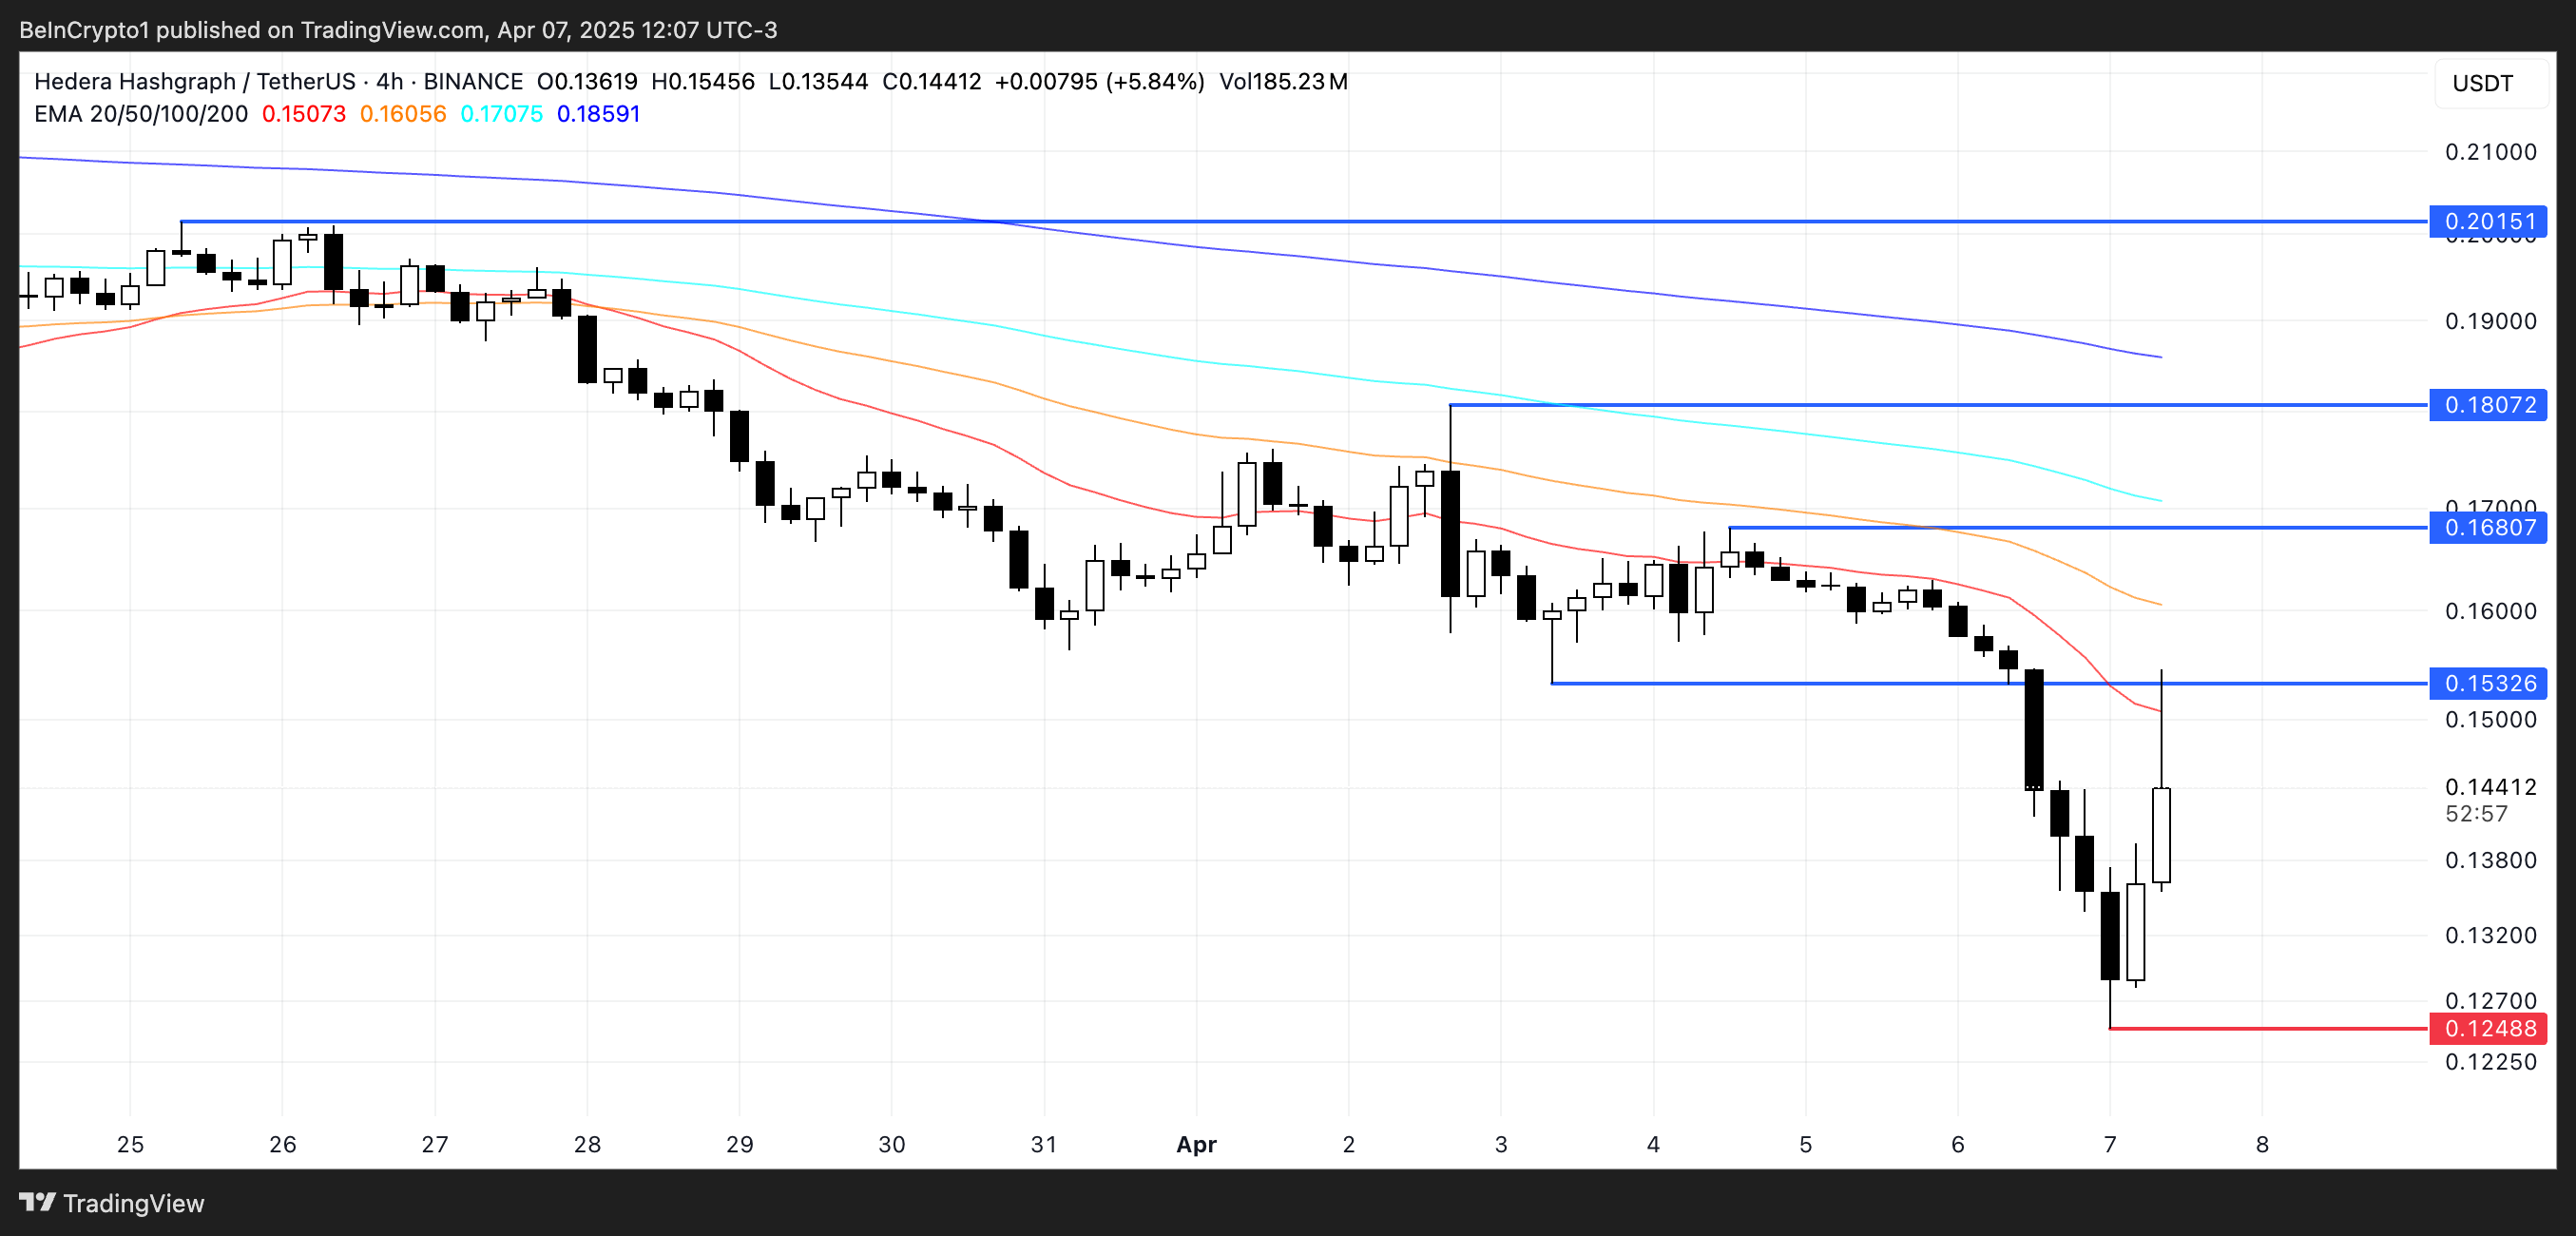 HBAR Price Analysis. Source: TradingView.
However, if Hedera price manages to reverse its current correction, a recovery could gain traction and push the price toward resistance at $0.155.
A breakout there could pave the way for further gains to $0.168, and if bullish momentum accelerates, HBAR could even attempt a move toward the $0.18 and $0.20 zones.
A crossover of the short-term EMAs above the long-term lines would be a key signal confirming a potential trend reversal.
The post Hedera (HBAR) Rebounds 10% But Bearish Outlook Remains Persistent appeared first on BeInCrypto.


 English (US) ·