
 6 months ago
96
6 months ago
96
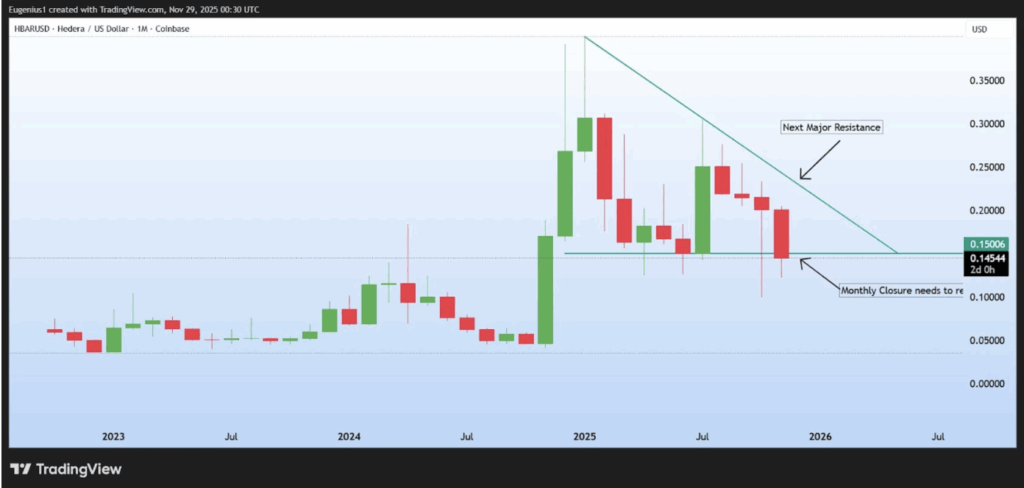
- HBAR trades around $0.145 as the monthly close near $0.15 becomes a key decision point.
- Support sits at $0.143–$0.126; resistance blocks form at $0.163, $0.187, and $0.190.
- Indicators show weakening momentum but still leave room for a rebound if buyers step in.
Hedera Hashgraph (HBAR) is hovering around $0.145, trying to catch its balance after several weeks of steady downward pressure. Analysts at Inca Trading warned that the upcoming monthly close could be the deciding moment — the kind that sets the tone for the next major trend.
According to them, a monthly close above $0.15 would strengthen the case for a longer-term bullish structure, with the next confirmation region sitting somewhere between $0.20 and $0.25. On the other hand, if HBAR fails and closes below $0.15, it may signal that the recovery from the 2024–2025 lows has already run out of steam — potentially shifting the chart back toward a more dominant bearish outlook.
Right now, HBAR is basically balancing on a razor’s edge. It’s sitting just above long-term support, and the market seems unsure whether buyers can keep control or if sellers are preparing to drive prices lower. The monthly close will reveal which side wins.
Technical indicators show weakening momentum — but not a full breakdown
On the weekly chart, HBAR has slipped below the 0.236 Fibonacci level at $0.150, which previously acted as a cushion during broader market dips. Losing that level signals fading bullish momentum and puts more attention on the next major support around $0.126 — a zone that has held strong for a long time.
Moving averages build the picture further.
- The 20-week EMA at $0.163 is now the first resistance.
- Above that sits a thicker resistance block formed by the 50-week EMA ($0.187) and 100-week EMA ($0.190).
For any meaningful bullish trend to return, HBAR has to break those layers — no shortcuts.
On the downside, the major long-term support is the 200-week EMA at $0.1435. A weekly close below that level would hand control firmly to sellers and could reshape the entire higher timeframe structure.
Momentum indicators tilt bearish — yet leave room for a rebound
Weekly RSI sits around 38 — not oversold, but definitely showing reduced buying strength. This gives sellers breathing room, though it also leaves the possibility of a short-lived recovery if RSI dips further and triggers oversold conditions.
MACD remains firmly bearish as well, with expanding red bars and the MACD line tucked below the signal line. So far, no meaningful reversal signals have appeared.
Key levels that will define HBAR’s next major move
The most important area for HBAR right now is the support zone between $0.143 and $0.126. Holding that range could stabilize price and give the market enough footing for a recovery attempt.
If buyers manage to push HBAR back above $0.163, the next upside targets become $0.187 and $0.190, where major EMAs cluster together. Clearing those levels would reopen the path toward the mid-range Fibonacci region and shift momentum back into bullish territory.
For now, Hedera sits in a delicate but decisive phase — and the monthly close will determine whether this is just another dip… or the start of a deeper trend shift.
The post Hedera Sits at a Critical Turning Point — Here Is Why the $0.15 Monthly Close Could Decide Everything first appeared on BlockNews.


 English (US) ·