
 1 month ago
47
1 month ago
47
Hive stock holds a structurally bullish daily chart, yet short-term momentum is fading. HIVE closed at $3.97 on June 17, retreating from an intraday high of $4.26. The broader trend stays intact, underpinned by a strategic pivot toward AI infrastructure.
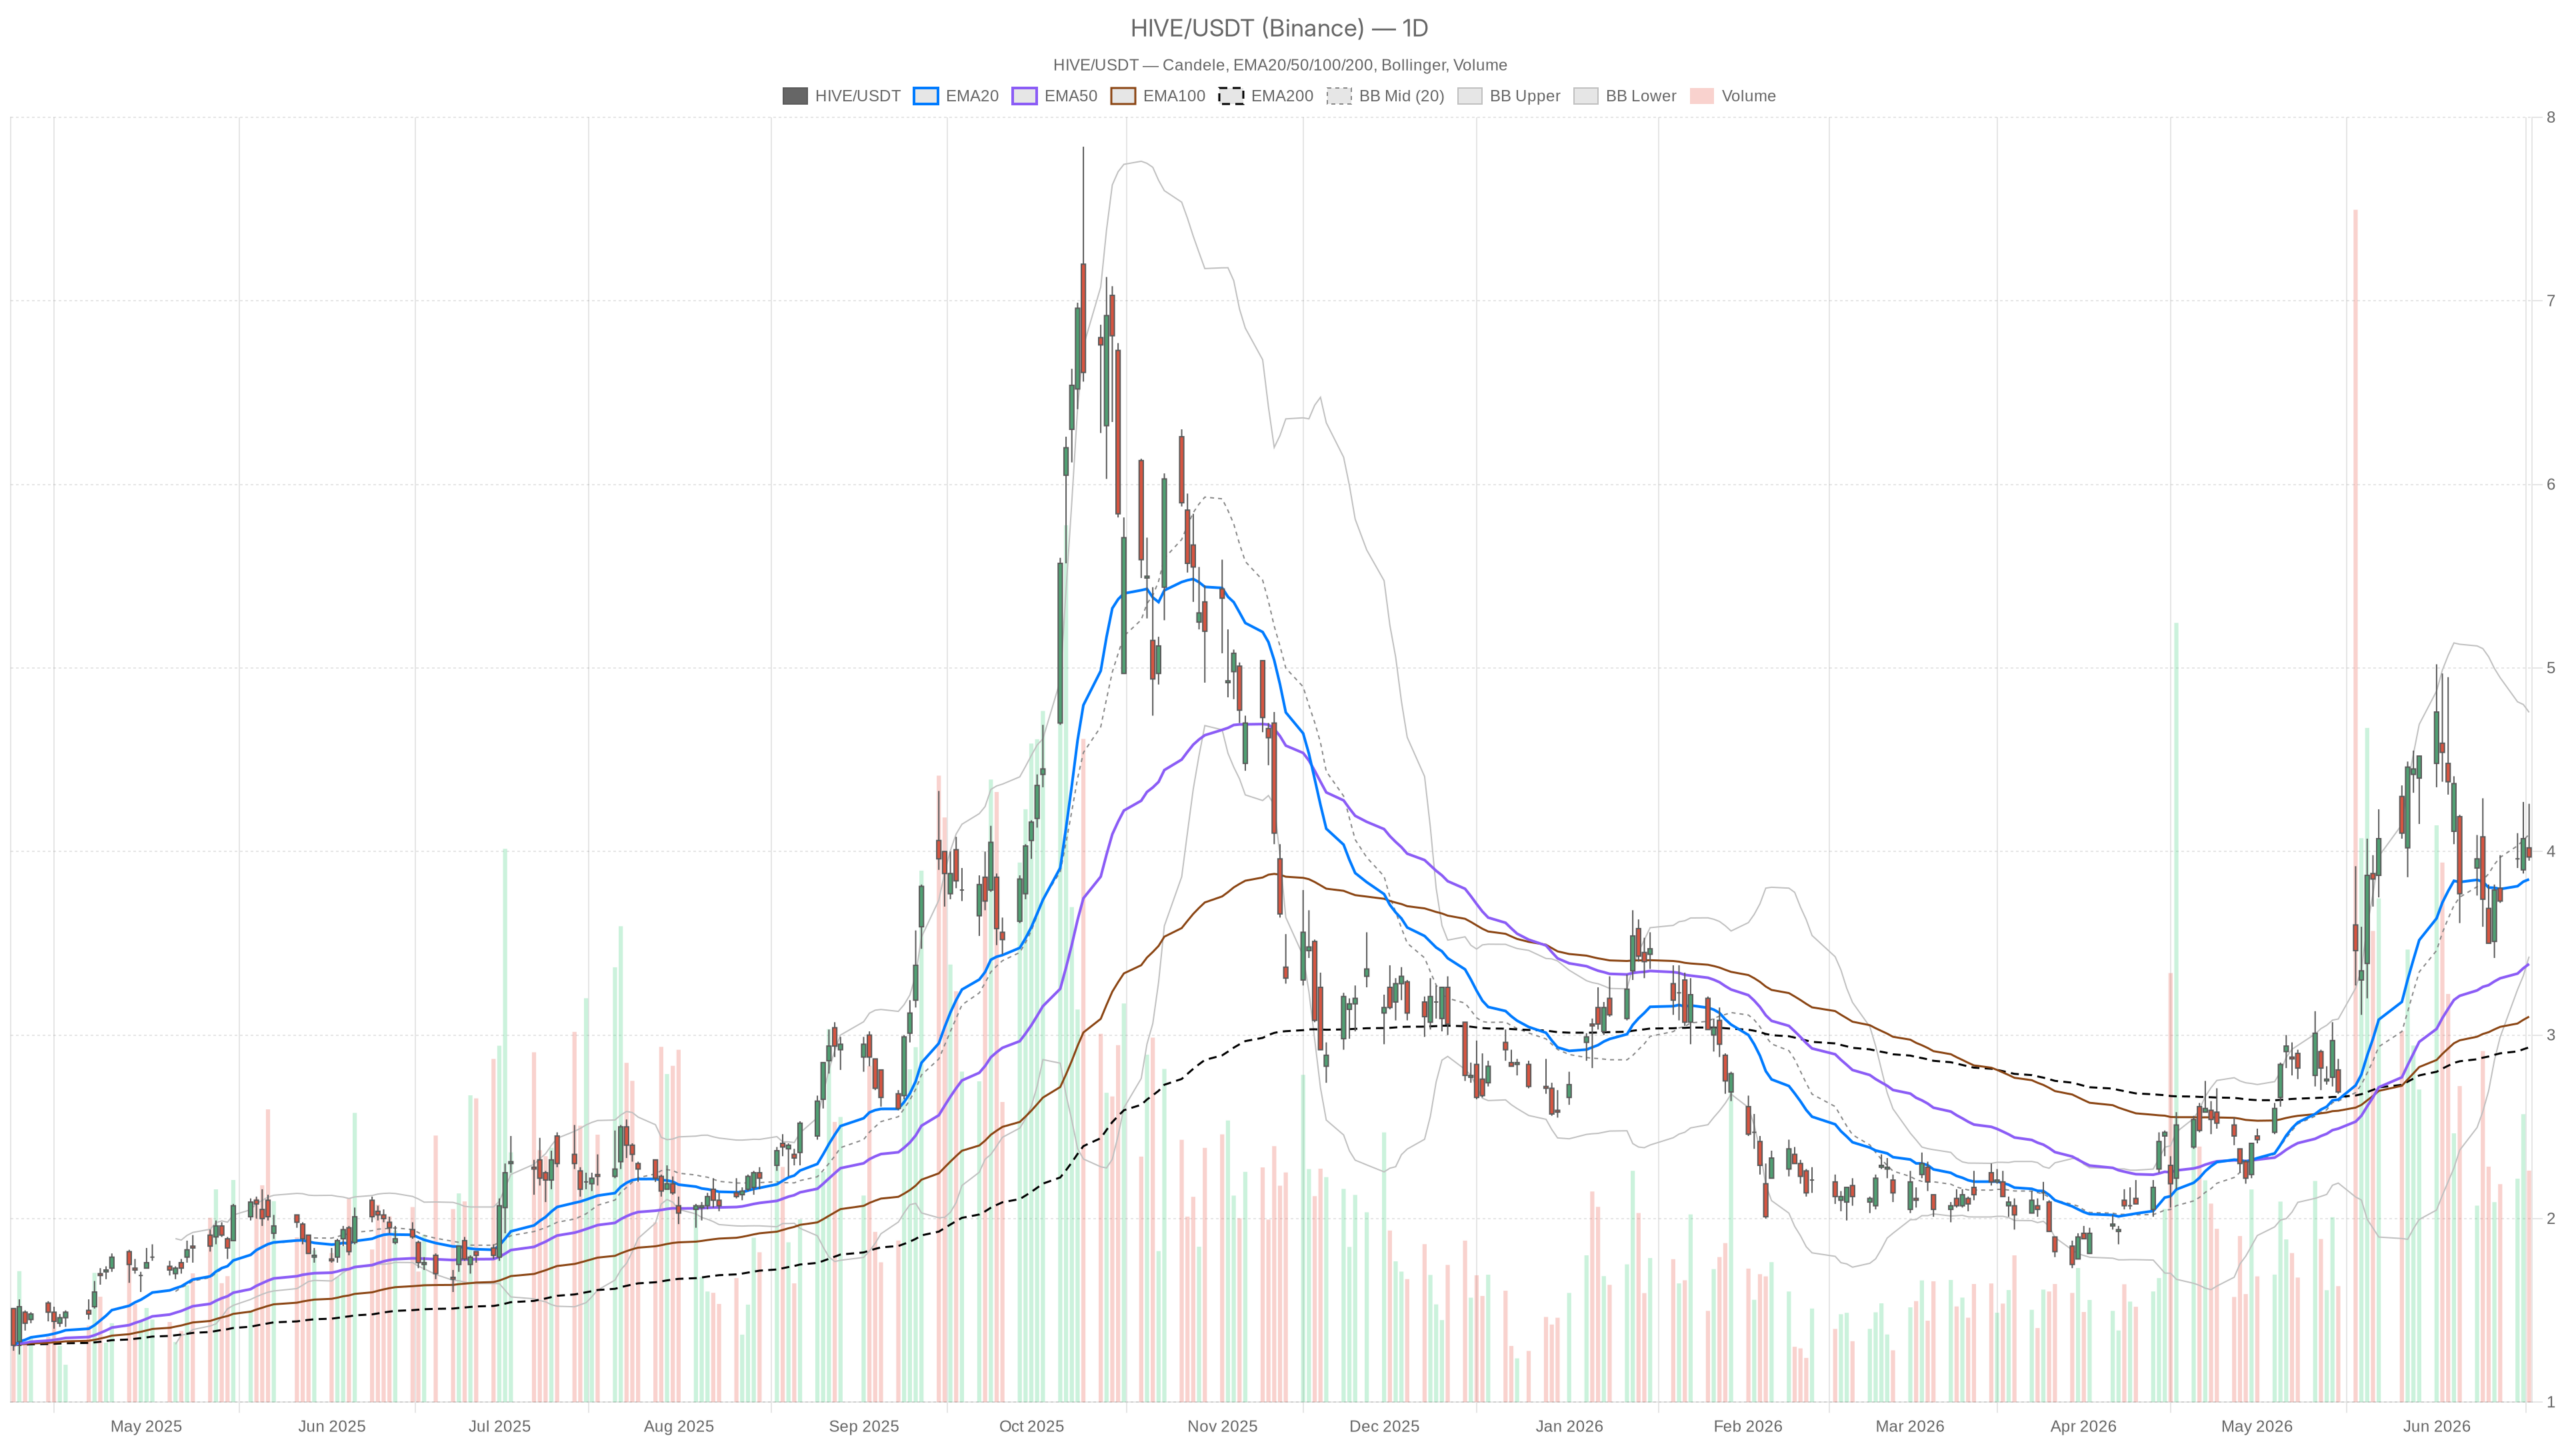 HIVE — daily chart with candlesticks, EMA20/EMA50 and volume.
Key takeaways
- HIVE stock’s daily EMA stack (20/50/200) remains in a textbook bullish ascending alignment.
- Daily RSI at 54.99 signals room for further upside without overbought exhaustion.
- The 1H chart has shifted to neutral, with price struggling below the $4.00 pivot.
- A breakdown below the daily S1 at $3.86 would seriously threaten the bullish structure.
- Fundamental catalysts include the Boden data center acquisition and a planned 320 MW AI gigafactory near Toronto.
Is Hive Stock’s Bullish Trend Still Intact?
Yes. Hive stock’s daily chart maintains a textbook bullish EMA alignment, with all three key moving averages stacked in ascending order. The configuration confirms a structurally sound uptrend.
Price closed at $3.97 on June 17, pulling back from an intraday high of $4.26. The rejection left a visible upper wick and a close just below the daily pivot at $4.06. Buyers are present, but conviction above $4.20 remains fragile.
The daily EMA stack tells a clear story. Price trades above the EMA20 at $3.85, the EMA50 at $3.39, and the EMA200 at $2.93. All three are aligned in ascending order. The distance between price and the EMA200 now exceeds a dollar. This reflects accumulated buying pressure over several weeks — not a shallow bounce.
Daily RSI at 54.99 sits in modestly bullish territory. It holds above the 50 neutral line without touching overbought levels. Room remains for further upside before exhaustion sets in.
However, the MACD picture warrants close attention. The MACD line at 0.19 stays above zero, confirming positive daily momentum. Yet the signal line at 0.27 sits above the MACD line. This produces a histogram reading of -0.08. That negative print means bullish momentum is decelerating. It is not a reversal signal, but it is a caution flag. Momentum is leaking out of the move.
Daily Bollinger Bands show the mid-band at $4.09. The upper band sits at $4.76 and the lower band at $3.43. Price is pressing close to the mid-band after retreating from the upper zone. The recent high near $4.26 was an attempt to break higher that stalled. A sustained close above $4.09 would reassert directional strength. The daily ATR of $0.46 reflects a stock with meaningful daily range. Traders need to size accordingly.
What Do the Short-Term Charts Reveal About Hive Stock?
Short-term momentum is fading noticeably. The 1H chart has shifted to neutral territory, while the 15-minute chart displays a clean bearish structure. Price needs time to digest its recent run before another push higher.
1-Hour Timeframe
The 1H close at $3.96 sits below the EMA20 at $4.07 and just barely above the EMA50 at $4.00. The 1H regime is classified as neutral. This represents a clear downgrade from the daily bullish reading. Hourly RSI at 45.67 drifts below the 50 line. It is not deeply bearish, but directionally soft.
Meanwhile, the 1H MACD histogram at -0.02 confirms the same loss of near-term momentum seen on the daily. The 1H Bollinger Bands place current price near the lower band at $3.92. That proximity suggests short-term price compression. A bounce from the lower band is a realistic near-term outcome. However, a breakdown below $3.92 would expose the $3.86 daily S1 support.
The 1H pivot point sits at $4.00, with R1 at $4.05. Reclaiming $4.00 on an hourly close basis would mark the first meaningful sign of short-term stabilization.
15-Minute Chart
On the 15-minute chart, the picture turns even more bearish. Price trades below the 15m EMA20 at $4.13, the EMA50 at $4.12, and the EMA200 at $4.03. This creates a clean bearish EMA stack on the shortest timeframe. The 15m RSI at 32.56 approaches oversold territory.
That level alone does not signal a bottom. Still, it indicates the intraday selling has been sharp and may be running out of steam. The 15m MACD histogram at -0.03 confirms continued short-term downside pressure.
For traders looking to time entries, the oversold RSI on the 15m combined with the 1H lower Bollinger Band creates a short-term setup worth monitoring. It is not a conviction trade, but a potential stabilization zone.
What Fundamental Catalysts Support Hive Stock?
HIVE Digital Technologies is pivoting decisively toward AI infrastructure, anchored by two major catalysts. The company received regulatory approval to acquire the Boden data center. It also announced a planned 320 MW AI-focused gigafactory in the Greater Toronto Area.
The Boden acquisition adds immediate operational capacity. Meanwhile, the gigafactory targets a launch in the second half of 2027. These are not incremental developments. They represent a deliberate strategic shift away from pure Bitcoin mining toward high-performance compute and AI infrastructure.
That pivot matters for forward valuation. In a market where AI infrastructure commands premium multiples, HIVE’s repositioning could provide a longer-term re-rating catalyst. Still, execution risk on a project of that scale is real and meaningful. The timeline stretches several years, leaving ample room for both opportunity and uncertainty.
What Are the Key Scenarios for Hive Stock?
The bullish scenario requires reclaiming $4.06 and holding above the Bollinger mid-band. In contrast, a breakdown below $3.86 would shift the bias meaningfully bearish. Both paths depend on how price resolves the current compression.
Bullish Scenario
A recovery back above the daily pivot at $4.06 would be the first step. A sustained close above the Bollinger mid-band at $4.09 would then reactivate upside momentum. If the daily MACD histogram begins recovering from its current negative reading, that would confirm the deceleration is temporary rather than structural.
Above $4.17 — the daily R1 — the path toward the upper Bollinger Band at $4.76 opens up. Continued positive newsflow around the Boden integration and the Toronto AI gigafactory would support this scenario further.
Bearish Scenario
The bearish case triggers with a breakdown below the daily S1 at $3.86. That level aligns approximately with the daily EMA20 at $3.85. Together, they form a critical support cluster. A close below that zone would signal more than a routine pullback.
It would push the daily MACD histogram deeper negative. It would also risk flipping the daily regime from bullish to neutral. The 1H structure is already neutral. The daily chart remains the last line of bullish confirmation. Losing it would shift the bias meaningfully.
FAQ
Is Hive stock a buy at current levels?
Hive stock presents a bullish medium-term thesis under short-term pressure. The daily structure remains sound, but the 1H and 15m charts suggest the stock needs time to stabilize. A reclaim of $4.00 on an hourly close would be the first meaningful sign that buyers are regaining control.
What is the most important support level for Hive stock?
The most critical support is the $3.86 level, which aligns with the daily S1 pivot and the daily EMA20 at $3.85. A close below this cluster would threaten the broader bullish structure and could flip the daily regime from bullish to neutral.
What are HIVE’s AI infrastructure growth plans?
HIVE Digital Technologies has two major AI catalysts: the recently approved Boden data center acquisition, which adds immediate capacity, and a planned 320 MW AI-focused gigafactory in the Greater Toronto Area targeting a launch in the second half of 2027. These represent a strategic pivot toward high-performance compute infrastructure.
What does the daily MACD signal for Hive stock right now?
The daily MACD line at 0.19 remains above zero, confirming positive momentum. However, the histogram sits at -0.08 because the signal line has crossed above the MACD line. This indicates bullish momentum is decelerating. It is not a reversal signal, but it warrants caution.
Disclaimer: This article is for informational purposes only and does not constitute financial advice, an investment recommendation, or a solicitation to buy or sell any financial instrument or cryptocurrency. The analysis provided is not indicative of future results. Investing in crypto assets and financial markets carries a high risk of capital loss. Always do your own research (DYOR) and consult a qualified financial advisor before making any decision.
Article produced with the assistance of artificial intelligence and reviewed by the editorial team.


 English (US) ·