
 6 hours ago
15
6 hours ago
15

Honeywell Aerospace Inc. stock plunged as much as 14% after management trimmed its full-year outlook, citing supply-chain bottlenecks. The violent session followed solid Q2 organic sales growth of 5% and a record backlog, leaving charts to digest the clash between strong demand and weaker near-term guidance.
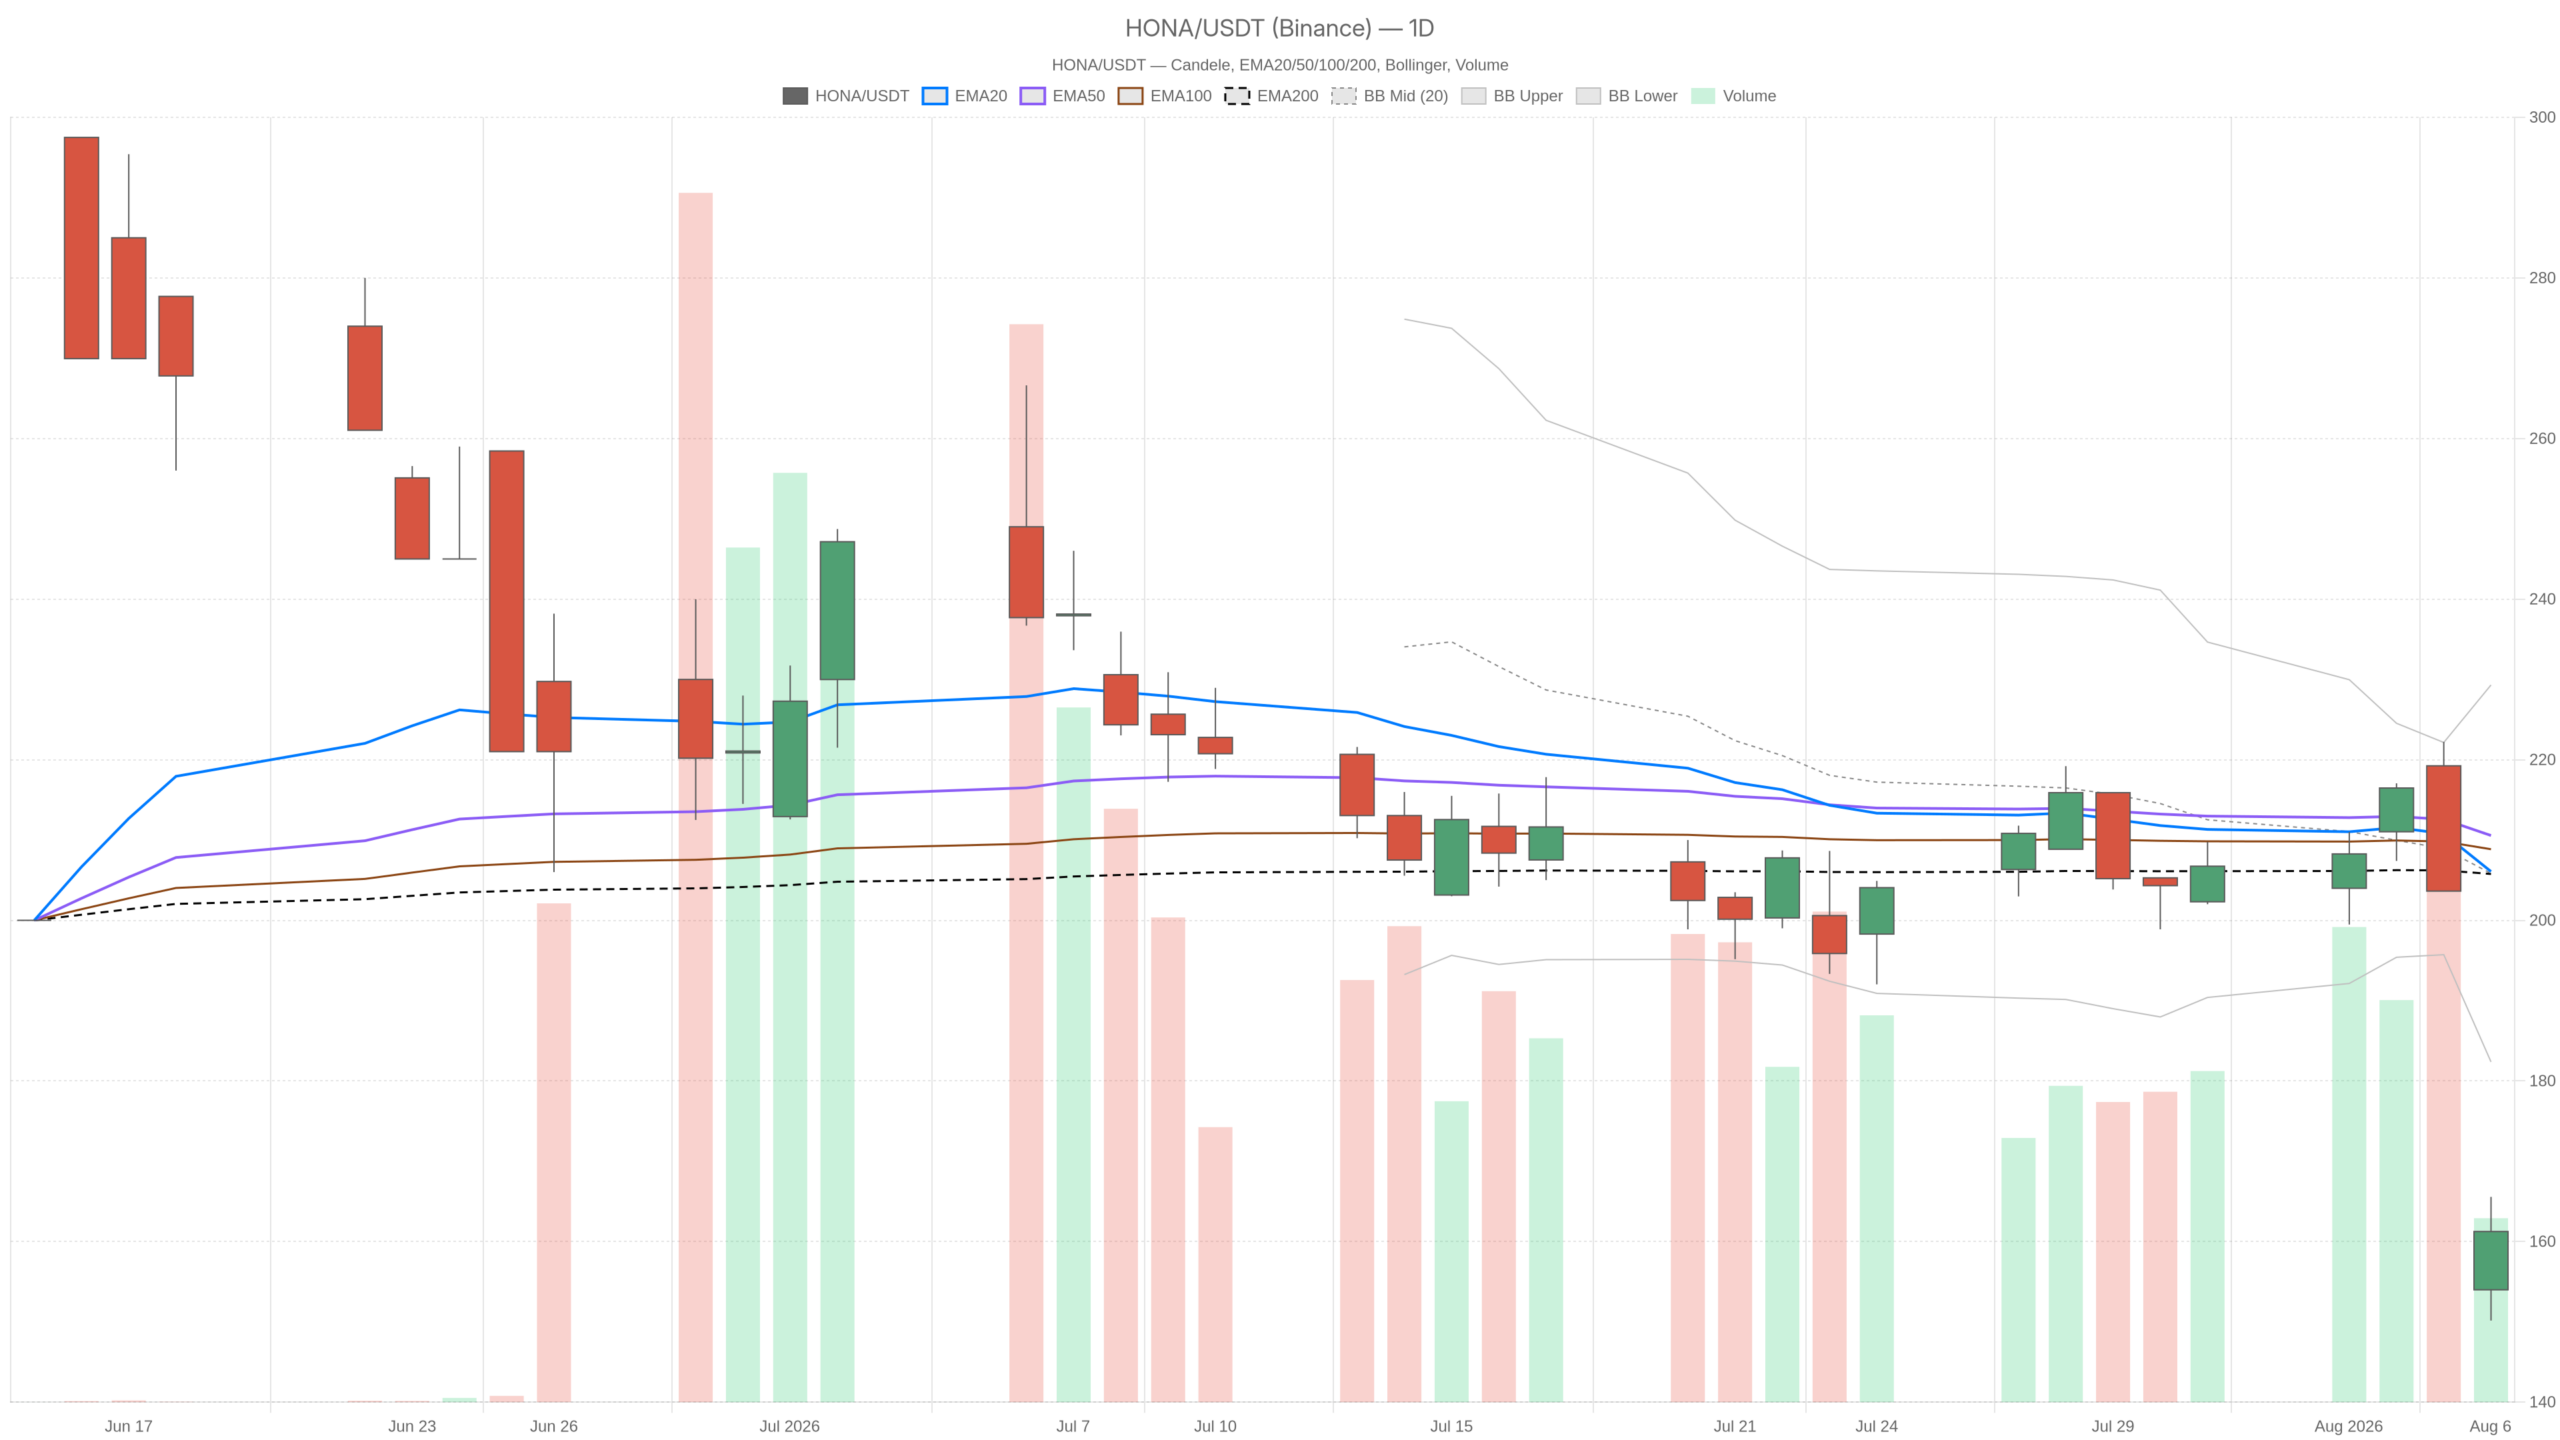 HONA — daily chart with candlesticks, EMA20/EMA50 and volume.
Key takeaways
- HONA fell as much as 14% after management lowered full-year guidance despite reporting 5% organic sales growth and a record backlog.
- Price closed at 161.25, below every major moving average on the daily, hourly, and 15-minute charts.
- Daily RSI14 at 32.95 is approaching oversold; hourly RSI14 at 18.01 and 15-minute RSI14 at 12.19 signal deeply oversold extremes.
- ATR14 on the daily chart at 14.11 and hourly at 7.44 point to elevated, news-driven volatility.
- Oversold conditions could trigger a relief bounce toward resistance near 167.82 or extend the breakdown below support at 152.42.
Daily Structure: Honeywell Aerospace Inc. Stock Breaks Below Every Major Moving Average
The daily chart confirms a bearish breakdown. Honeywell Aerospace Inc. stock closed beneath every key moving average after the earnings-driven selloff.
The daily candle tells the story plainly. Price opened at 153.99, spiked to a low of 150.16, then rallied to 165.56 before settling at 161.25. The wide, violent range closed well off the session low. Still, the broader picture remains heavy.
Price trades below the EMA20 at 206.08, the EMA50 at 210.56, and the EMA200 at 205.77. This full bearish stack confirms the daily trend has turned sharply lower. Meanwhile, the daily RSI14 at 32.95 approaches oversold territory but has not reached extreme levels.
MACD is clearly negative. The line reads -6.7 against a signal of -4.1, with a histogram of -2.6. Momentum is bearish across the board. The gap between line and signal shows selling pressure built quickly rather than gradually.
Bollinger Extremes and Elevated Volatility Point to Dislocation
The most telling detail is the Bollinger setup. The mid-band sits at 205.84, the upper band at 229.31, and the lower band at 182.37. Price at 161.25 trades entirely below the lower band. This reading typically appears only during sharp, news-driven dislocations, not orderly declines.
Volatility backs that up. Daily ATR14 at 14.11 reflects the scale of the post-earnings move. Pivot levels place the daily pivot point at 158.99. Resistance sits at 167.82, with support at 152.42. Price currently trades above the pivot but well under the upper structure. It remains stuck in a fragile middle zone.
Hourly Momentum Confirms the Bearish Tilt
The 1-hour chart reinforces the bearish case. The regime reading is labeled bearish, and every indicator agrees.
RSI14 has dropped to 18.01. This deeply oversold level suggests aggressive, largely one-directional selling over recent hours. MACD is also firmly negative. The line reads -6.45, the signal sits at -0.88, and the histogram is at -5.57. The wide gap shows momentum accelerating to the downside rather than stabilizing.
The EMA structure mirrors the daily picture. EMA20 at 200.61, EMA50 at 204.53, and EMA200 at 211.01 all sit well above current price. This confirms the downtrend is intact across timeframes.
Oversold Extremes and a Potential Rebound Signal
Bollinger bands on the hourly chart show a mid-line at 205.23. The upper band sits at 236.38, and the lower band at 174.08. Price again trades beneath the lower band. This is a second confirmation of an extended, volatility-driven move rather than a routine pullback. Hourly ATR14 reads 7.44, still elevated relative to typical conditions.
However, there is a nuance worth flagging. Extremely low RSI readings like 18.01 often precede short-term relief bounces, even inside a broader downtrend. That does not change the trend itself. But it does raise the odds of a technical bounce before any further breakdown.
15-Minute Execution Context
The 15-minute chart deepens the bearish tone. Oversold readings reach extreme levels on this timeframe.
RSI14 has fallen to 12.19, an extreme oversold reading. MACD shows the line at -12.98 against a signal of -7.64. The histogram reads -5.34. Momentum still points lower. However, the pace of deterioration here is the steepest of the three timeframes.
EMAs are stacked bearishly as well. EMA20 at 190.31, EMA50 at 201.47, and EMA200 at 205.29 all sit above current price. Pivot levels on both the hourly and 15-minute charts align at 162.47. Resistance sits at 163.84, with support at 159.89.
Price trades just below the pivot. This makes the narrow band the key short-term battleground for intraday direction. Given the stretched oversold readings, traders should expect sharp, fast moves in either direction rather than smooth trends.
Bullish Scenario: Can Honeywell Aerospace Inc. Stock Stage a Relief Bounce?
The bullish case rests on exhaustion rather than a trend change. Oversold extremes across short timeframes set the stage for a potential bounce.
RSI readings of 18 on the hourly chart and 12 on the 15-minute chart are historically stretched. Price has already closed well off its daily low of 150.16. If buyers step in, a recovery toward the daily pivot at 158.99 becomes plausible. A push toward resistance at 167.82 would follow. On the hourly chart, reclaiming the pivot at 162.47 would be an early signal. Pushing through resistance at 163.84 would confirm selling pressure is fading.
Notably, the news backdrop offers some support. Despite the guidance cut, the company reported a record backlog and solid underlying demand. Separately, Honeywell Aerospace secured a fleetwide weather radar upgrade from Omni Taxi Aereo. The deal covers 33 helicopters with IntuVue RDR-7000 radar. It is expected to support aftermarket revenue. Neither headline changes the technical picture. But both suggest the demand story behind Honeywell Aerospace Inc. stock has not collapsed. Only the near-term margin outlook has weakened.
Bearish Scenario: Breakdown Continuation Risk
The weight of evidence still favors caution. Price remains below every major moving average on all three timeframes. Both the daily and hourly charts show price trading beneath their respective lower Bollinger bands. That is not a normal pullback pattern. It reflects a genuine trend shift following the lowered outlook.
If price fails to hold above daily support at 152.42, the breakdown would likely extend. Volatility would stay elevated given the daily ATR14 reading of 14.11. A rejection at the hourly pivot near 162.47 would be a warning. A slide back under support at 159.89 would invalidate any near-term bounce attempt. It would reinforce the bearish structure across timeframes. In that case, the earlier reversal off the 150.16 low would look more like a pause than a genuine turnaround.
Closing Take
Overall, the picture across timeframes is not fully aligned. The daily chart shows a violent breakdown paired with a partial intraday recovery. The hourly and 15-minute charts remain firmly bearish with extreme oversold readings. This combination points to a market that priced in the guidance cut aggressively. Yet it has not found stable footing.
Meanwhile, elevated ATR readings across all three timeframes suggest volatility will likely stay high. Positioning around Honeywell Aerospace Inc. stock should account for that uncertainty. Oversold conditions can resolve either through a sharp bounce. Or they can give way to a continuation of the same selling pressure that triggered this move.
FAQ
Why did Honeywell Aerospace Inc. stock drop sharply?
The stock fell after management trimmed its full-year outlook, citing supply-chain bottlenecks that pushed sales toward lower-margin original-equipment and domestic defense programs. Despite 5% organic sales growth and a record backlog, the weaker near-term guidance triggered a selloff of up to 14%.
Is Honeywell Aerospace Inc. stock oversold?
Yes, across short timeframes. The hourly RSI14 has dropped to 18.01, and the 15-minute RSI14 has fallen to 12.19, both deeply oversold. The daily RSI14 at 32.95 is approaching oversold but has not yet reached extreme territory.
What are the key support and resistance levels for HONA?
Daily support sits at 152.42, with resistance at 167.82. The daily pivot point is at 158.99. On the hourly chart, the pivot aligns at 162.47, with resistance at 163.84 and support at 159.89.
Could Honeywell Aerospace Inc. stock stage a recovery?
A relief bounce is possible given the extreme oversold readings on the hourly and 15-minute charts. If buyers step in, a recovery toward the daily pivot at 158.99 and resistance at 167.82 becomes plausible. However, the broader trend remains bearish, and a breakdown below support at 152.42 would likely extend the decline.
Disclaimer: This article is for informational purposes only and does not constitute financial advice, an investment recommendation, or a solicitation to buy or sell any financial instrument or cryptocurrency. The analysis provided is not indicative of future results. Investing in crypto assets and financial markets carries a high risk of capital loss. Always do your own research (DYOR) and consult a qualified financial advisor before making any decision.
Article produced with the assistance of artificial intelligence and reviewed by the editorial team.








 English (US) ·