
 3 hours ago
18
3 hours ago
18
TLDR:
- Bitcoin trades near $79.7K, while the current chart places immediate resistance at the $81,259 level.
- BTC may see $76,206 as lower-range support and identifies $72K-$74K as the deeper support zone now.
- August U.S. payrolls rose by 162,000, pushing market odds toward a Federal Reserve rate hike in September.
- U.S. spot Bitcoin ETFs drew $3.52B in August inflows, marking their strongest monthly total so far in 2026.
Bitcoin is trading near $79,700 up 0.25% after spending the weekend close to the $80,000 level. The price remains below last week’s peak above $82,000, where buyers failed to hold the breakout. Bitcoin still gained about 25% during August, its strongest monthly advance since November 2024.
Despite this, the BTC price remains about 36.9% below its October 2025 all-time high of $126,080. The next move now depends on whether BTC can reclaim resistance near $81,259; however, a rejection could reopen the path toward $76,206 and the deeper $72,000 to $74,000 support zone.
Bitcoin Price Faces $81K Resistance Before $83K
Bitcoin has repeatedly tested the upper part of its current trading range. The chart places immediate resistance around $81,259, while recent market data shows a seven-day high above $82,100.
A clean move above $81,259 could expose the $82,000 to $83,000 area this week. The setup also allows a brief liquidity sweep above recent highs before another pullback develops.
Such a move would not confirm a larger breakout by itself. Buyers would need to keep BTC above the range after clearing resistance.
Failure to hold above $81,000 would keep the market inside its current structure. The lower range boundary near $76,206 would then become the next technical level to watch.
$72K to $74K Remains the Main Downside Zone
The chart also shows a deeper pullback toward $72,000 to $74,000 if support near $76,206 fails. That zone sits below the current consolidation and near levels traded during August.
The projected structure resembles a previous Bitcoin pattern where price swept a local high before reversing. The comparison does not require Bitcoin to repeat the earlier move exactly.
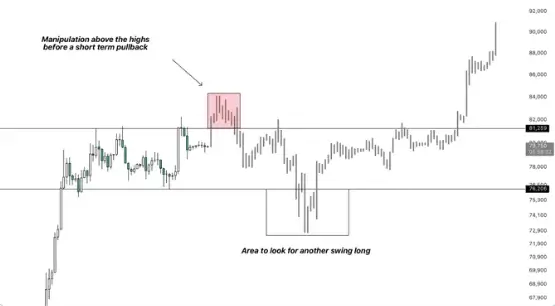
BTC/USD chart (Source: X)
A stronger buyer response around $72,000 to $74,000 could keep the wider recovery structure active. Should this happen, the Bitcoin price could then retest $76,000 before challenging the $81,259 resistance level again. However, a break below that support would weaken the setup and expose lower technical levels.
Jobs Data Adds Pressure Before Fed Meeting
Bitcoin’s latest rejection followed stronger U.S. employment data released on September 4. Nonfarm payrolls rose by 162,000 in August, while unemployment remained at 4.1%.
The report increased market expectations for another Federal Reserve rate increase. Rate futures moved toward a roughly 60% probability of a September hike.
The Federal Reserve will hold its next policy meeting on September 15 and 16. August inflation data arrives before that decision and could alter current rate expectations.
Higher interest-rate expectations can support Treasury yields and the dollar, which may pressure risk assets. Bitcoin therefore enters the week with technical resistance and macroeconomic uncertainty.
ETF Flows and Treasury Buybacks Could Support BTC
U.S. spot Bitcoin ETFs recorded $3.52 billion in net inflows during August. That was their strongest month of 2026, while Bitcoin gained about 25%.
September started less smoothly, with the funds recording $236.46 million in net outflows on the first trading day. ETF flows remain one measure of institutional demand as Bitcoin tests $80,000.
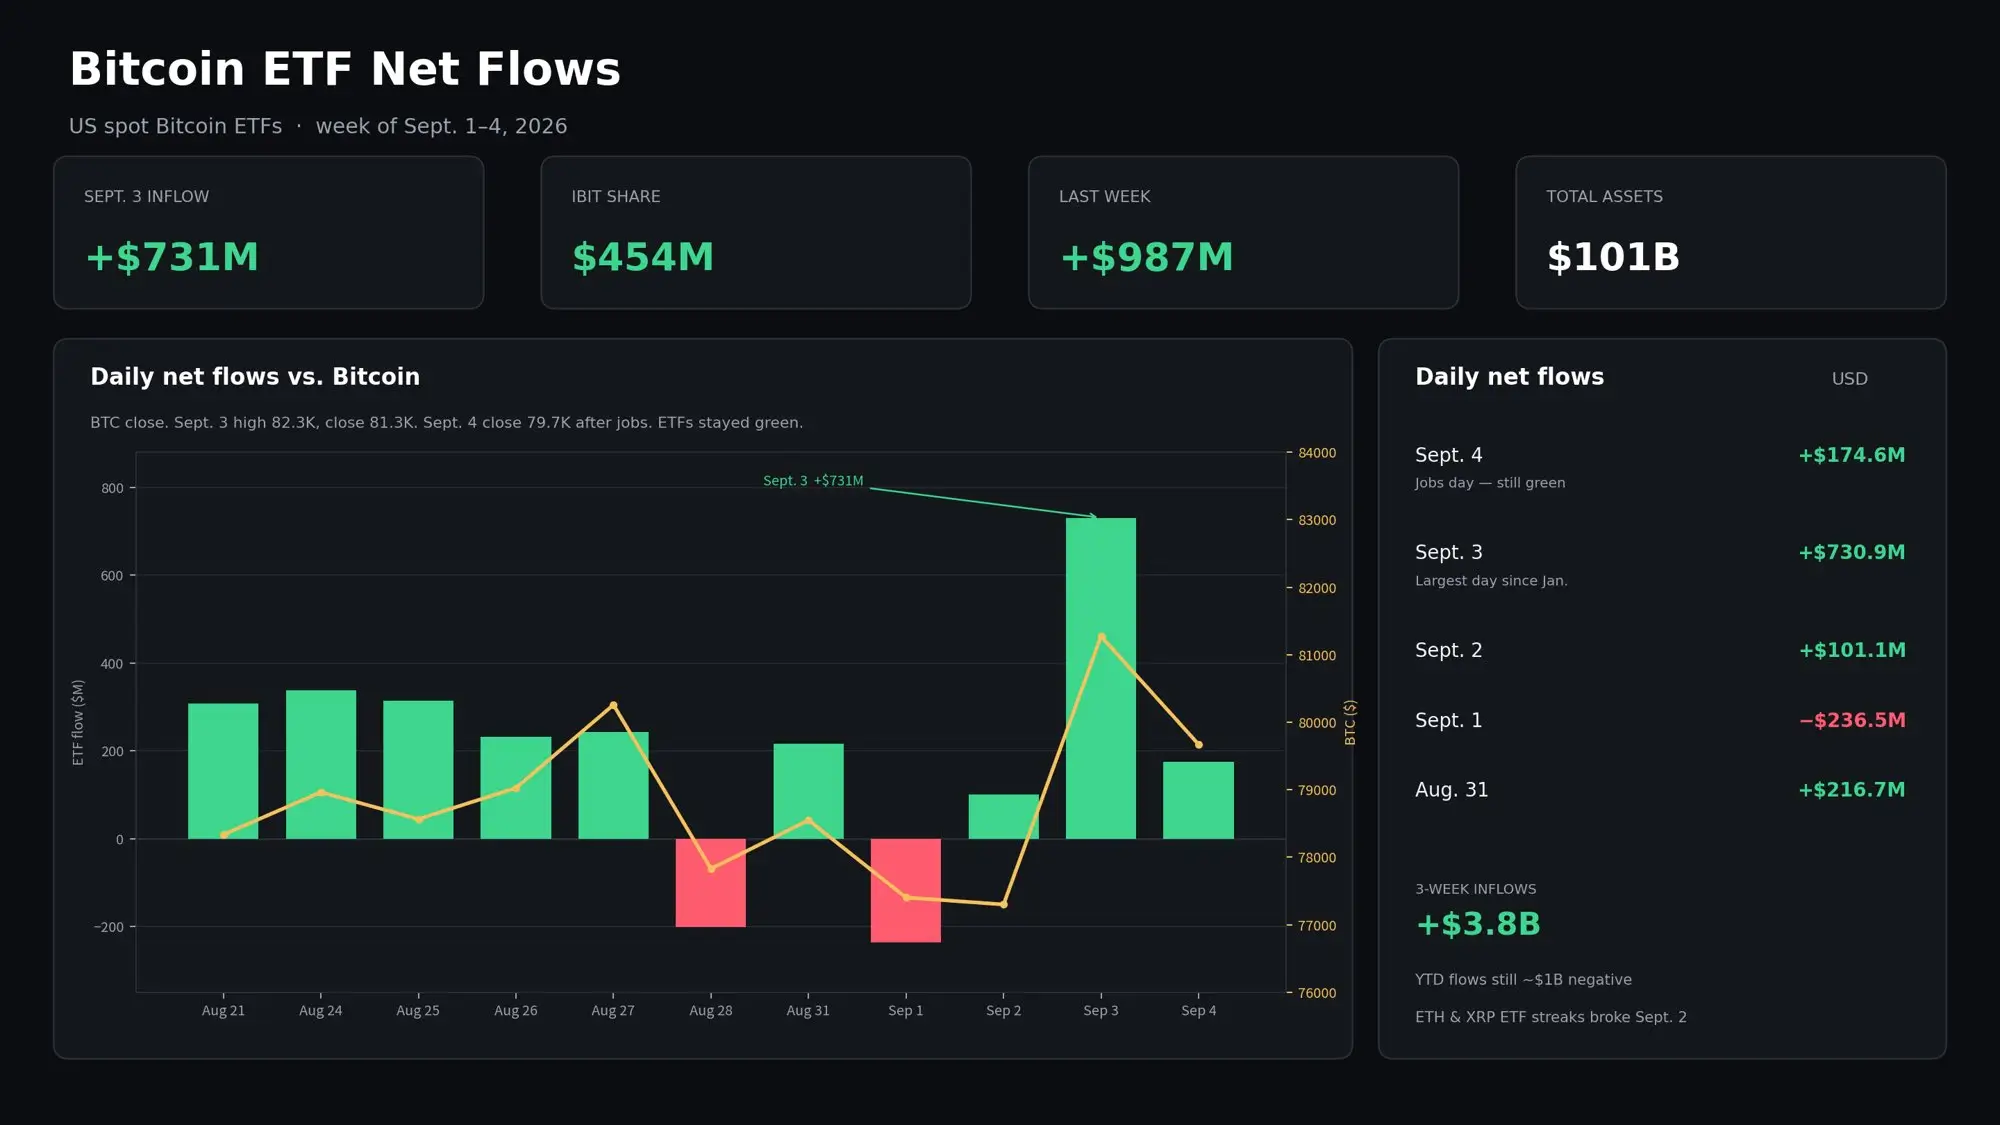
Source: X
The U.S. Treasury will also increase long-dated bond buybacks from September 9. Maximum purchases will rise from $2 billion to at least $4 billion per operation.
The program aims to improve liquidity in longer-dated Treasury markets rather than directly fund cryptocurrency purchases. Easier bond-market conditions can still affect broader risk sentiment.
For Bitcoin, $83,000 remains the nearer upside target if buyers reclaim $81,259 and hold the breakout. The bearish path points toward $76,206 before the $72,000 to $74,000 zone.
The post How High Can Bitcoin Price Go This Week? $83K Rally or $73K Pullback? appeared first on Blockonomi.


 English (US) ·