
 2 months ago
34
2 months ago
34
- HYPE is testing a key support level at 0.526, with a potential move toward $40 if it holds
- A breakdown could trigger downside toward $32, especially with rising open interest and token unlocks
- Momentum indicators show weakening strength, suggesting consolidation before the next major move
HYPE is sitting at one of those levels where things don’t stay quiet for long. The HYPE/BTC pair is currently testing the 0.526 zone, and according to analyst Umair Crypto, this level isn’t just another number — it’s a key confluence point.
If it holds, there’s a decent chance of a relief bounce. Not necessarily a full trend reversal, but enough to push price upward, possibly forming a lower high somewhere near the $40 region. But if it breaks… the tone shifts quickly, and not in a good way.
Right now, price action feels almost binary. It’s less about gradual movement and more about which side gives first — structure or momentum.
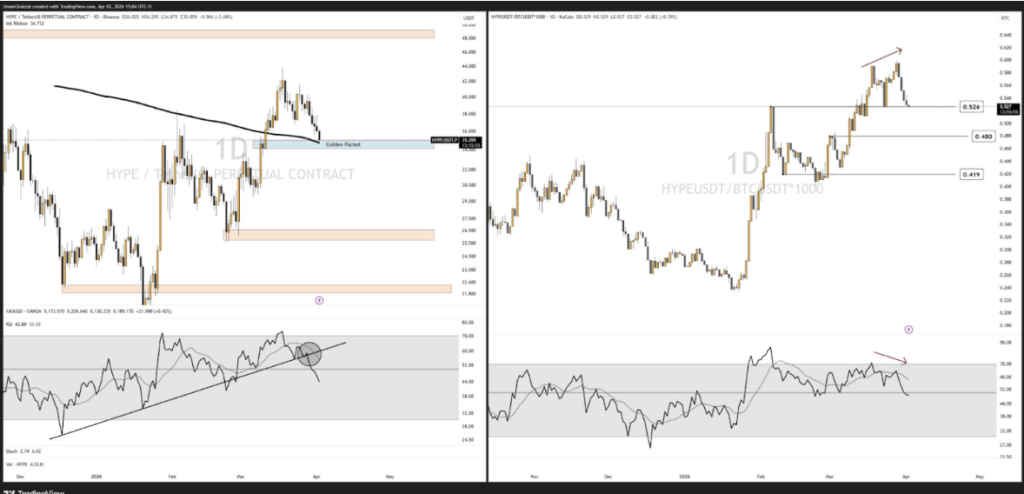
Breakdown Risk Builds Below Key Confluence
If HYPE loses that 0.526 level, things could unravel pretty fast. That support isn’t isolated — it lines up with several important technical zones on the USDT pair, including an order block, the 200 SMA, and the so-called “golden pocket.”
Losing all of that at once would flip sentiment sharply bearish. In that scenario, the next logical downside target sits near $32, which has been mentioned as a key level to watch.
And there’s more pressure building in the background. Open interest has climbed to around $1.56 billion, which tends to amplify volatility, especially when positioning gets crowded. On top of that, institutional flows via Ripple Prime and an upcoming unlock of about 9.92 million tokens on April 6 could add extra weight to the downside… or at least keep things unstable.
Signs of Recovery, But Not Convincing Yet
Looking at the broader chart, HYPE has shown some signs of recovery since bottoming earlier in 2026. Price is currently around $35.78, hovering just above the intersection of the 20-EMA and 50-EMA.
That area usually acts as a short-term pivot, and for now, it’s holding. But the presence of recent red candles suggests sellers haven’t fully stepped away. It’s more like a pause than a clear push upward.
The range is also pretty defined. Resistance sits near the upper Bollinger Band around $42.26, while support aligns with the 200-EMA near $32.11. Until one of those breaks, price is likely to keep moving sideways… which can feel slow, but it’s often where setups form.
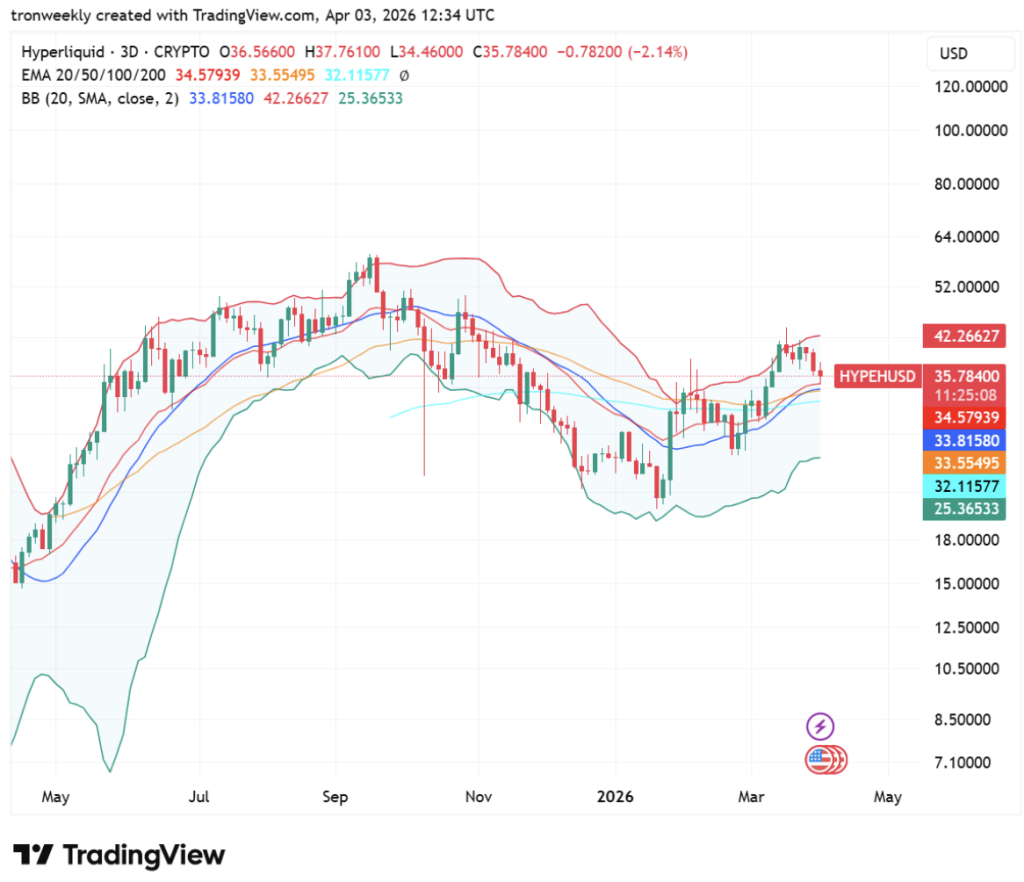
Momentum Starts to Fade
Momentum indicators are starting to cool off a bit. The RSI is currently around 53.74 — right in neutral territory. Not overbought, not oversold, just… in the middle.
It recently touched levels near 70, which hinted at strong bullish momentum, but that strength has faded. The drop back toward the average suggests demand isn’t as aggressive anymore.
MACD tells a similar story. The lines are still in positive territory, but they’re converging, and the histogram bars are losing intensity. It’s not a reversal yet, but it does point to slowing momentum — the kind that often leads to consolidation before the next move.
A Break Is Coming, Direction Still Unclear
Overall, HYPE is in a tightening structure. Support is being tested, momentum is fading, and volatility is compressing — all signs that a bigger move is likely approaching.
If the 0.526 level holds and buyers step in, a move toward $40 could follow. But if that support breaks, the downside toward $32 becomes much more likely.
For now, the market feels like it’s waiting… just on the edge. And once it moves, it probably won’t be subtle.
Disclaimer: BlockNews provides independent reporting on crypto, blockchain, and digital finance. All content is for informational purposes only and does not constitute financial advice. Readers should do their own research before making investment decisions. Some articles may use AI tools to assist in drafting, but every piece is reviewed and edited by our editorial team of experienced crypto writers and analysts before publication.


 English (US) ·