
 7 hours ago
18
7 hours ago
18
Intel stock closed at $86.30 on July 28, sitting nearly 39% below its June highs. Despite analyst upgrades and a 15-year revenue record, INTC trades firmly below key moving averages — the bearish trend remains dominant.
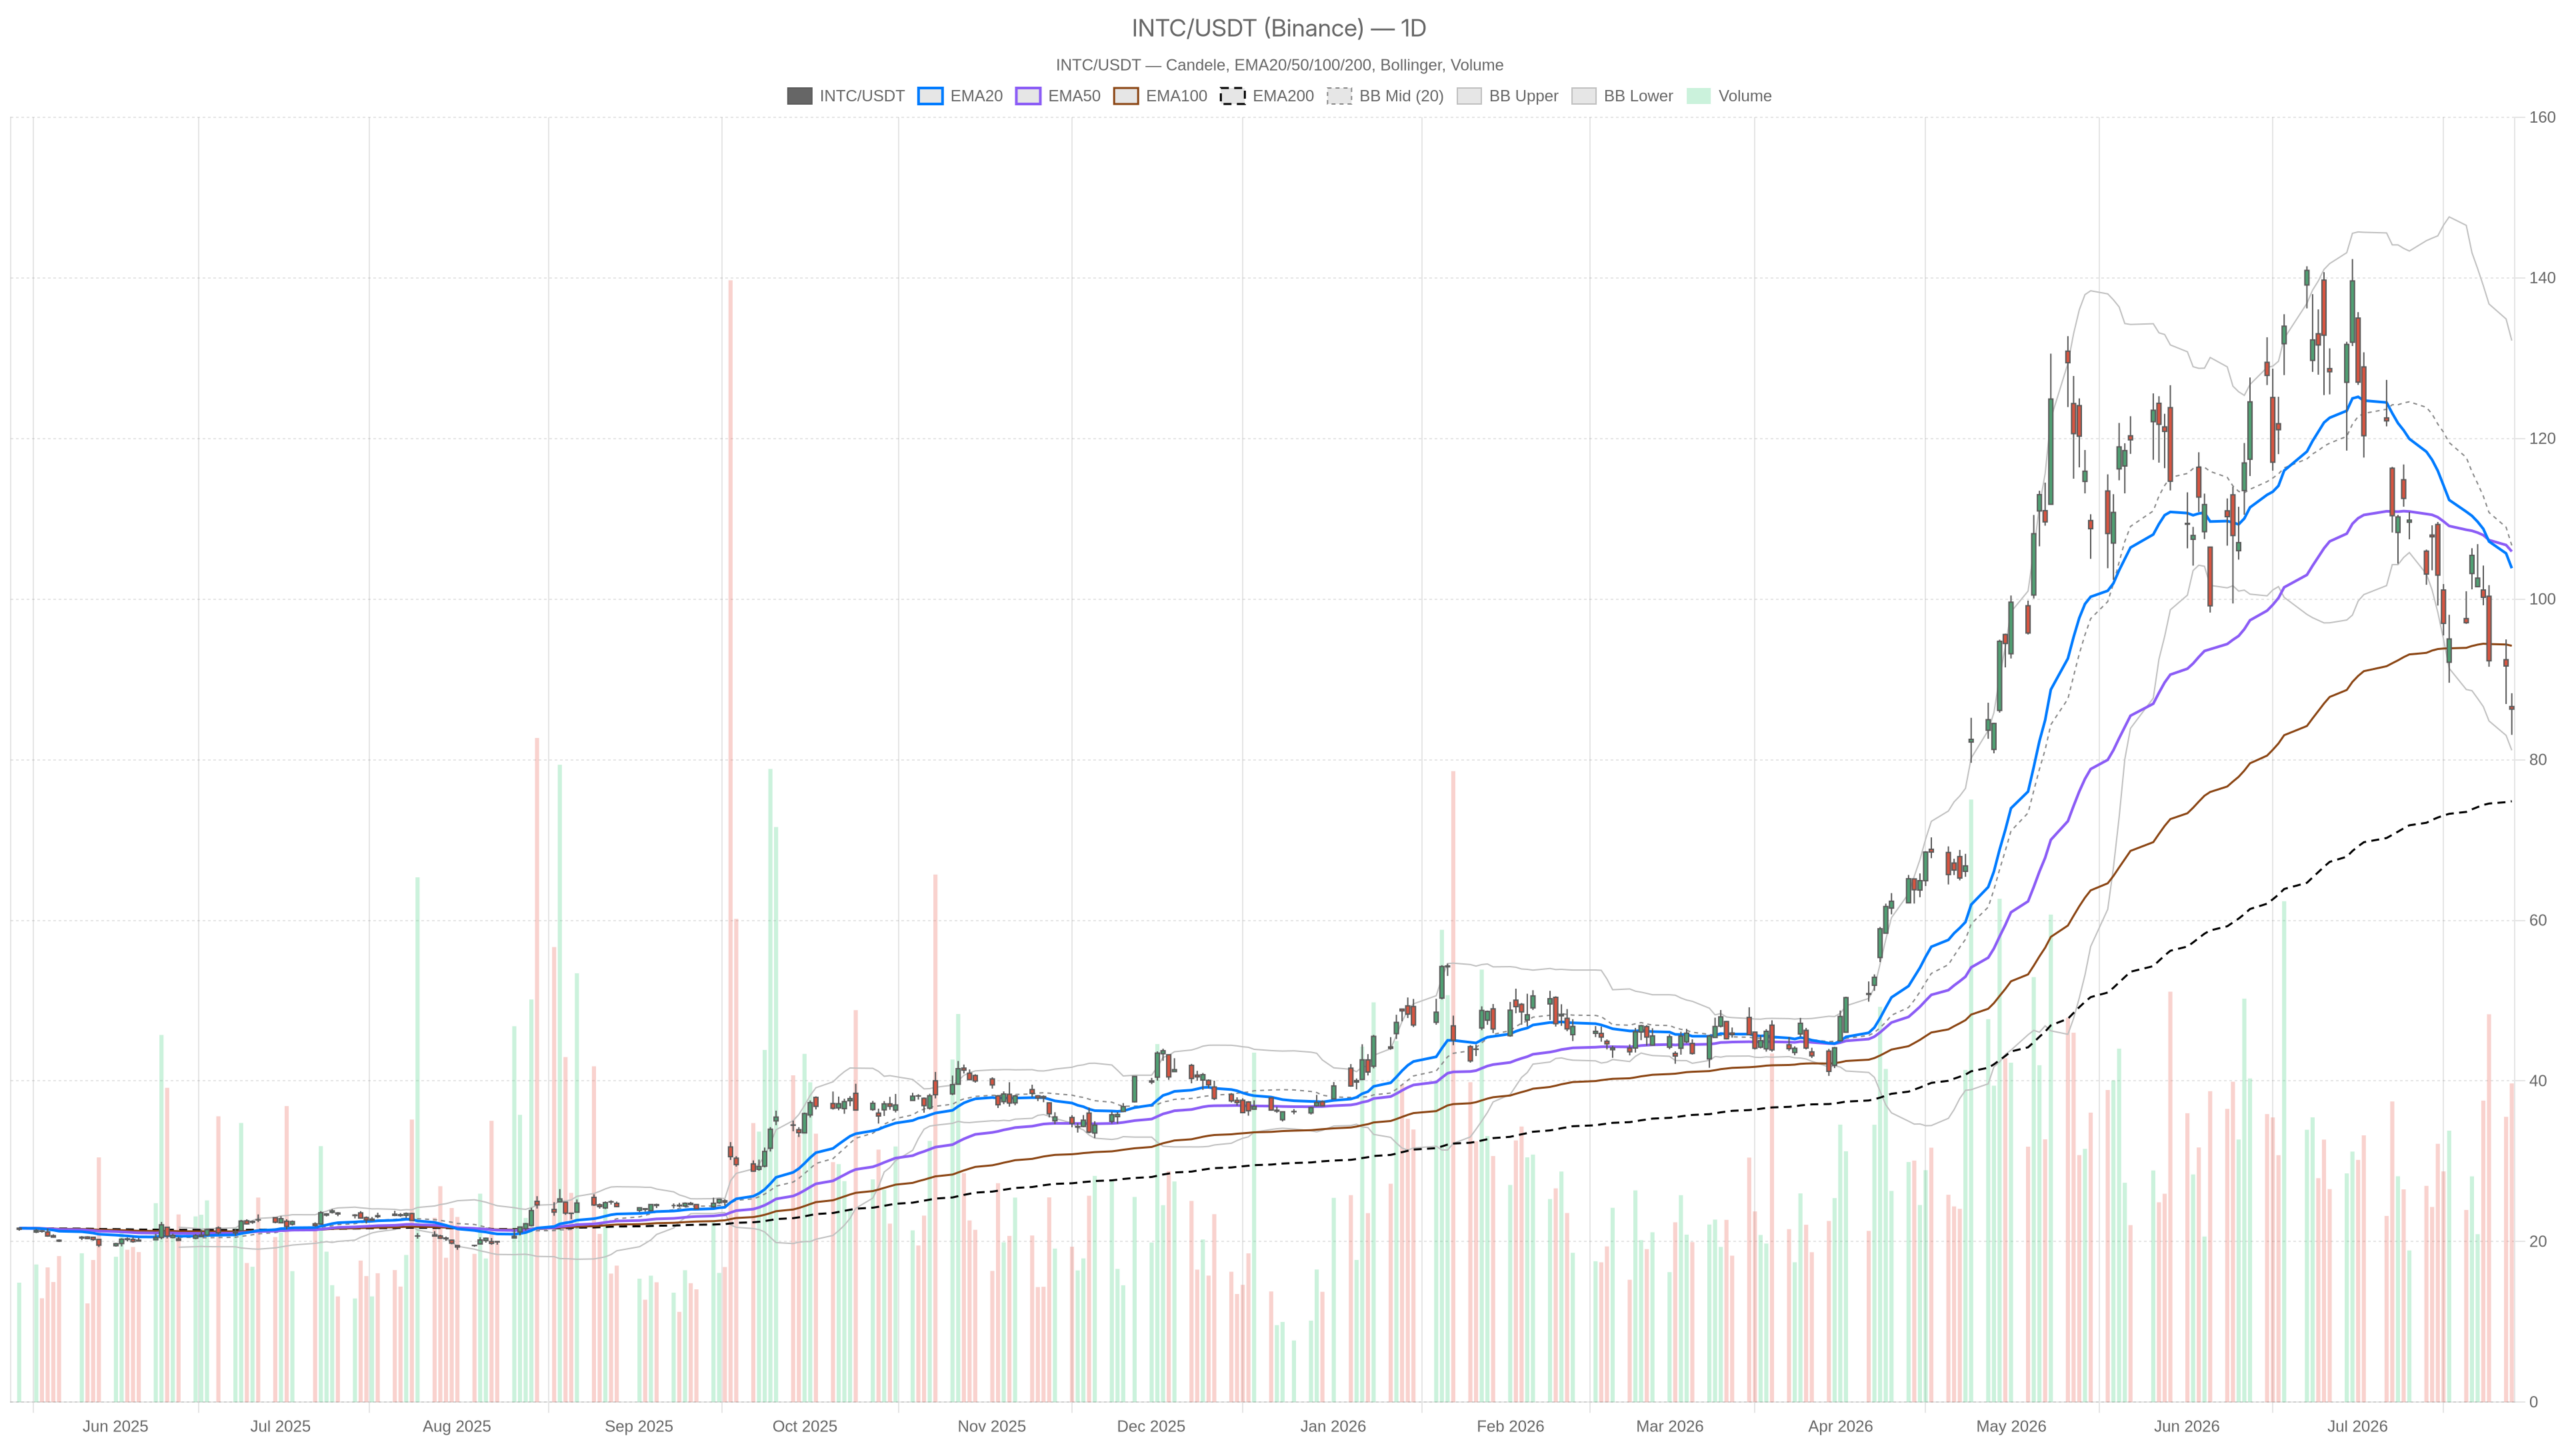 INTC — daily chart with candlesticks, EMA20/EMA50 and volume.
Key takeaways
- Intel stock closed at $86.30 on July 28, nearly 39% below its June highs, trading below all short- and medium-term moving averages.
- The daily RSI at 33.76 approaches oversold territory, while the MACD histogram at -2.02 signals ongoing momentum deterioration.
- Analyst fair value estimates have risen from $88.61 to $115.65, with price targets now clustering in the $120–$200 range.
- The daily ATR of 7.46 reflects elevated volatility, demanding meaningful risk buffers around any position.
- A daily close below $83.51 would open the path toward the EMA200 support at $74.83.
Daily Timeframe: The Main Bias Remains Bearish
Intel stock’s daily chart is structurally bearish. Price at $86.30 trades well below both the EMA20 at $103.85 and the EMA50 at $105.94.
That gap is substantial — nearly $18 to the EMA20 alone. It signals that the ongoing correction is a significant downtrend with real selling pressure behind it. The one structural positive on the daily chart is the EMA200 at $74.83. Price is currently trading above it. That longer-term average acts as a floor. As long as INTC holds above it, the multi-year base case has not been destroyed. However, with the stock falling nearly 40% from recent highs, that floor is now considerably closer than it once appeared.
Momentum Indicators Flash Warning
The daily RSI at 33.76 is approaching oversold territory. It does not confirm a reversal on its own. Still, it does suggest the selling has been intense and a technical relief bounce is increasingly possible. Meanwhile, the MACD tells a harder story. The line sits at -6.96 against a signal of -4.94. The negative histogram of -2.02 shows momentum is still deteriorating, not stabilizing.
Volatility and Key Pivot Levels
Bollinger Bands on the daily frame add further context. The lower band is at $81.18 and the midline at $106.69. Price is trading closer to the lower band than the midline. This reinforces the downside pressure. The ATR of 7.46 on the daily chart highlights just how volatile INTC has become. Daily swings of that magnitude demand respect. Any positioning around current levels requires meaningful risk buffers.
Daily pivot analysis places the pivot point at $85.89. INTC closed just above it at $86.30, with R1 at $88.69 and S1 at $83.51. The stock needs to clear $88.69 convincingly to signal even a short-term shift in sentiment. A break below $83.51 would open the door toward the lower Bollinger Band at $81.18. From there, the EMA200 at $74.83 becomes the next major target.
The Analyst Upgrade Divergence
Analysts have lifted Intel’s fair value estimate from $88.61 to $115.65. Many firms now cluster their price targets in the $120–$200 range. That reset is driven by Q2 results, AI-related server CPU demand, and the Fortinet foundry deal. Notably, Intel’s revenue growth recently reached levels not seen in over a decade.
Yet the market is not rewarding this story with higher prices — at least not yet. Morgan Stanley’s Mike Wilson has pointed to continued choppiness in the broader market as a headwind for chip stocks, including INTC. That macro friction may be suppressing what would otherwise be a more powerful fundamental re-rating. The divergence between fundamental optimism and weak price action remains one of the central tensions in Intel stock right now.
Intel Stock on the 1H Chart: Bearish Regime Confirmed
The 1H chart confirms the bearish regime without ambiguity. Price at $86.30 trades below the 1H EMA20 at $90.41, the EMA50 at $95.39, and far below the EMA200 at $107.61. All three moving averages slope against the bulls. There is no intraday structure offering any real relief.
The 1H RSI at 36.51 is weak but not technically oversold. It suggests the downside has been persistent without triggering a mechanical bounce yet. The MACD on the 1H is near flat. The line at -3.28 versus the signal at -3.24 gives a marginally negative histogram of -0.04. That near-zero spread indicates a potential pause in momentum deterioration. It is not a reversal, but perhaps a brief consolidation before the next directional move resolves.
The 1H Bollinger Band lower boundary sits at $83.08, with a midline at $90.23. Price is pinned in the lower half of the band, consistent with the bearish regime. The 1H ATR of 2.80 indicates meaningful intraday swings are still present. Hourly pivot analysis shows a pivot point at $86.88, with R1 at $87.52 and S1 at $85.65. Price closed at $86.30, just below the pivot. That is a marginal but telling position confirming sellers retain near-term control.
15-Minute Chart: The Only Flicker of Near-Term Relief
The 15-minute chart remains bearish in regime but contains one minor technical note. The MACD histogram has turned slightly positive at +0.19. The MACD line at -0.45 has crossed above the signal at -0.64. This micro-divergence hints at short-term consolidation or a very modest attempt at stabilization.
In contrast, price remains below the 15m EMA20 at $86.94 and EMA50 at $88.75. The RSI at 43.57 is neutral — not oversold, not showing any real buying conviction. The 15m Bollinger Band is narrow, with a range of $85.66 to $87.80. This suggests compressed near-term volatility. A breakout from this band in either direction would be the clearest short-term signal for execution timing. The 15m pivot sits at $86.64 with R1 at $87.04. Both are modest hurdles, but INTC has struggled even to hold above them.
Bullish Scenario: What Would Need to Happen
A credible bullish reversal for Intel stock requires reclaiming and holding above the daily pivot at $85.89. Price must then push through the 1H R1 at $87.52. A close above $88.69 — the daily R1 — would be the first meaningful structural signal that short-term sellers are exhausted.
Beyond that, a sustained move back toward the $90–$95 zone would begin to close the gap with the 1H EMA moving averages. This would provide genuine evidence of trend repair. The fundamental tailwinds are real. The analyst upgrades, the AI demand thesis, the foundry customer addition, and the historically strong revenue growth all provide a legitimate case for eventual re-rating. If broader chip-sector sentiment stabilizes and the S&P 500 choppiness begins to settle, those fundamentals could start to matter more in price.
Bearish Scenario: What Would Invalidate the Recovery Case
A daily close below $85.65 would invalidate any near-term recovery thesis for Intel stock. Below that, the daily S1 at $83.51 becomes the next critical level. A breach there signals sellers are still firmly in control. The lower daily Bollinger Band at $81.18 would then become the next logical target. Below that, the EMA200 on the daily chart at $74.83 represents the last major structural support.
At the same time, if the daily MACD continues to widen its negative histogram — currently at -2.02 — without any sign of convergence, it would confirm ongoing momentum deterioration. The stock’s 39% decline since June shows this is not a slow bleed. It moves fast and punishes hesitation. Any failure to hold current pivot support would likely accelerate that dynamic.
Positioning, Volatility, and the Uncertainty Ahead
Intel stock presents a genuine fundamental recovery story trapped inside a broken technical structure. The daily timeframe defines the bias as bearish. The hourly timeframe confirms it without ambiguity. Only at the 15-minute level does any tentative stabilization signal appear. Even that is fragile.
The daily ATR of 7.46 makes clear that volatility is elevated. With the stock priced near key pivot support, any catalyst can produce sharp moves in either direction. The fundamental narrative gives Intel a credible long-term recovery thesis. However, price structure needs to confirm that story before the risk-reward shifts decisively. Until INTC reclaims meaningful overhead levels, the burden of proof remains on the bulls.
FAQ
Is Intel stock oversold right now?
The daily RSI at 33.76 is approaching oversold territory but has not crossed below the classic 30 threshold. The MACD histogram at -2.02 confirms momentum is still deteriorating. While the selling has been intense, the indicators suggest the stock could remain under pressure before any sustained bounce materializes.
What price level must Intel stock reclaim for a bullish reversal?
A credible bullish reversal requires INTC to reclaim and hold above the daily pivot at $85.89, then push through $87.52 and $88.69. A sustained move into the $90–$95 zone would begin closing the gap with the 1H moving averages and provide genuine evidence of trend repair.
What is the key support level for Intel stock?
The immediate support sits at the daily S1 of $83.51. Below that, the lower daily Bollinger Band at $81.18 becomes the next target. The EMA200 at $74.83 represents the last major structural support — a level that must hold to preserve the multi-year base case.
Why is Intel stock falling despite strong fundamentals?
The market appears to be weighing macro headwinds — including the broader chip-sector choppiness flagged by Morgan Stanley — more heavily than Intel’s improved fundamentals. The divergence between analyst upgrades and weak price action suggests near-term technical selling pressure is overriding the fundamental narrative for now.
Disclaimer: This article is for informational purposes only and does not constitute financial advice, an investment recommendation, or a solicitation to buy or sell any financial instrument or cryptocurrency. The analysis provided is not indicative of future results. Investing in crypto assets and financial markets carries a high risk of capital loss. Always do your own research (DYOR) and consult a qualified financial advisor before making any decision.
Article produced with the assistance of artificial intelligence and reviewed by the editorial team.





 English (US) ·