
 4 hours ago
11
4 hours ago
11

Intuit Stock remains pressured despite a guidance raise, with sellers defending 390 and rallies capped below resistance. Therefore, the 375–393 range is the near-term battleground, and the primary bias stays bearish across timeframes.
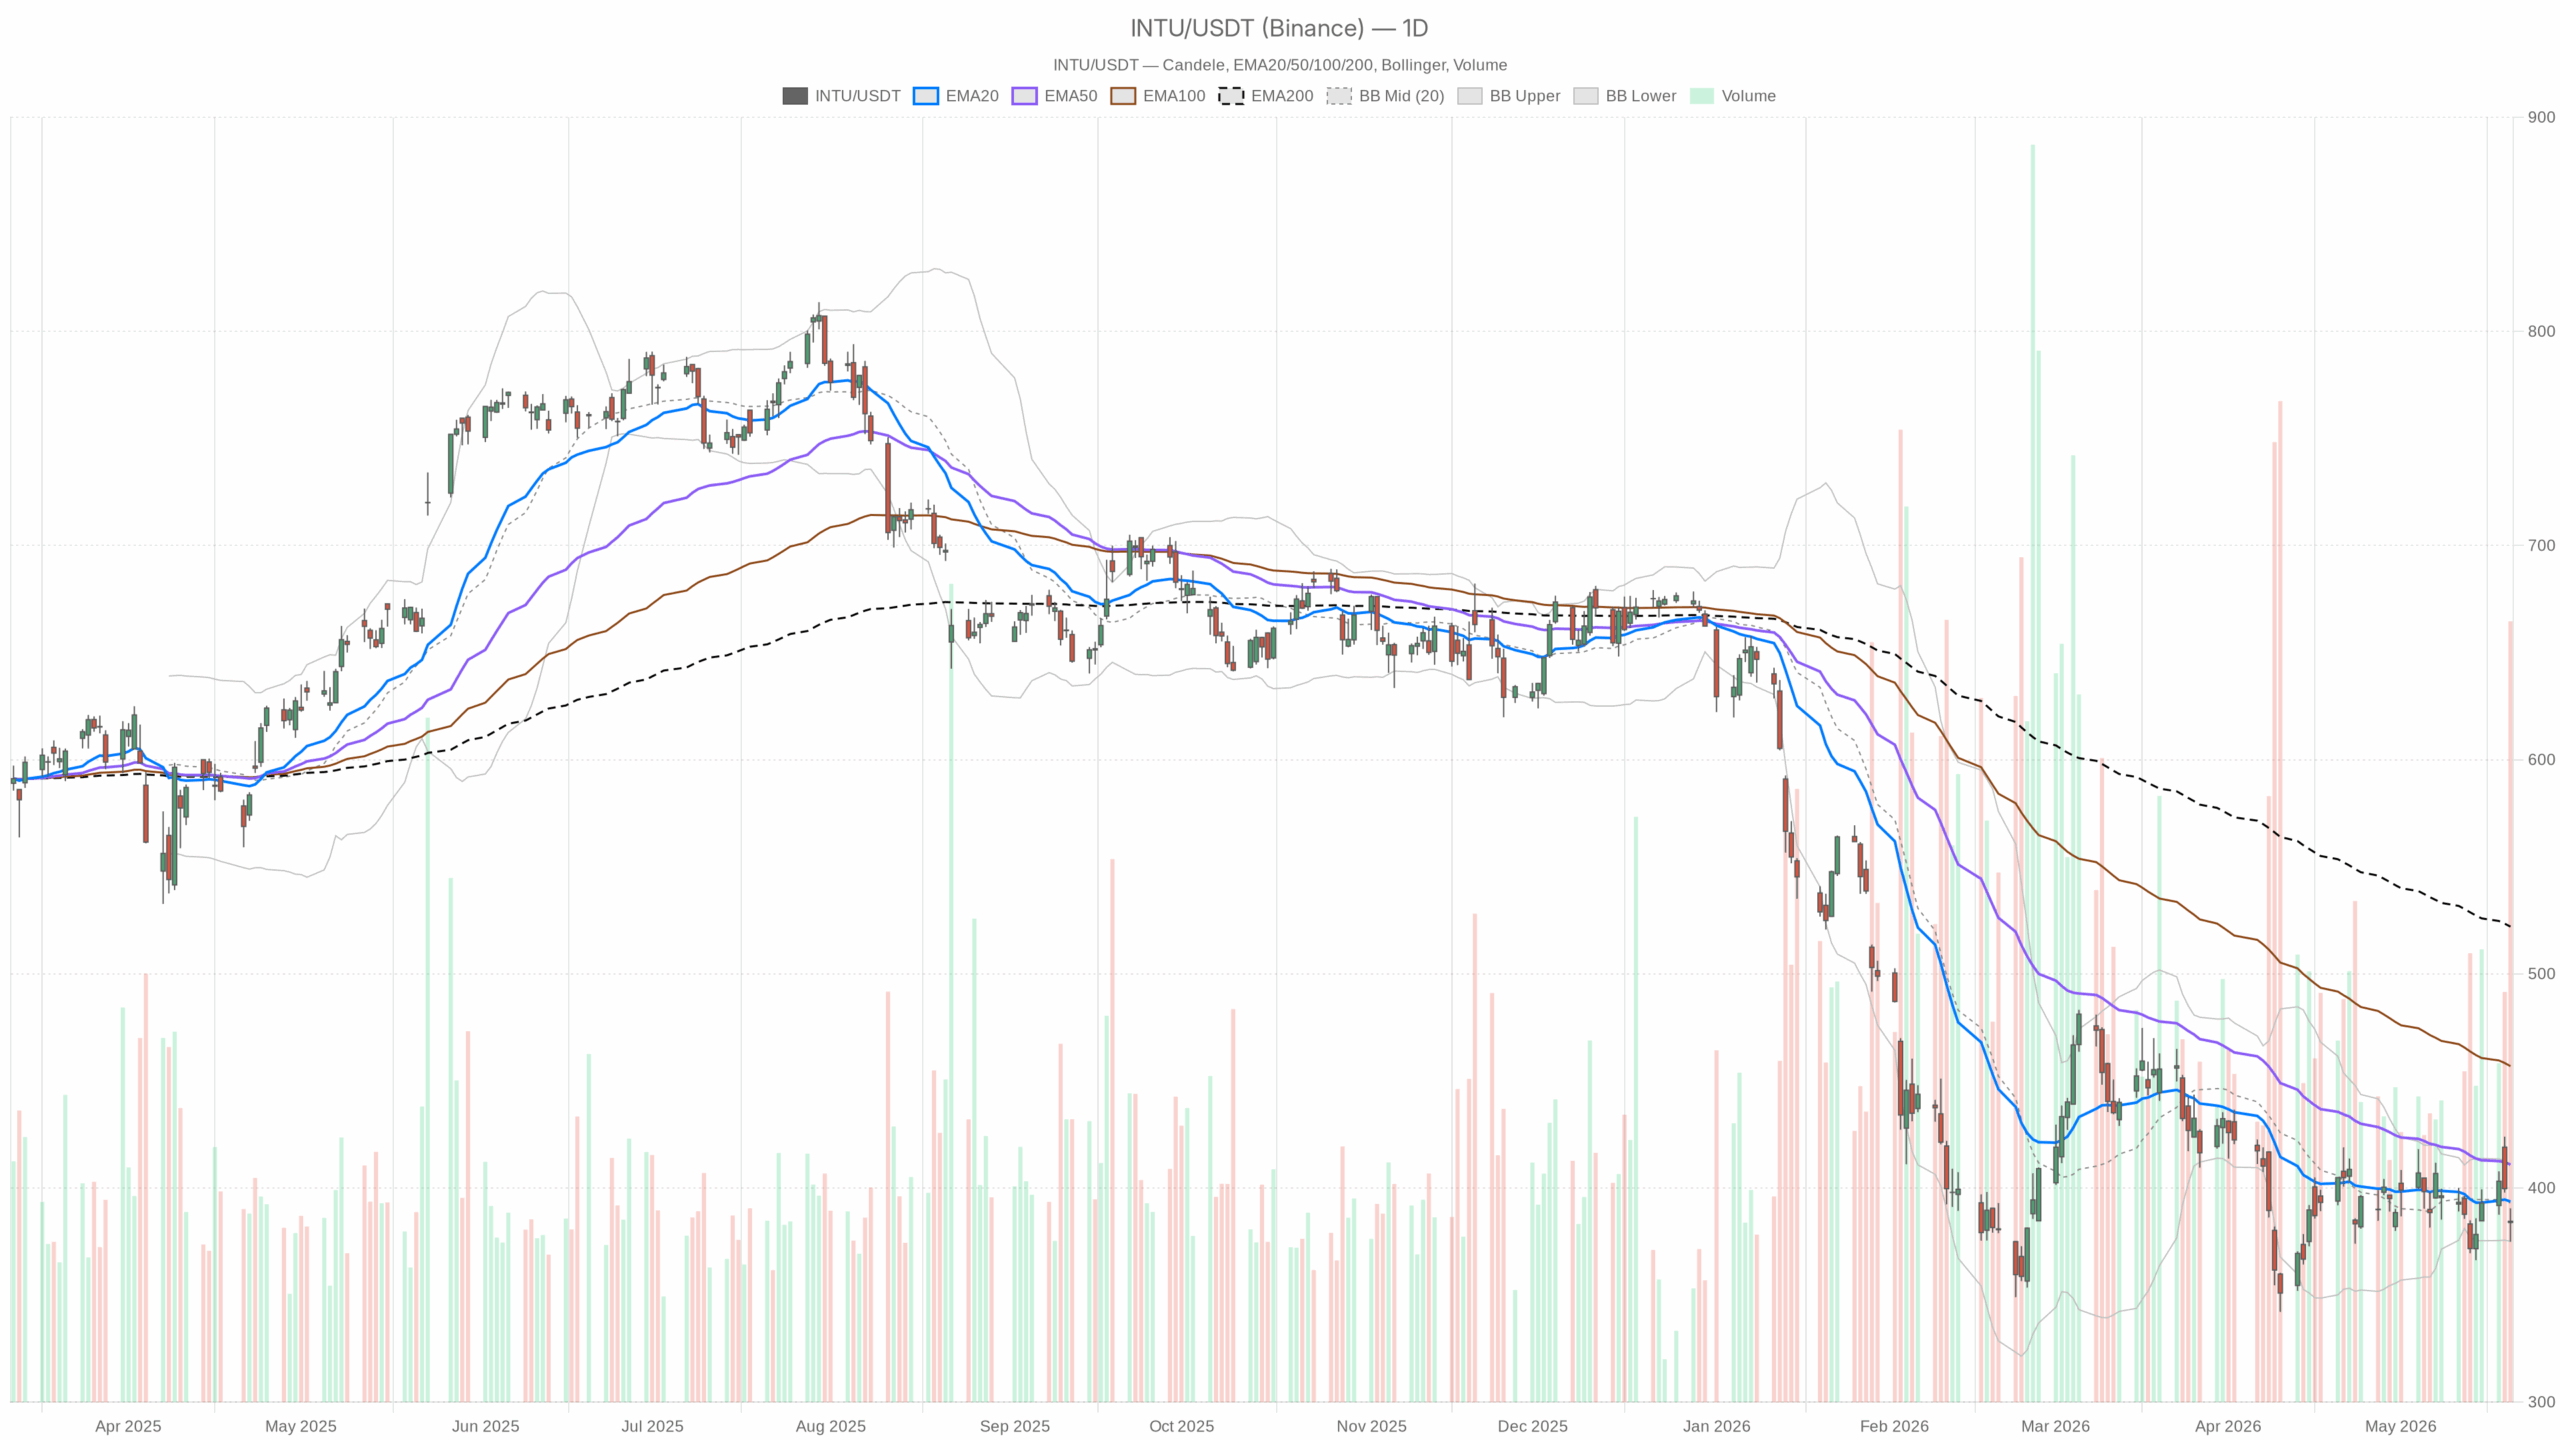 INTU — daily chart with candlesticks, EMA20/EMA50 and volume.
Intuit Stock Daily Technical Overview
Trend and moving averages
On the daily timeframe, INTU closed at 383.93, below the 20-day EMA at 393.62, the 50-day EMA at 410.95, and well under the 200-day EMA at 522.05. Trading beneath all key moving averages keeps the dominant trend down and caps rebounds below 393–411.
Momentum and oscillators
Daily momentum is soft. RSI(14) sits at 45.35, below neutral and lacking bullish follow-through. Meanwhile, the daily MACD shows a line at -3.85 versus a signal at -4.77 with a positive histogram of 0.92. Downside momentum is easing; it has not flipped positive.
Volatility, bands, and pivots
Notably, daily Bollinger Bands center near 393 with an upper band at 410.89 and a lower band at 375.11. Price is operating in the lower half of the envelope, so sellers still hold the initiative around 375–393. ATR(14) is 19.33, highlighting wider swings. The daily pivot stands at 383.11 with R1 at 391.32 and S1 at 375.73. Closing slightly above the pivot tilts toward a bounce attempt; however, R1 near 391 remains a ceiling.
Intuit Stock Intraday: 1‑Hour Chart Confirms Weakness
Structure and EMAs
Meanwhile, the 1-hour chart confirms broader weakness. Price at 384.29 sits below the 20-hour EMA at 392.18, the 50-hour EMA at 392.81, and the 200-hour EMA at 397.85. Intraday trend pressure is lower, and the 392–398 band is overhead supply.
Momentum signals
RSI(14) on H1 is 38.27, keeping momentum weak and skewing risk to further dips without a catalyst. In addition, the H1 MACD line is -2.49 versus a -0.18 signal with a negative histogram of -2.32. Bearish momentum dominates intraday.
Bands, pivots, and volatility
H1 Bollinger Bands center at 396.96 with a lower band at 378.93. Price is pinned in the lower half and can probe 379–383 if sellers press. The H1 pivot is 384.79, R1 is 385.8, and S1 is 383.28. Trading marginally below the pivot keeps pressure on support near 383.3, with 385.8 the first resistance to clear. H1 ATR(14) is 6.61, so hourly ranges are active.
Intuit Stock 15‑Minute Execution Context
Micro‑trend and momentum
At the same time, the 15‑minute chart offers execution context rather than a bias shift. Price at 384.29 is under the 15m EMA20 at 386.41, EMA50 at 391.08, and EMA200 at 392.77. The micro‑trend remains down into resistance. 15m RSI(14) is 38.06, near bounce territory but still weak.
Signals and levels
The 15m MACD shows a line of -2.20 versus a -2.89 signal with a positive histogram of 0.69. A minor intraday rebound is attempting to form against the trend. Meanwhile, Bollinger Bands center at 385 with a tight 383.52–386.49 envelope, and ATR(14) is 1.77. The 15m pivot is 384.72 with R1 at 385.66 and S1 at 383.35. Micro‑bulls need to reclaim 384.7–385.7 to sustain any scalp‑length bounce.
Fundamental Backdrop for Intuit Stock
Fundamentals add nuance. Intuit reported 10% revenue growth and raised full‑year guidance, while also announcing a 17% workforce reduction. The market appears to weigh execution and restructuring risks more than the improved outlook, which aligns with the current technical weakness.
Scenarios for Intuit Stock: Bullish Trigger vs Bearish Continuation
Bullish scenario
A sustained push above 391.32 (daily R1) and, more importantly, a daily close back over the 20‑day EMA and Bollinger mid near 393 would improve the setup. Clearing 391–393 would force shorts to reassess and open room toward 397–398 (H1 200‑EMA) and then the 410–411 zone (daily upper band and 50‑day EMA) if momentum broadens. On H1, a MACD turn higher and RSI back above 50 would confirm the shift.
Bearish scenario
On the other hand, the bearish path stays valid while price fails below 391–393 and loses 383 intraday support. A break of 375.73–375.11 (daily S1 and lower Bollinger) would risk trend acceleration given the 19.33 ATR. Fresh lows would invalidate the bullish recovery case and keep the focus on downside follow‑through.
Intuit Stock Outlook: Bias and Key Levels
Overall, the daily bias is bearish, the 1‑hour chart confirms, and only the 15‑minute shows a tentative bounce attempt. Positioning around 375–393 should respect elevated volatility and the risk of choppy reversals. Until the stock reclaims 391–393 with momentum, sellers retain the edge.


 English (US) ·