
 4 hours ago
10
4 hours ago
10

IonQ, Inc. stock closed at $39.93, down from a $40.95 open, as the company approaches its Q2 earnings release. With a 91.7% Q2 rally, a completed $1.8 billion SkyWater Technology acquisition, and a new Wedbush ‘outperform’ rating, the technical picture and fundamental narrative are pulling in opposite directions.
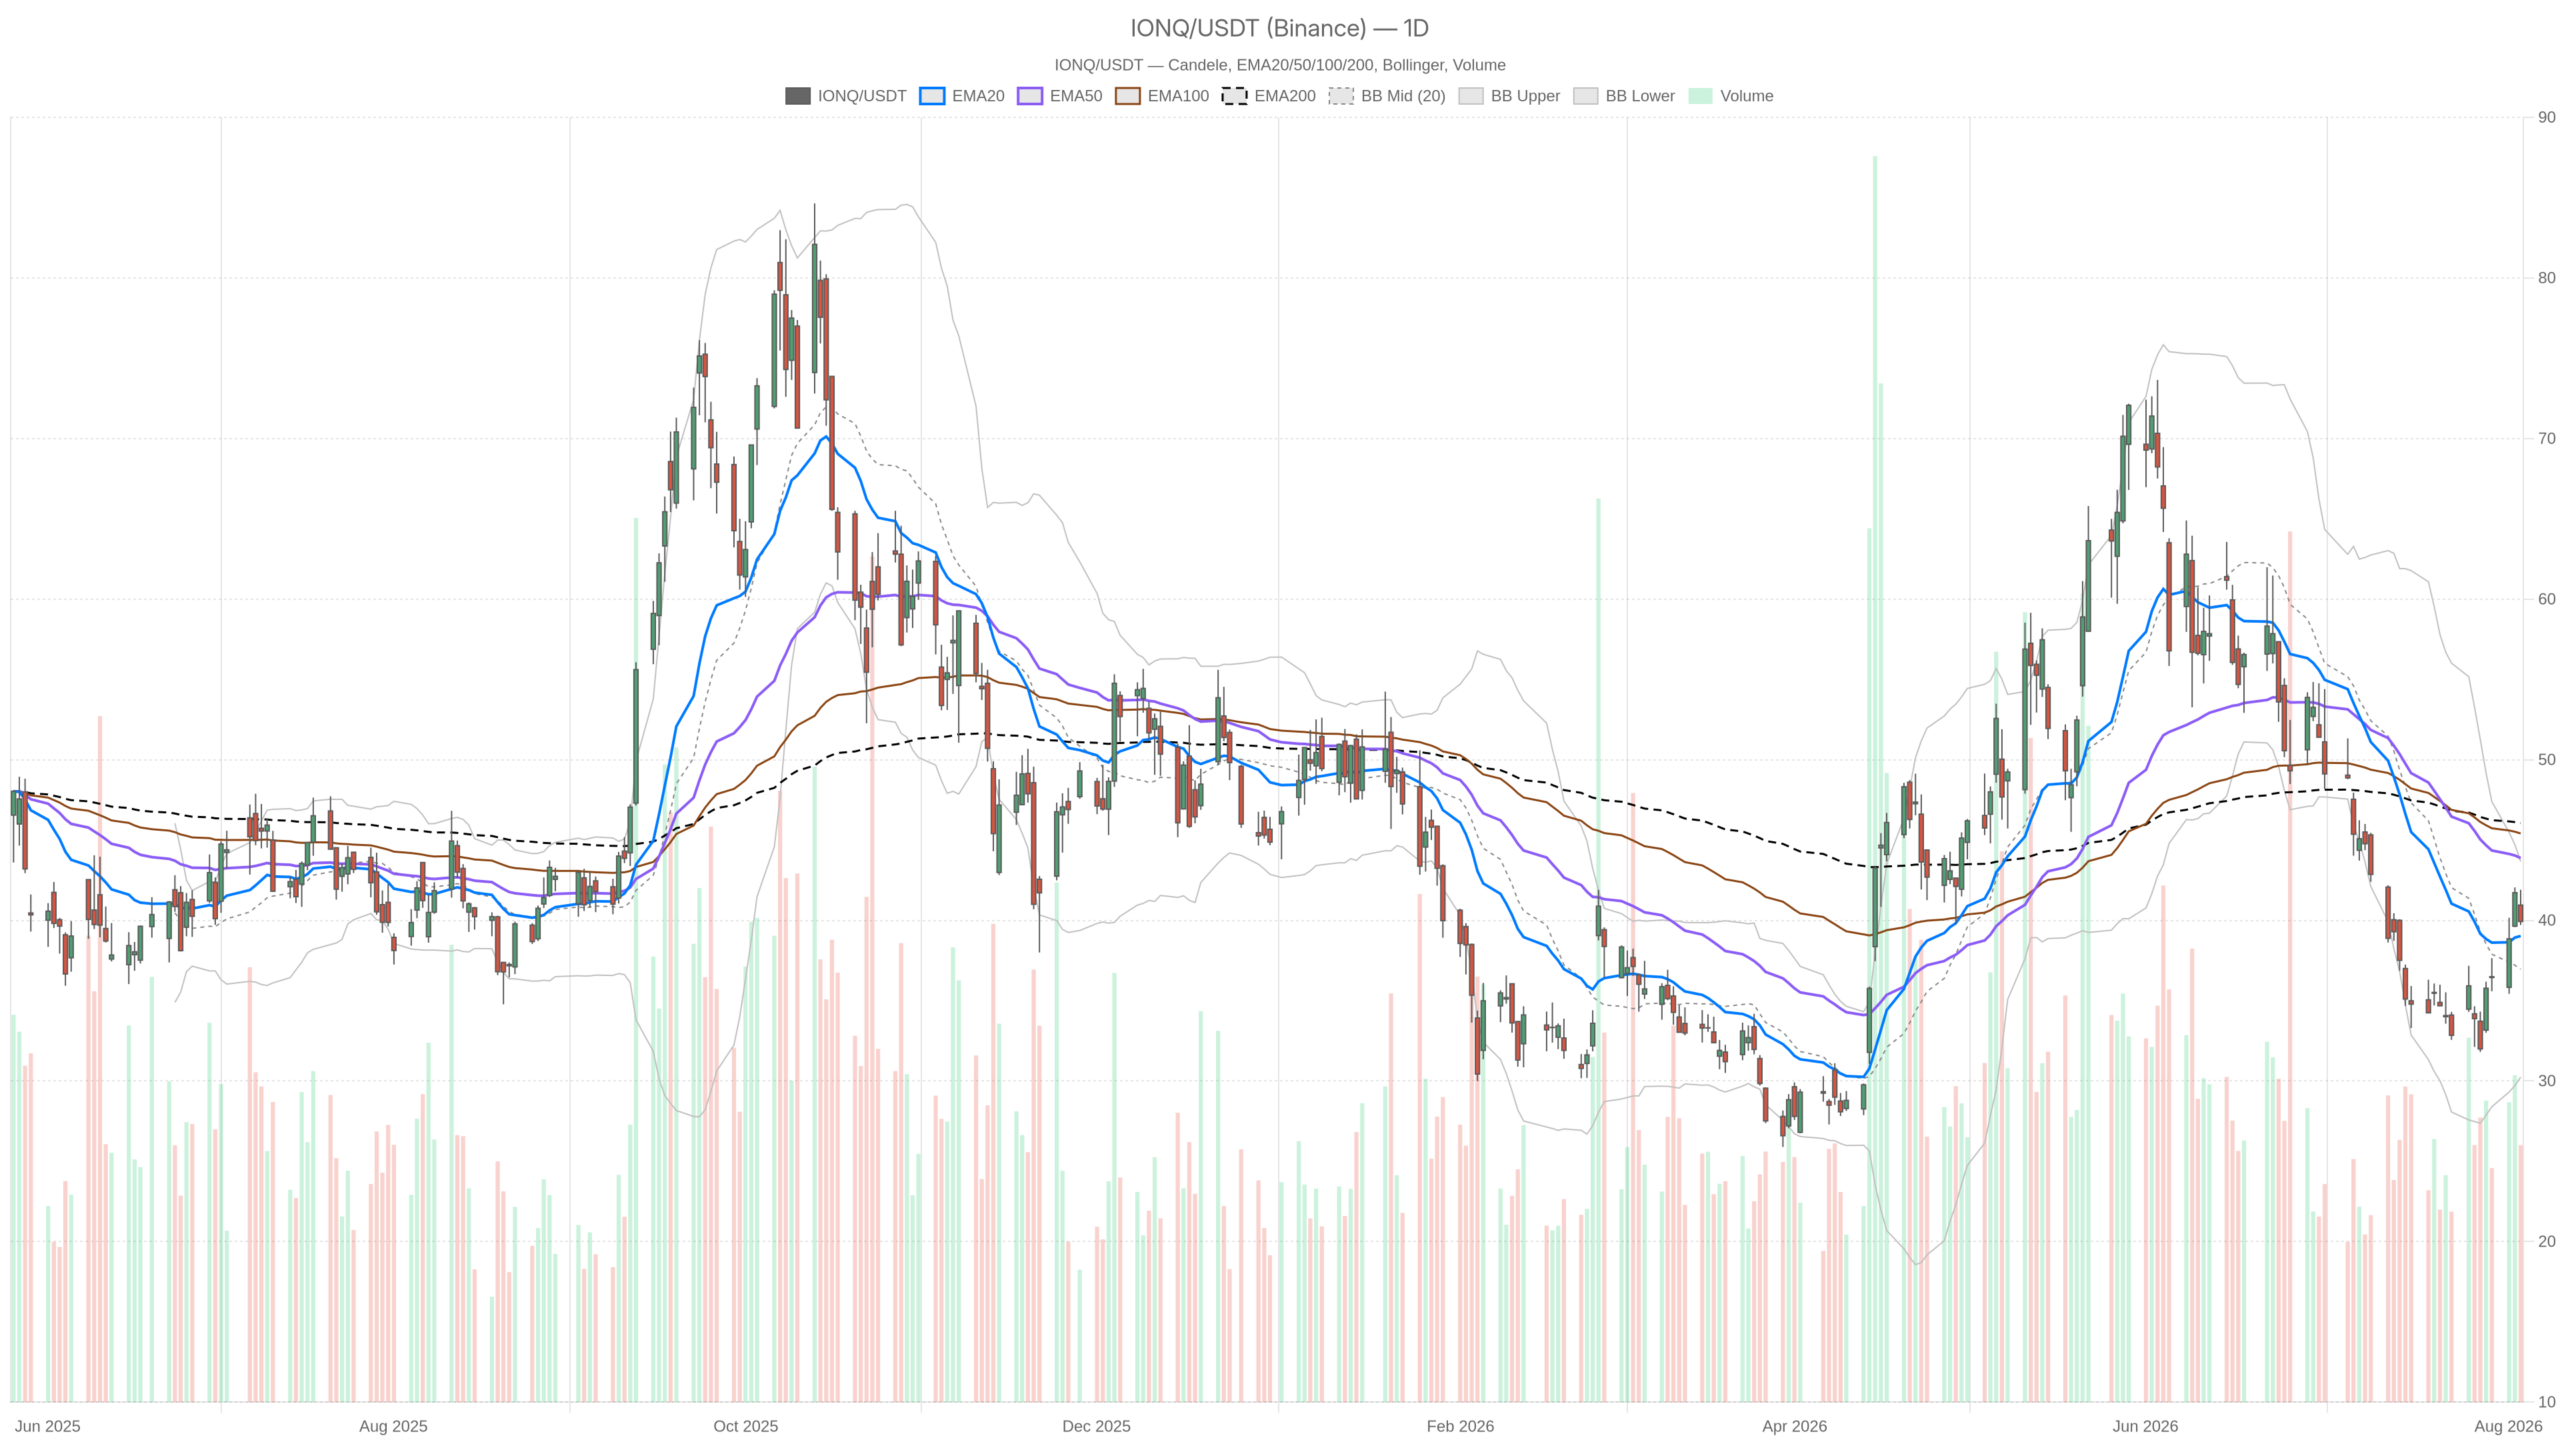 IONQ — daily chart with candlesticks, EMA20/EMA50 and volume.
Key takeaways
- IonQ, Inc. stock closed at $39.93 with daily RSI14 at 48.7, signaling complete technical neutrality ahead of earnings.
- The daily MACD histogram turned positive at 1.34, indicating fading downside momentum despite the broader bearish trend structure.
- Key resistance sits at the daily pivot of 40.51 and r1 at 41.32; key support rests at s1 (39.13) and the Bollinger mid-band near 36.95.
- A daily ATR14 of 2.76 combined with the approaching Q2 earnings release makes a significant volatility expansion highly likely.
- A completed $1.8 billion SkyWater Technology acquisition and a Wedbush ‘outperform’ rating provide fundamental catalysts that clash with the technically neutral setup.
Daily Chart: Neutral Momentum Holds Ahead of IonQ, Inc. Stock Earnings
IonQ, Inc. stock displays a neutral daily structure, with price consolidating below key moving averages as momentum signals begin to show early signs of recovery.
On the daily chart, the trend structure leans cautious. Price sits below both the EMA50 (43.88) and EMA200 (46.06), but it is holding just above the EMA20 (39.02). That configuration points to a market that has pulled back from a longer-term uptrend. It is now consolidating rather than trending cleanly in either direction. The daily RSI14 at 48.7 confirms this neutrality — it is neither overbought nor oversold, sitting almost exactly at the midpoint.
MACD Signals Fading Downside Pressure
The daily MACD tells a more nuanced story. The MACD line is at -2.69, still below the signal line at -4.03, which technically keeps the broader momentum bias negative. However, the histogram has turned positive at 1.34, meaning the gap between the two lines is narrowing. In practical terms, downside momentum is fading even though the trend itself has not flipped bullish yet. That is an early-stage signal, not a confirmed reversal.
Bollinger Bands and Volatility Context
Meanwhile, Bollinger Bands on the daily timeframe add useful context. Price is trading between the mid-band (36.95) and the upper band (43.67), closer to the mid-to-upper zone. That placement suggests the stock has room to expand higher without immediately testing overbought volatility extremes. The ATR14 reading of 2.76 confirms that daily ranges remain wide. This matters heavily given the earnings event sitting directly in the market’s path.
H1 Timeframe: A Mild Bullish Tilt That Complicates the Daily Picture
The H1 timeframe reveals a mild bullish tilt that complicates the neutral daily picture, with conflicting momentum signals pointing to indecision rather than directional commitment.
Zooming into the 1-hour chart, the tone shifts slightly. Price at 39.92 is trading above the EMA50 (38.17) but below the EMA200 (41.70). RSI14 has climbed to 54.02 — a mildly bullish reading compared to the daily’s flat 48.7. On the surface, this suggests short-term buyers have been active.
However, the H1 MACD introduces a genuine conflict. The MACD line at 0.98 has dropped below the signal line at 1.28, producing a negative histogram of -0.30. In other words, hourly momentum is losing steam even as price holds above short-term moving averages. This is a classic case of timeframes disagreeing: the daily histogram is improving while the hourly histogram is deteriorating. That divergence signals indecision rather than a clean handoff of bullish control from one timeframe to the next.
The H1 Bollinger setup reinforces this cautious read. Price at 39.92 sits below the mid-band of 40.53, leaning toward the lower half of the range. Pivot levels add further detail: the H1 pivot point is 40.21, with price currently trading beneath it, and support sitting at 39.61. Overall, the hourly structure looks like a market pausing for breath rather than committing to a direction.
15-Minute Chart Signals Tight Consolidation Before the Catalyst
The 15-minute chart points to tight, low-volatility consolidation as IonQ, Inc. stock coils ahead of a likely volatility expansion triggered by the upcoming earnings release.
At the same time, the 15-minute chart is purely about short-term timing here, not directional bias. RSI14 has dropped to 37.39, approaching oversold territory, while the MACD histogram sits slightly negative at -0.05. Price at 39.92 is trading below both the EMA20 (40.54) and EMA50 (40.42), though still above the EMA200 (37.89). Combined with a compressed ATR14 of just 0.31, this points to tight consolidation right at the lower edge of the 15m Bollinger range (40.09–40.97). In short, the market is coiling ahead of a likely volatility expansion once earnings hit.
Bullish Scenario for IonQ, Inc. Stock
A bullish reversal for IonQ, Inc. stock requires reclaiming the daily pivot at 40.51 and breaking through r1 at 41.32, supported by a continued improvement in the daily MACD histogram.
For the bulls, price would need to reclaim the daily pivot at 40.51 and push through r1 at 41.32. If the improving daily MACD histogram continues to narrow toward a bullish crossover, that would be the first step. And if RSI14 breaks decisively above 50, it would align the daily and hourly timeframes for the first time in this setup.
The fundamental backdrop supports this possibility. Retail interest in quantum computing names remains resilient despite sector-wide underperformance in 2026. Meanwhile, the Wedbush ‘outperform’ rating alongside the completed $1.8 billion SkyWater Technology acquisition gives bulls a tangible catalyst. A strong Q2 earnings print that validates revenue growth against the stock’s premium valuation could be the trigger. It would finally align momentum across all three timeframes.
Bearish Scenario and Invalidation Levels
The bearish case hinges on the daily s1 support at 39.13, with a breakdown on elevated volume opening the path toward the Bollinger mid-band near 36.95 and eventually the lower band at 30.24.
On the other hand, the bearish case centers on the daily s1 support at 39.13. A clean break below that level, especially on elevated volume, would open the door toward the daily Bollinger mid-band near 36.95. Eventually, it could reach the lower band at 30.24. Price remains well below both the EMA50 and EMA200 on the daily chart. This serves as a reminder that the broader trend has not yet turned constructive.
If Q2 earnings disappoint against the backdrop of valuation concerns already flagged in recent coverage, the outcome could be severe. The fading hourly MACD momentum could accelerate into a deeper pullback rather than a shallow retracement. Losing the H1 support at 39.61 would be an early warning sign that sellers are regaining control.
Closing Note
IonQ, Inc. stock sits at a genuine inflection point, with all three timeframes pointing to indecision rather than directional commitment ahead of the earnings catalyst.
Overall, IonQ, Inc. stock is sitting at a genuine inflection point. The daily timeframe shows a neutral-to-improving momentum picture. The hourly chart shows early signs of fatigue within a mild bullish tilt. Meanwhile, the 15-minute chart reflects tight consolidation ahead of a known catalyst. Given the daily ATR14 of 2.76 and an earnings event on deck, volatility expansion looks highly likely regardless of direction.
Positioning around key levels — 40.51 and 41.32 on the upside, 39.13 on the downside — will matter more than usual in the sessions immediately following the earnings report. Uncertainty should be treated as the base case until price commits clearly to one side.
FAQ
What is the current technical outlook for IonQ, Inc. stock?
IonQ, Inc. stock is in a neutral technical setup. The daily RSI14 sits at 48.7, the MACD remains below its signal line, and price trades below both the EMA50 (43.88) and EMA200 (46.06). However, the MACD histogram has turned positive at 1.34, suggesting downside momentum is starting to fade.
What are the key levels to watch for IONQ?
Key resistance levels are the daily pivot at 40.51 and r1 at 41.32. On the downside, immediate support sits at the daily s1 level of 39.13, with the Bollinger mid-band at 36.95 as the next significant floor. A break below s1 on elevated volume could open the path toward the lower Bollinger band near 30.24.
How could the Q2 earnings report affect IonQ, Inc. stock?
With a daily ATR14 of 2.76, volatility expansion is highly likely after the earnings release. A strong report could trigger a bullish MACD crossover and push price above key resistance levels toward r1 at 41.32. A disappointing report could accelerate selling toward the Bollinger lower band near 30.24, especially given that price already trades below both the EMA50 and EMA200.
Disclaimer: This article is for informational purposes only and does not constitute financial advice, an investment recommendation, or a solicitation to buy or sell any financial instrument or cryptocurrency. The analysis provided is not indicative of future results. Investing in crypto assets and financial markets carries a high risk of capital loss. Always do your own research (DYOR) and consult a qualified financial advisor before making any decision.
Article produced with the assistance of artificial intelligence and reviewed by the editorial team.







 English (US) ·