
 3 months ago
54
3 months ago
54
Bitcoin (BTC) price has dropped roughly 9% since briefly touching $72,000 on March 25, erasing all 30-day gains and entering negative territory at -2.6% over the month. It is currently trading flat over the past 24 hours near $66,900.
The decline produced a bearish breakdown of a pattern on the 12-hour chart. However, a hidden bullish divergence suggests a short-term bounce is possible. Whether that bounce has enough fuel to clear the overhead supply depends on the on-chain data.
Head and Shoulders Breaks Down on the 12-Hour Chart
The 12-hour BTC price chart shows a head and shoulders pattern that has been developing since late February. The neckline sat near $67,700, and the breakdown happened on March 27.
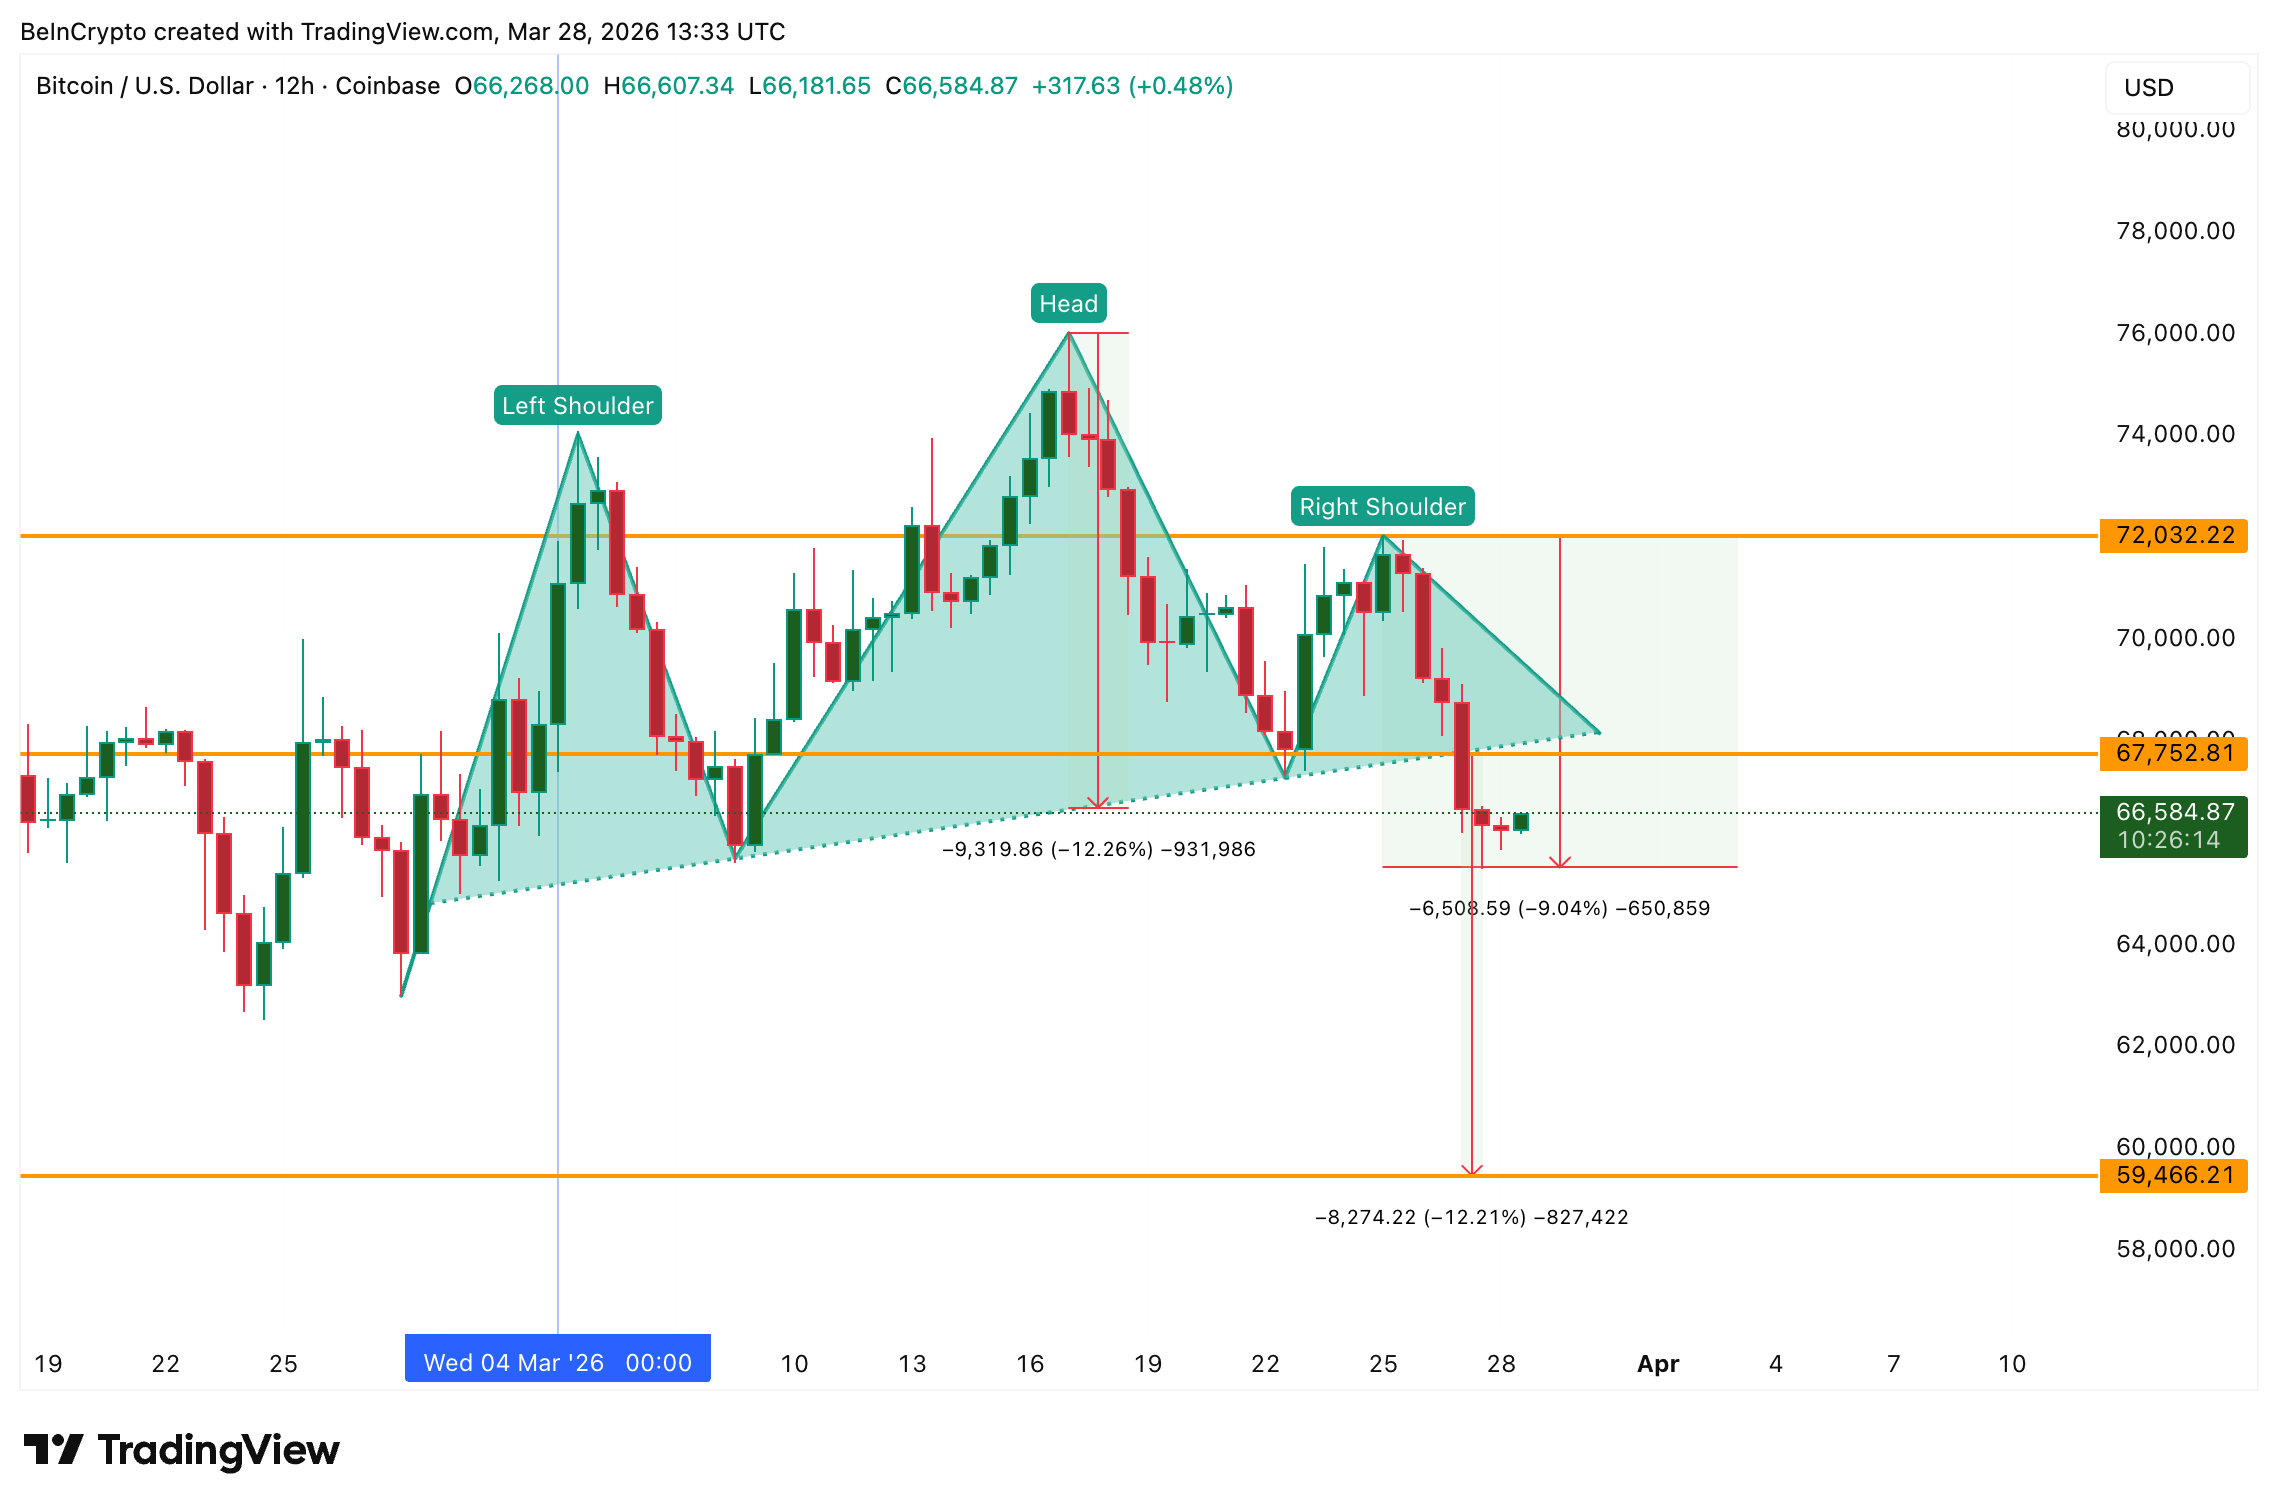 BTC Head and Shoulders Breakdown: TradingView
Want more token insights like this? Sign up for Editor Harsh Notariya’s Daily Crypto Newsletter here.
On paper, the pattern’s measured move points to a 12% correction from the neckline. If realized, that would push Bitcoin price below the $60,000 psychological mark, targeting the $59,400 zone.
However, the Relative Strength Index (RSI), a momentum oscillator, offers a counter-reading. Between February 28 and March 27, the price formed a higher low while the RSI formed a lower low.
That hidden bullish divergence, which typically hints at trend continuation rather than reversal, has already produced a 1.87% bounce from the recent low.
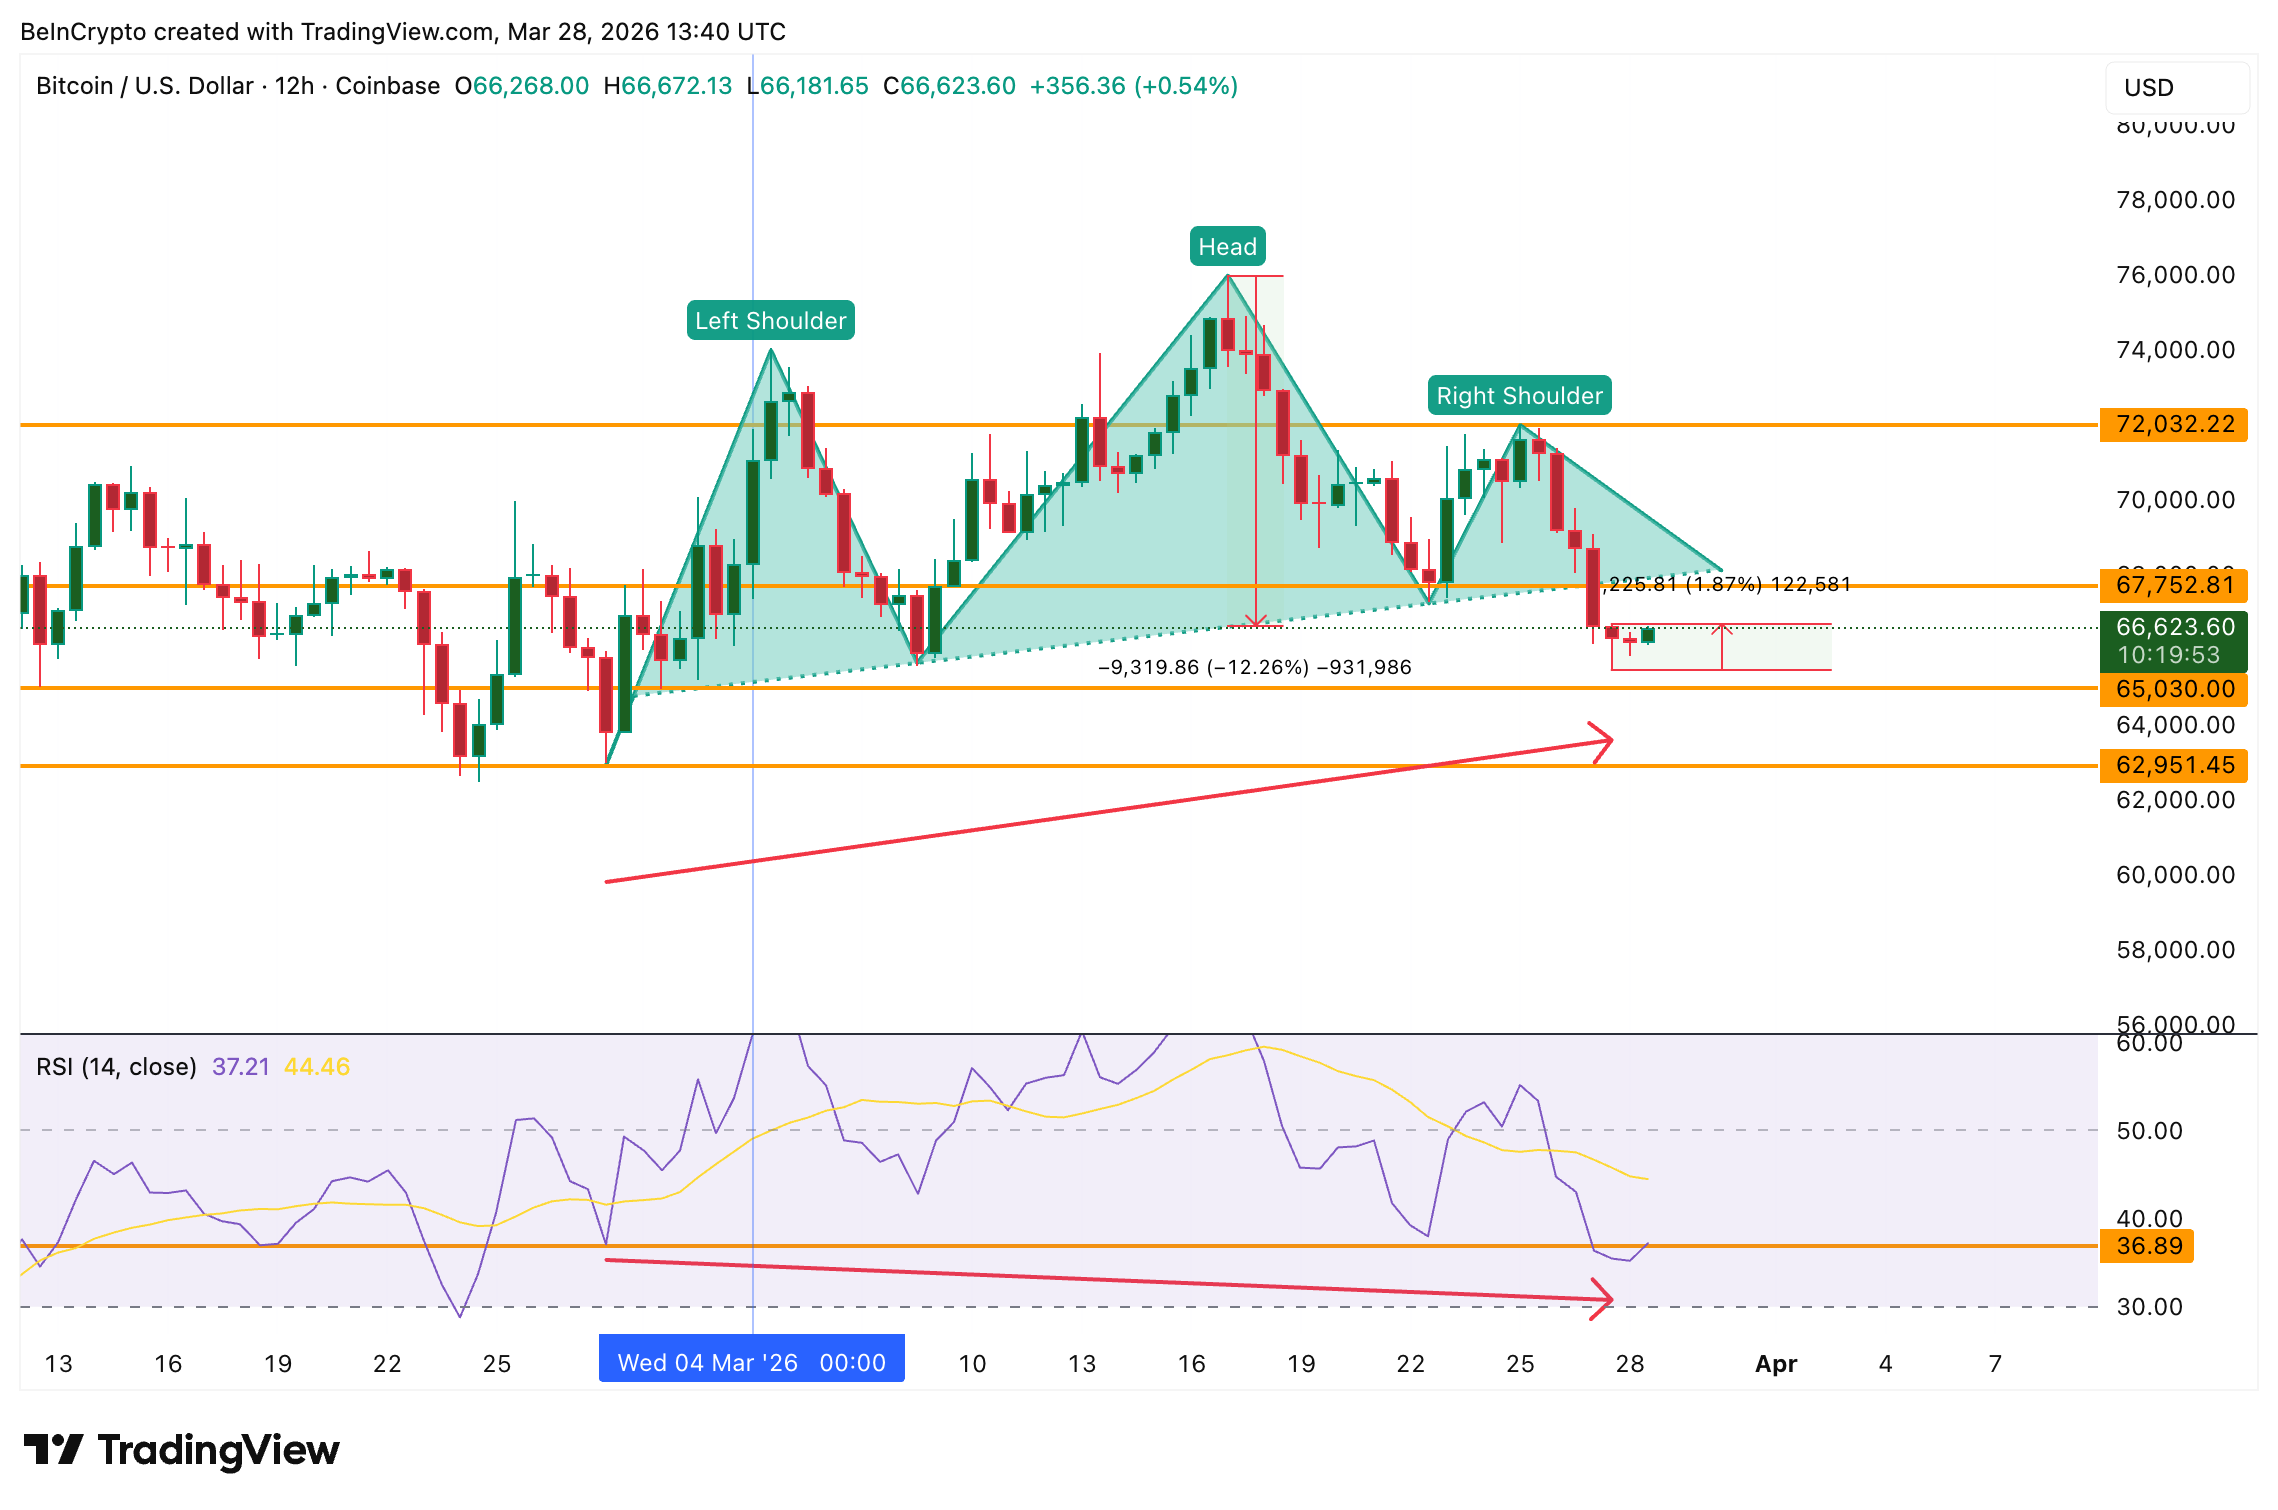 RSI Hidden Bullish Divergence: TradingView
The divergence suggests the floor near $65,000 may hold temporarily. However, the bounce faces a wall of supply directly overhead, and the whales who would normally push through it are not providing enough conviction.
Over 6% of Supply Sits Between $66,900 and $69,400
The UTXO Realized Price Distribution (URPD), a Glassnode metric that maps the price at which Bitcoin’s current supply was last transacted, reveals three dense clusters directly above the current price.
At $66,900 (close to the current price), roughly 2.37% of the total supply last changed hands. At $68,100, another 1.96% sits. And at $69,400, a further 1.96%. Combined, approximately 6.29% of the BTC supply is concentrated in a $2,500 range just above where Bitcoin trades now.
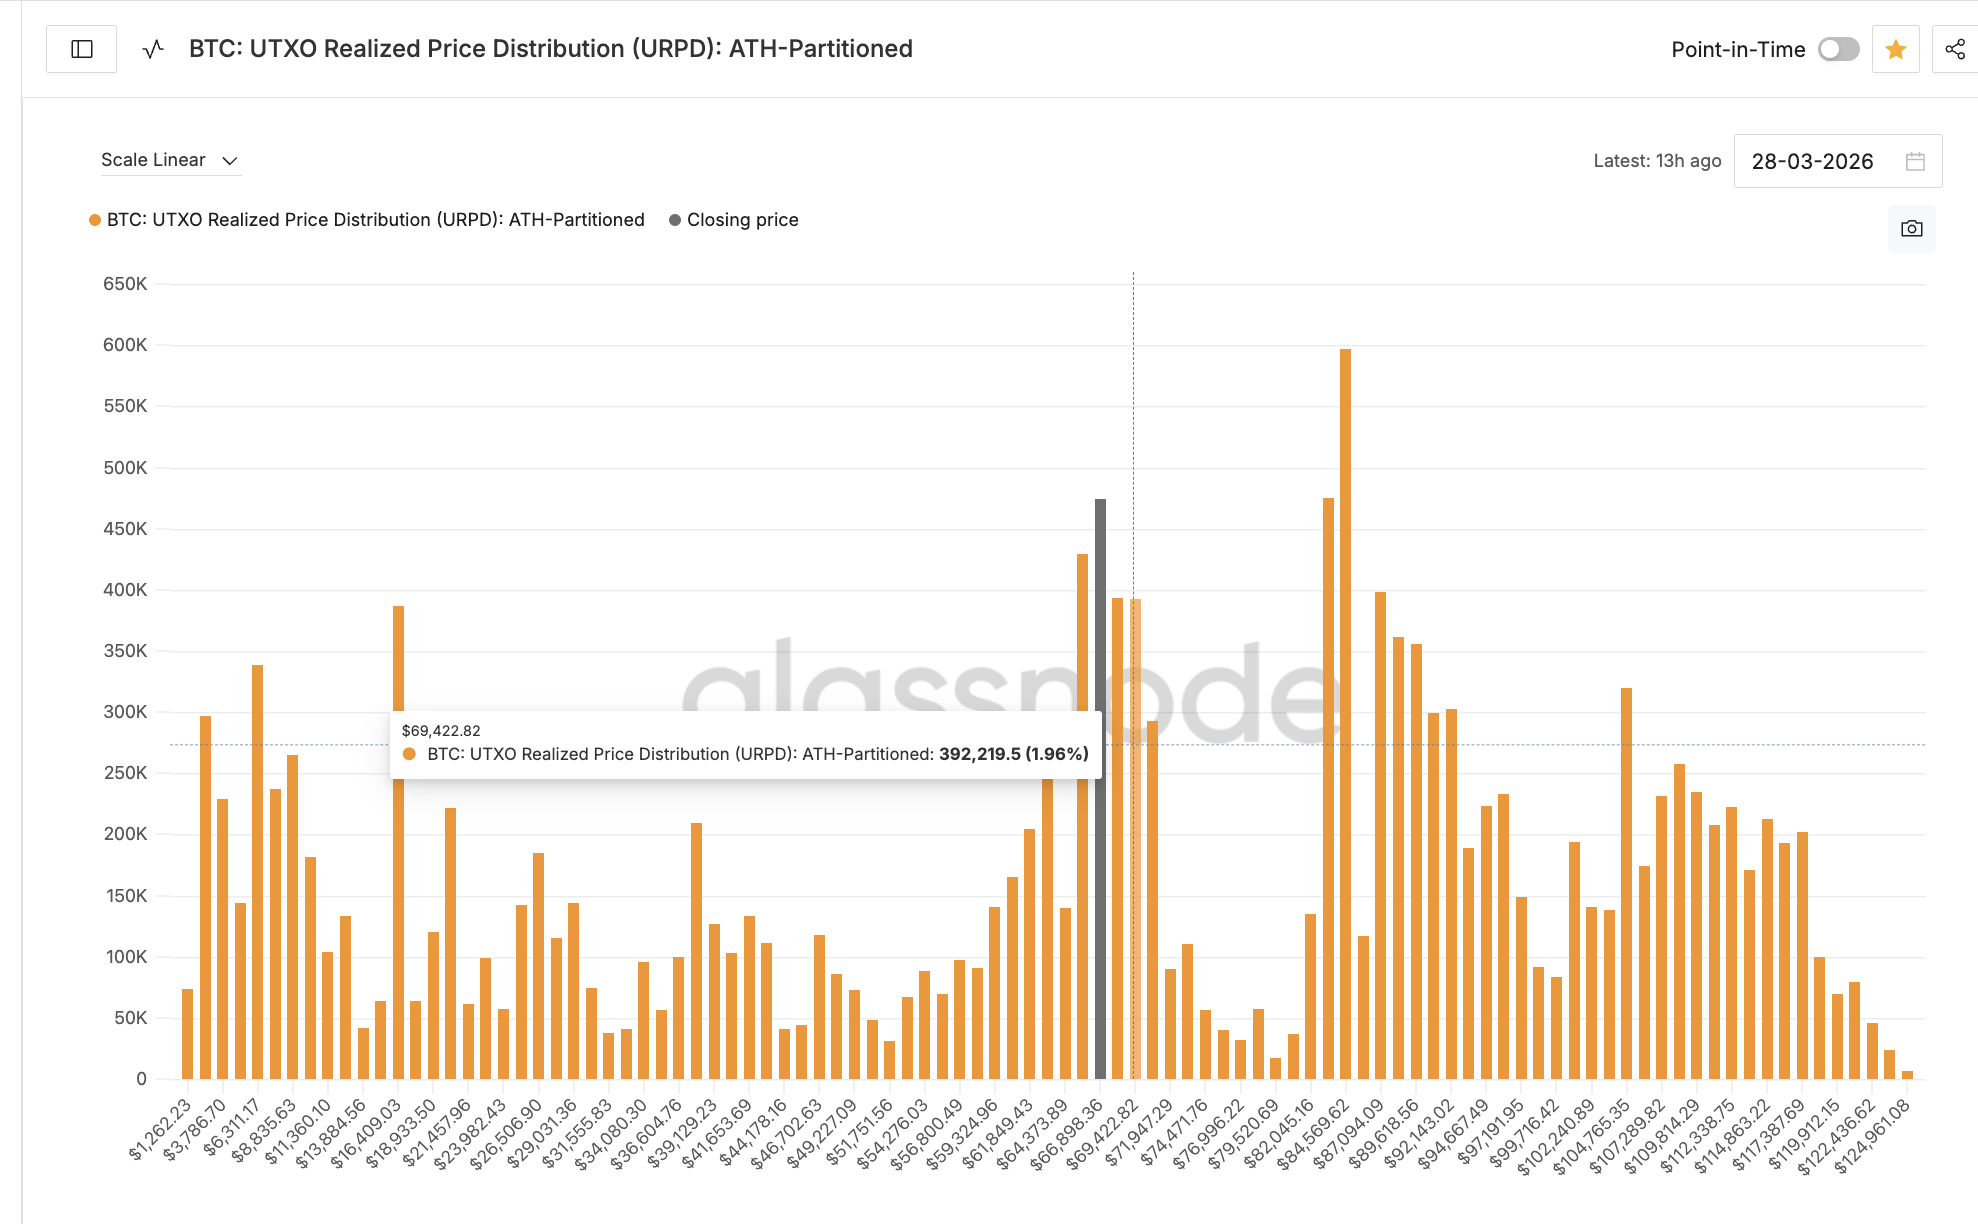 BTC UTXO Realized Price Distribution: Glassnode
These clusters act as resistance because holders who bought at those prices and are currently sitting near breakeven tend to sell into any bounce to exit at minimal loss.
Whale behavior confirms how alarming these Bitcoin supply zones are currently. The largest cohort holding between 100,000 and 1 million BTC reduced their stash from 675,200 to 670,000 on March 24, a 5,200 BTC drop.
The mid-tier cohort (10,000 to 100,000) dipped and recovered, ending roughly flat at 2.25 million. Only the smallest whale tier (1,000 to 10,000) added marginally, rising from 4.21 million to 4.22 million.
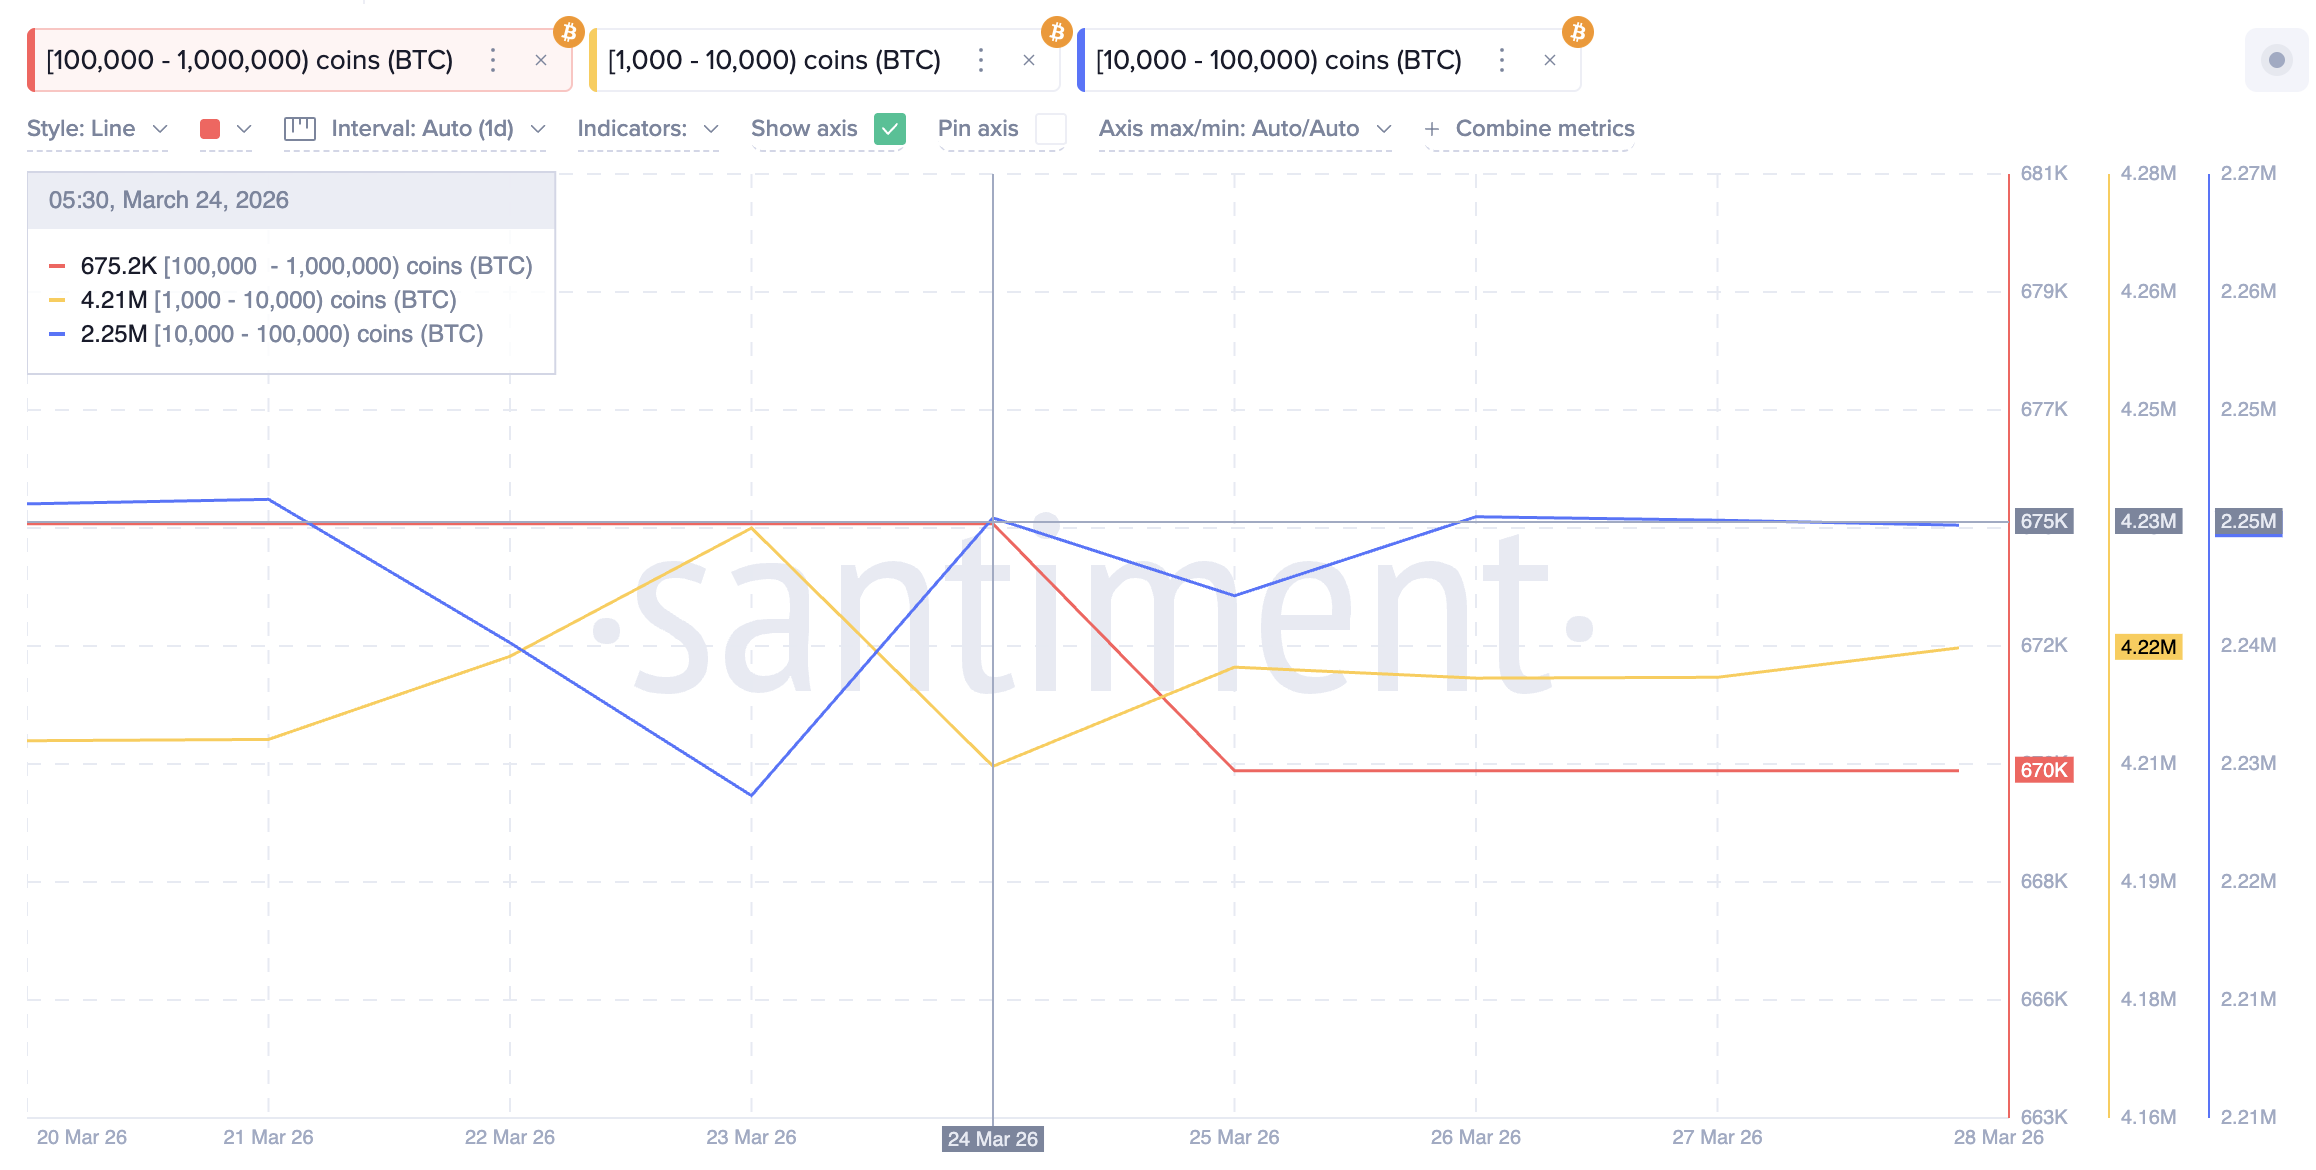 BTC Whale Cohort Balances: Santiment
The net effect across all three cohorts is a marginal addition of roughly 4,800 BTC. However, the conviction picture is weaker than that number suggests.
The biggest wallets, which carry the most market-moving weight, reduced exposure by 5,200 BTC. The smallest tier’s 10,000 BTC addition does not offset that in terms of directional influence, because large-holder distribution historically precedes further weakness, while smaller-tier accumulation often reflects dip-buying that gets absorbed by overhead supply.
That means any bounce from the hidden bullish divergence is likely to stall within the $66,900 to $69,400 range (the supply warning we highlighted earlier).
Bitcoin Price Forecast and the $66,600 Line
The most immediate deciding level for Bitcoin is $66,600. Holding above it means the immediate supply cluster has not yet triggered mass selling, yet. A bounce from here could push toward $68,700 and the $70,000 psychological level.
However, $70,000 would require clearing all three supply clusters. Given the weak whale conviction, any bounce under $70,000 remains at risk of another sell wave. The bearish structure only weakens above $72,000, the right shoulder high.
On the downside, losing $66,600 opens the path to $65,200 and $63,300. Below that, the head-and-shoulders measured move of roughly 12% targets the $59,400 zone, pushing Bitcoin below $60,000 for the first time since the February lows.
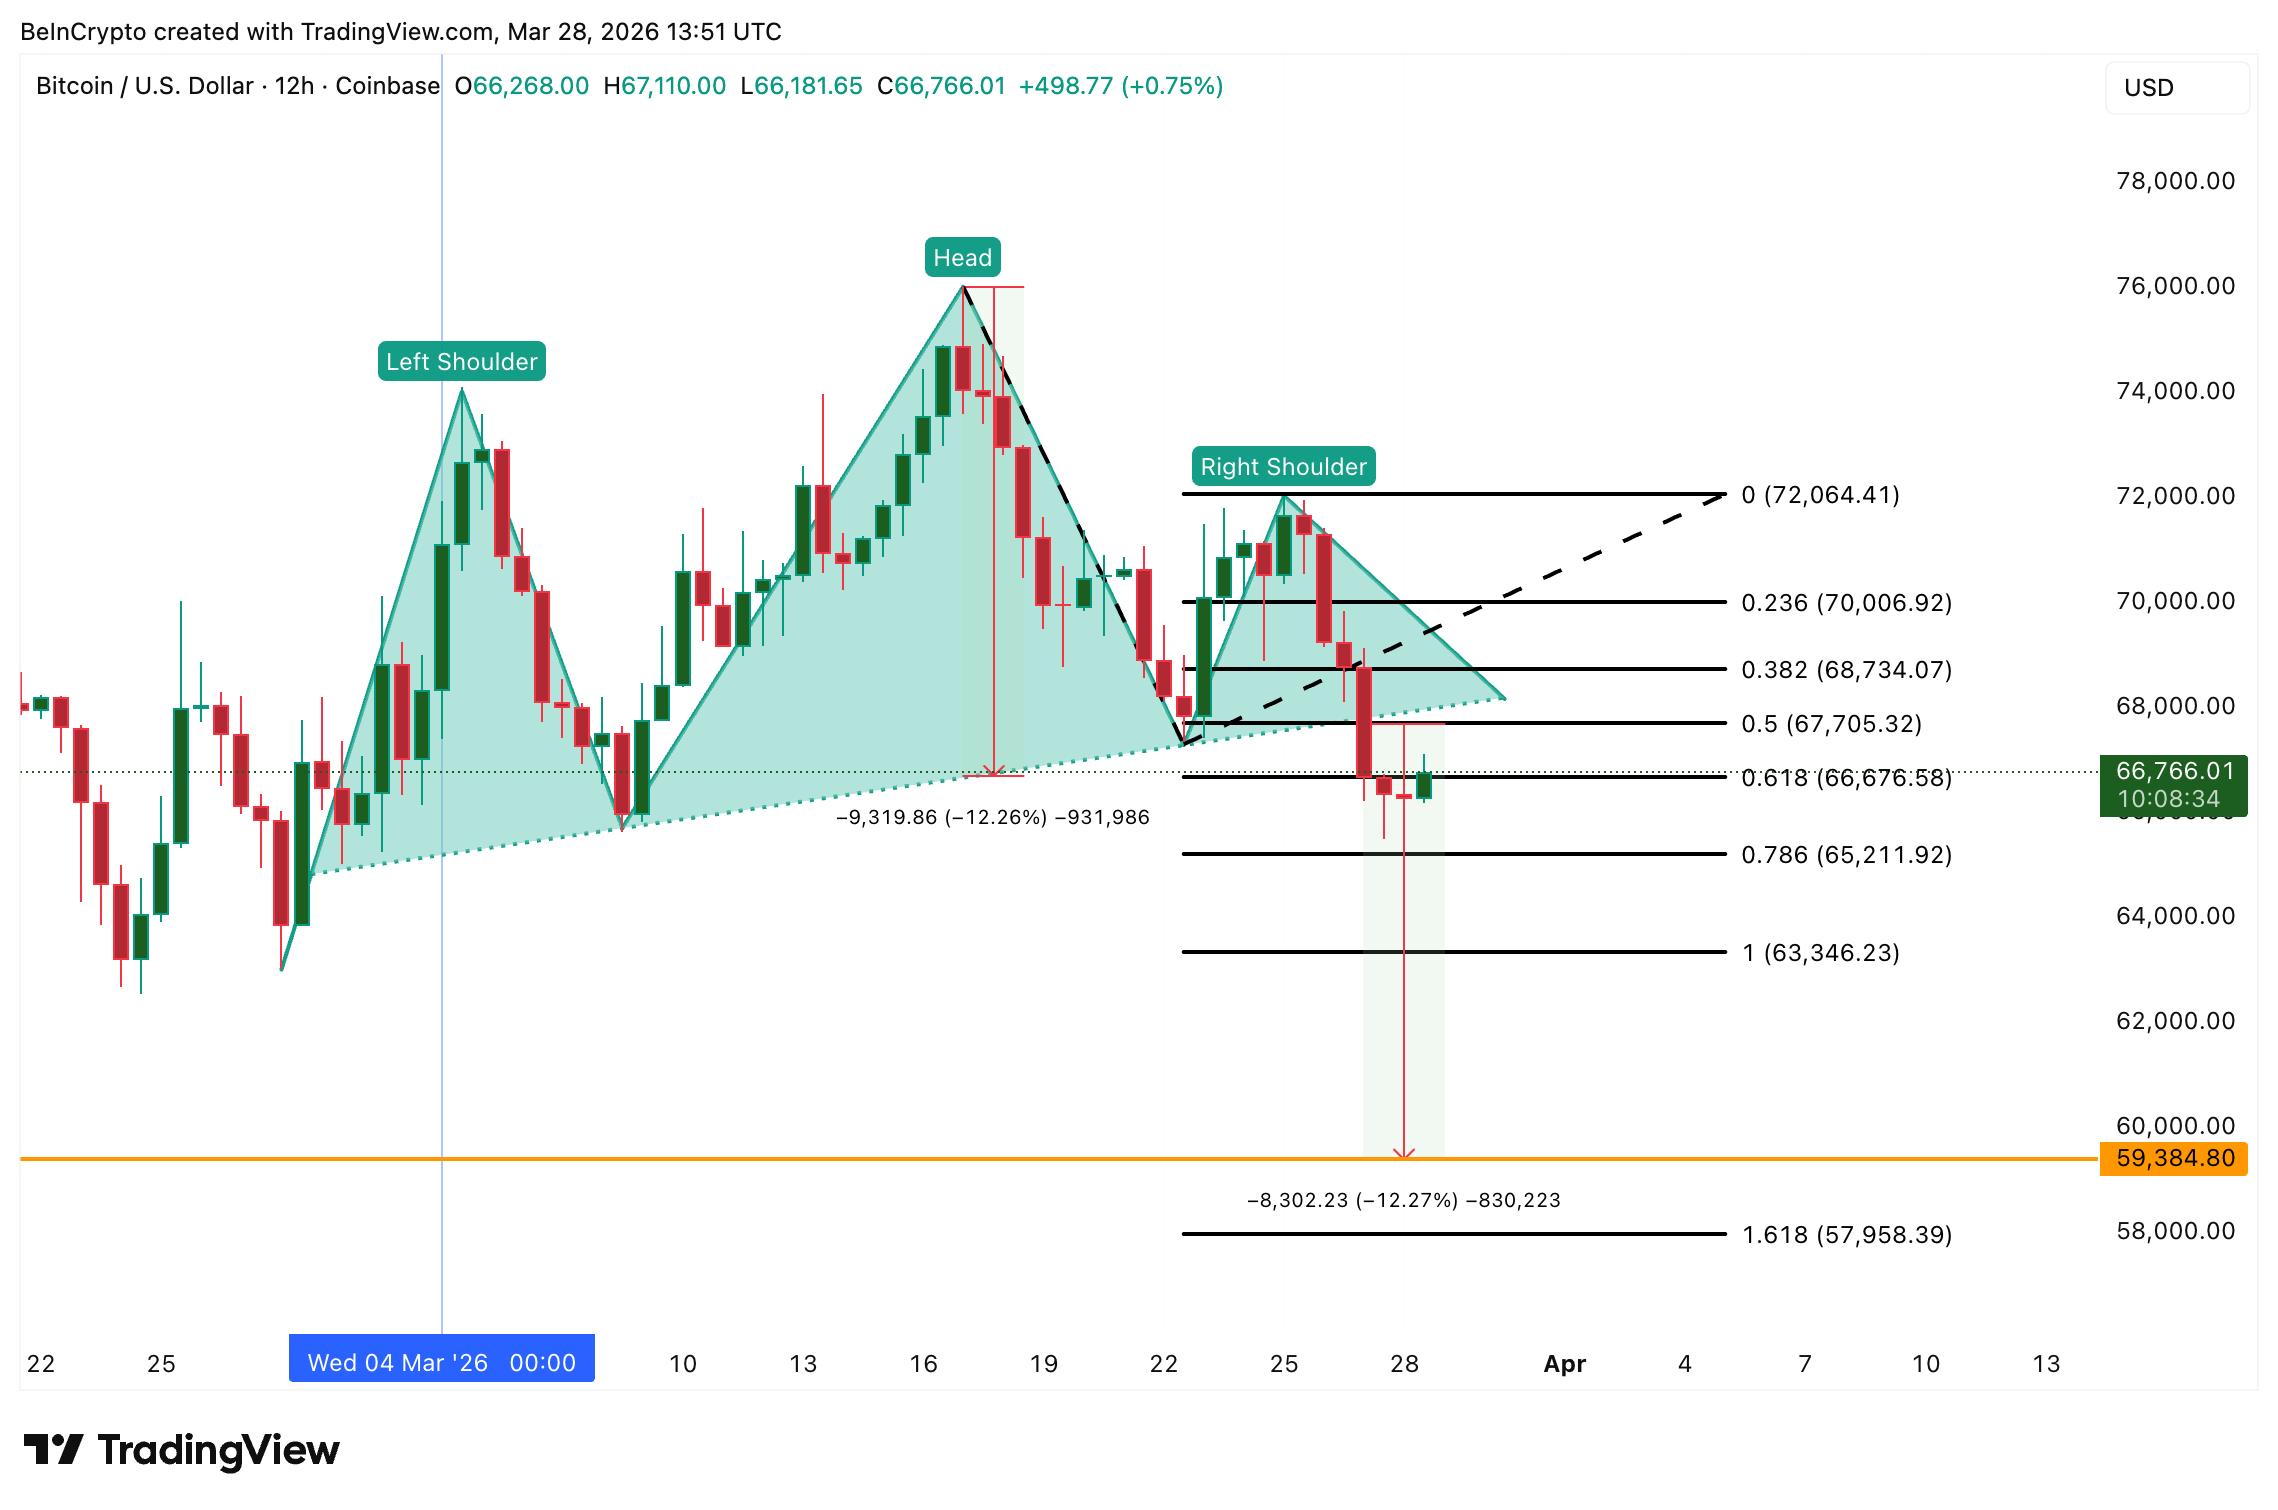 Bitcoin Price Analysis: TradingView
For now, $66,600 separates a shallow bounce toward $69,400 from a measured move breakdown below $60,000.
The post Is Bitcoin Price Finally Heading Below $60,000? Here’s What Technical Charts Show appeared first on BeInCrypto.


 English (US) ·