
 4 hours ago
10
4 hours ago
10

JD.com, Inc. stock sits at a crossroads. The daily chart leans bearish, with price below every major moving average. Yet Michael Burry has exited Alibaba and built a large JD.com stake on valuation grounds. That collision — weak technicals versus a high-profile bullish catalyst — makes this setup worth examining.
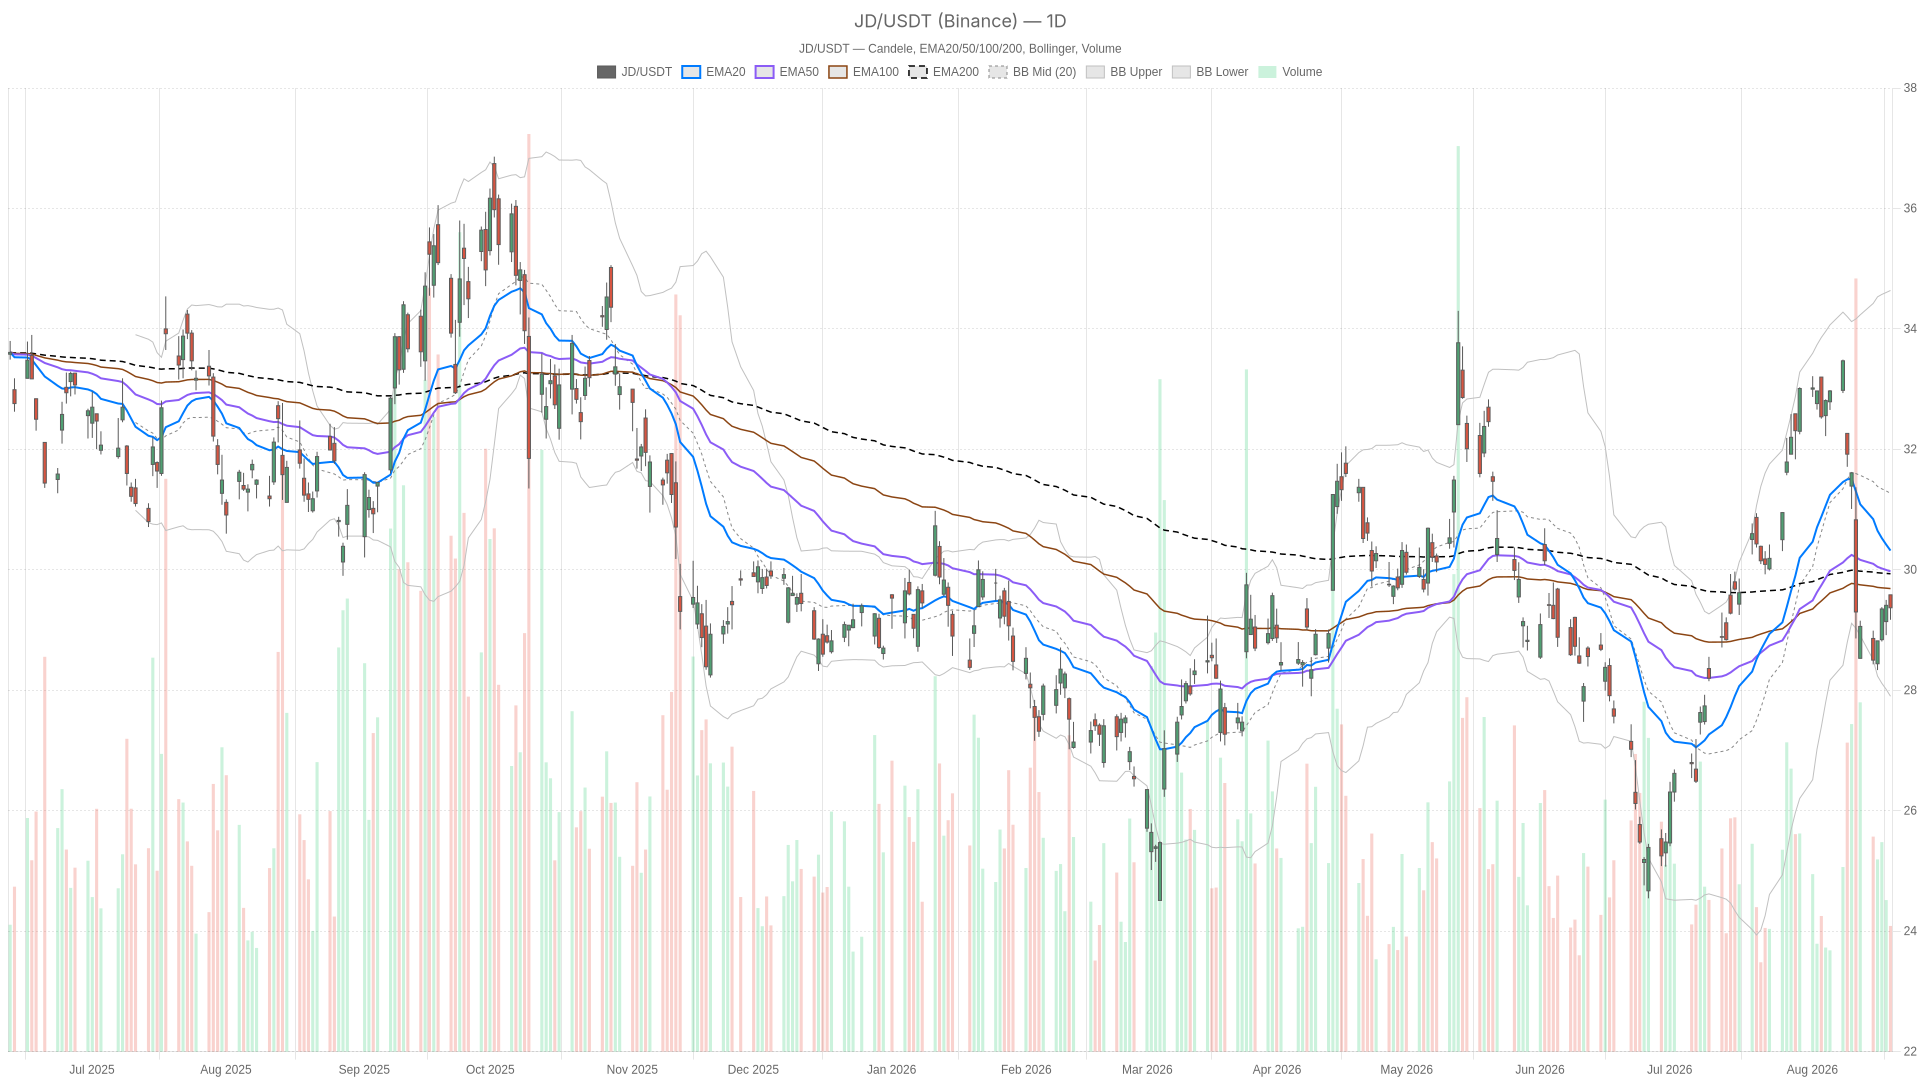 JD — daily chart with candlesticks, EMA20/EMA50 and volume.
Key takeaways
- JD.com, Inc. stock closed at 29.37, below the EMA20, EMA50, and EMA200 on the daily chart.
- Daily RSI14 sits at 42.49, and the MACD histogram is widening negative at -0.45, confirming bearish momentum.
- Michael Burry exited Alibaba and built a large JD.com position, citing valuation concerns.
- The 1H chart shows early stabilization, but resistance at the EMA50 (29.58) remains untested.
- Both bullish and bearish scenarios remain in play, with the daily pivot at 29.37 acting as the near-term fulcrum.
Daily Trend: JD.com, Inc. Stock Remains Below Every Key Average
JD.com, Inc. stock is trapped in a fully bearish moving-average structure on the daily timeframe. Price closed at 29.37, sitting below every meaningful average.
JD closed at 29.37 after trading between 29.17 and 29.58. Price sits below the EMA20 at 30.32, the EMA50 at 29.97, and the EMA200 at 29.93. That is a fully bearish stack, though the EMA50 and EMA200 are nearly touching. When short and long-term averages converge, it usually signals lost directional conviction. It does not suggest fresh downside momentum.
RSI14 on the daily chart reads 42.49. That is below the neutral 50 line, confirming momentum favors sellers for now. However, the reading is not deep enough to suggest exhaustion. MACD adds weight to that picture. The MACD line sits at -0.21 against a signal line at 0.24. That produces a histogram of -0.45. A widening negative histogram typically reflects accelerating bearish pressure, not a market on the verge of reversing higher.
Meanwhile, the Bollinger Bands frame the broader range. The mid band stands at 31.27, the upper band at 34.64, and the lower band at 27.9. Price trades well below the midline and closer to the lower band. The daily structure still favors sellers unless buyers reclaim the 31.27 zone. ATR14 at 0.82 shows volatility remains contained rather than explosive. This matters for how quickly either scenario could unfold.
Daily pivot levels are tight. The pivot point sits at 29.37, with resistance at 29.58 (R1) and support at 29.17 (S1). Price is essentially trading right on the pivot. This explains the indecision visible across the shorter timeframes.
1H Timeframe Offers a Partial Counterbalance
The 1-hour chart complicates the daily bearish read rather than confirming it. Short-term buyers have regained a tentative foothold, but the broader intraday trend remains capped from above.
Price closed at 29.38, above the EMA20 at 29.32, but still below the EMA50 at 29.58 and the EMA200 at 30.06. That is a mixed picture: short-term buyers hold a tentative edge, yet overhead resistance remains intact.
RSI14 on the 1H chart sits at 52.76, just above neutral. Meanwhile, MACD has flipped mildly positive. The line at 0.07 sits above the signal at 0.04, producing a small histogram of 0.03. This is not a strong bullish signal. Still, it does show early-stage stabilization after the daily-driven selling pressure.
The 1H Bollinger Bands are notably tight. The mid band sits at 29.34, the upper band at 29.59, and the lower band at 29.09. Such compression often precedes a more decisive directional move once resolved. ATR14 at 0.17 is modest, consistent with a market pausing rather than trending.
In short, the 1H timeframe is not confirming the daily bearish bias. Instead, it shows a tentative bounce attempt that has yet to clear meaningful overhead resistance. That tension between daily weakness and hourly stabilization is the core technical conflict in JD.com stock right now.
15-Minute Chart: The Intraday Bounce Is Losing Steam
The 15-minute chart suggests the intraday bounce seen on the 1H timeframe is already losing traction. Price is dipping back below short-term moving averages, and momentum indicators are turning negative.
On the 15-minute chart, price closed at 29.38, below the EMA20 at 29.44 but above the EMA50 at 29.36. RSI14 sits at 43.79, and the MACD histogram is slightly negative at -0.02. The MACD line at 0.01 trails the signal at 0.03. Price also trades near the lower Bollinger band, with the mid band at 29.47 and the lower band at 29.37. This reinforces that near-term strength needs confirmation before it can be trusted for entries.
Michael Burry’s Bullish Bet on JD.com, Inc. Stock
Michael Burry has placed a high-conviction bet on JD.com, Inc. stock. He exited his Alibaba position entirely and built a large JD.com stake, specifically citing valuation concerns with Alibaba as the reason for the rotation.
Beyond the charts, this is the most important fundamental development. Burry described Alibaba shares as pricey and rotated into JD.com on valuation grounds. This kind of high-conviction positioning by a well-known investor often draws additional attention and flows toward a stock. The impact is amplified when the technical setup is unsettled and open to reinterpretation, as is the case with JD.com right now.
Bullish Scenario for JD.com Stock
For JD.com stock to turn bullish, buyers must reclaim the daily pivot cluster and push back above the key moving averages clustered near 29.93–30.32.
The path forward starts with reclaiming the daily pivot zone between 29.37 and 29.58. A sustained move back above the EMA50 and EMA200 on the daily chart, both hovering near 29.93 to 29.97, would meaningfully improve the structural picture. Confirmation would come from the daily RSI pushing back above 50 and the MACD histogram narrowing toward positive territory. On the 1H chart, a break above the EMA50 at 29.58 with expanding volume would align short-term momentum with any daily improvement. The Burry disclosure adds a fundamental tailwind that could accelerate this scenario if sentiment shifts quickly.
Bearish Scenario for JD.com Stock
The daily chart already provides bears with a working structure. As long as price stays below the EMA20, EMA50, and EMA200, the broader trend remains unfavorable for buyers.
A break below the S1 support at 29.17 would open the door toward the lower Bollinger band at 27.9. On the 1H chart, a rejection at the EMA50 near 29.58, followed by a slide back under the EMA20 at 29.32, would invalidate the current bounce attempt. This would realign the shorter timeframe with the daily bearish bias. A MACD histogram that continues widening on both the daily and 1H charts would reinforce this case further.
Closing Take: JD.com, Inc. Stock at a Genuine Inflection Point
JD.com, Inc. stock is sitting at a genuine inflection point, with neither bulls nor bears holding a decisive edge. The daily structure leans bearish, but the 1H chart shows early stabilization, and Michael Burry’s newly disclosed position adds an unpredictable catalyst.
The daily timeframe still leans bearish. Price sits below every key moving average, and momentum indicators tilt lower. However, the 1H chart is showing early signs of stabilization, and the 15-minute picture suggests that bounce is not yet fully confirmed. Volatility, as measured by ATR, remains moderate rather than extreme. This means the resolution of this conflict may take time rather than arriving in a single sharp move. Traders watching JD stock should treat the current setup as unresolved. Both the bullish and bearish scenarios remain very much in play, depending on how price behaves around the daily pivot and the EMA cluster near 29.9 to 30.3.
FAQ
What is the current technical outlook for JD.com, Inc. stock?
The daily chart shows a bearish structure. JD.com, Inc. stock closed at 29.37, below the EMA20 (30.32), EMA50 (29.97), and EMA200 (29.93). Daily RSI14 sits at 42.49, and the MACD histogram is widening negative at -0.45. The 1H chart, however, shows early stabilization with RSI at 52.76 and a mildly positive MACD.
Why did Michael Burry invest in JD.com stock?
Michael Burry disclosed he exited his Alibaba position, calling the shares overvalued, and built a large stake in JD.com, Inc. stock. He specifically cited valuation concerns around Alibaba as the reason for rotating into JD.com.
What are the key price levels to watch for JD.com stock?
The daily pivot at 29.37 is the immediate fulcrum. Resistance sits at 29.58 (R1), and the key moving average cluster between 29.93 and 30.32 must be reclaimed for a bullish shift. Support lies at 29.17 (S1), with the lower Bollinger band at 27.9 as the next downside target.
Is JD.com stock more bullish or bearish right now?
The setup remains unresolved. The daily timeframe favors bears, with price below all key moving averages. However, the 1H chart shows stabilization, and Michael Burry’s high-conviction position introduces a bullish catalyst that pure technical analysis cannot capture. Both scenarios remain viable.
Disclaimer: This article is for informational purposes only and does not constitute financial advice, an investment recommendation, or a solicitation to buy or sell any financial instrument or cryptocurrency. The analysis provided is not indicative of future results. Investing in crypto assets and financial markets carries a high risk of capital loss. Always do your own research (DYOR) and consult a qualified financial advisor before making any decision.
Article produced with the assistance of artificial intelligence and reviewed by the editorial team.








 English (US) ·