
 8 months ago
44
8 months ago
44
TL;DR
- Analysts predict OM could reach $10 – $15, with some calling it the “king of RWAs.”
- Nonetheless, the asset’s RSI recently entered overbought territory, suggesting a potential short-term correction.

OM’s Next Potential Targets
The cryptocurrency market was severely affected at the start of the business week after US President Donald Trump imposed hefty tariffs on Canada, China, and Mexico. Bitcoin (BTC) briefly plunged below $92,000, while Ethereum (ETH) and other leading altcoins registered double-digit price declines.
However, it was not all doom and gloom, and some cryptocurrencies remained on the bullish track. One example is Mantra (OM), whose valuation tapped a new all-time high of over $6 on February 4.
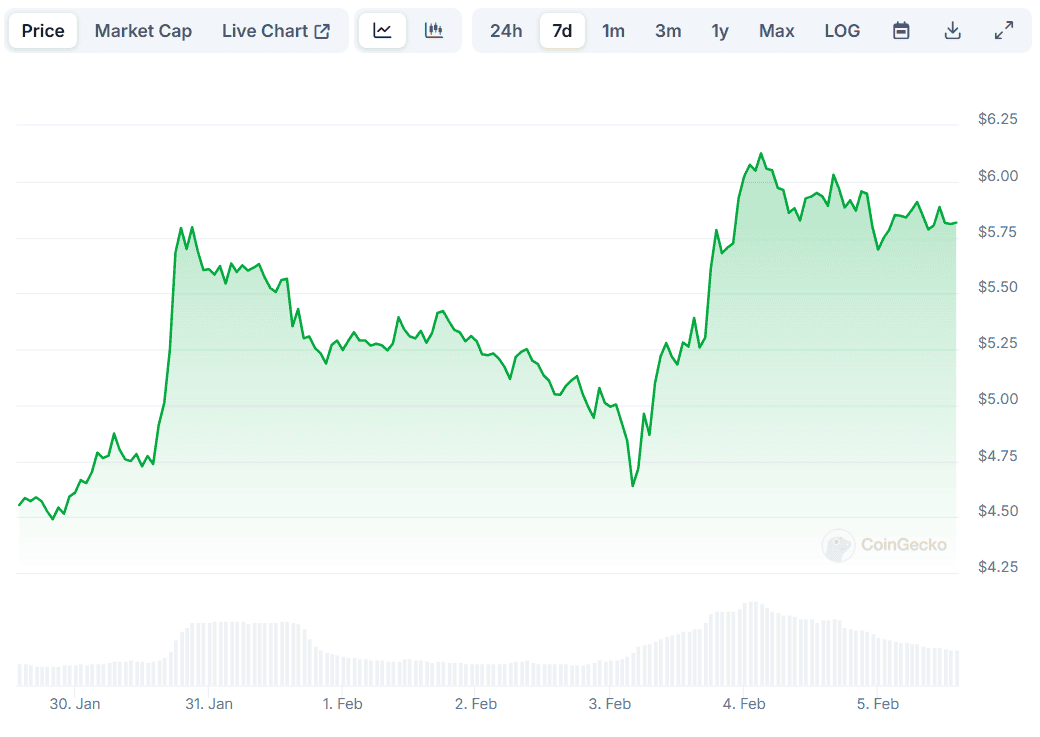 OM Price, Source: CoinGecko
The asset is up a staggering 3,500% on a yearly scale, with some major developments potentially driving the rally. Earlier in 2025, for instance, the team behind Mantra signed a $1 billion agreement deal with the investment conglomerate DAMAC Group to boost accessibility to tokenized assets in the Middle East.
OM’s bull run was noted by numerous market observers, some of whom believe there is more room for growth in the near future.
The X users Erica Hazel and Cowboy Genius described the collaboration in the Middle East as a huge step for Mantra. The former claimed that “this blockchain is ready to disrupt the space in ways others can’t match,” predicting that the price of its native token might soar to $10.
For their part, Cowboy Genius labeled Mantra “the king of RWAs right now” and envisioned a 10x rally from the current levels.
Ether Wizz chipped in, too, maintaining that Mantra “is solving real problems while others are still figuring it out.” They suggested that OM’s price could skyrocket to $15 by the end of the year.
Bulls Should Have This Thing in Mind
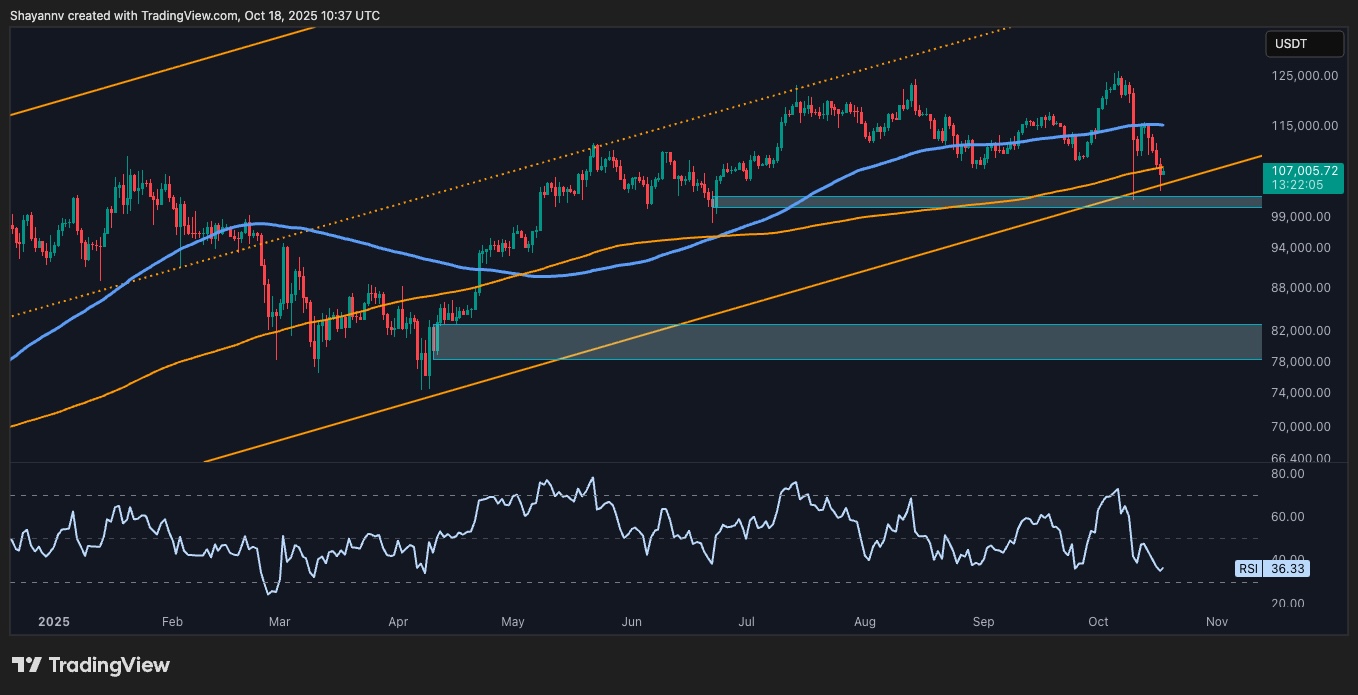
Despite all the analysts forecasting new peaks for OM, one essential on-chain metric signals that the token’s valuation might head south in the short term. This is the Relative Strength Index (RSI), which measures the speed and change of price movements to help traders assess overbought or oversold conditions.
The technical analysis tool varies from 0 to 100, and readings above 70 suggest that OM could be overbought and due for a correction. The RSI recently spiked above the bearish mark, currently set at around 60.
The post Mantra (OM) Price Prediction: How High Can it Go? appeared first on CryptoPotato.


 English (US) ·