
 2 hours ago
11
2 hours ago
11

McDonald’s Corporation stock ends the week caught between two conflicting forces. The short-term tape is repairing itself, yet the daily structure stays broken. At 274.48, MCD trades well below its 200-day EMA at 293.01. This is stabilisation, not an uptrend.
The main scenario, therefore, is neutral with a bearish medium-term overhang. Daily momentum has improved enough to keep sellers honest. It has not improved enough to reclaim trend leadership. Until the 50-day EMA at 275.09 is taken and held, rallies remain corrective in nature.
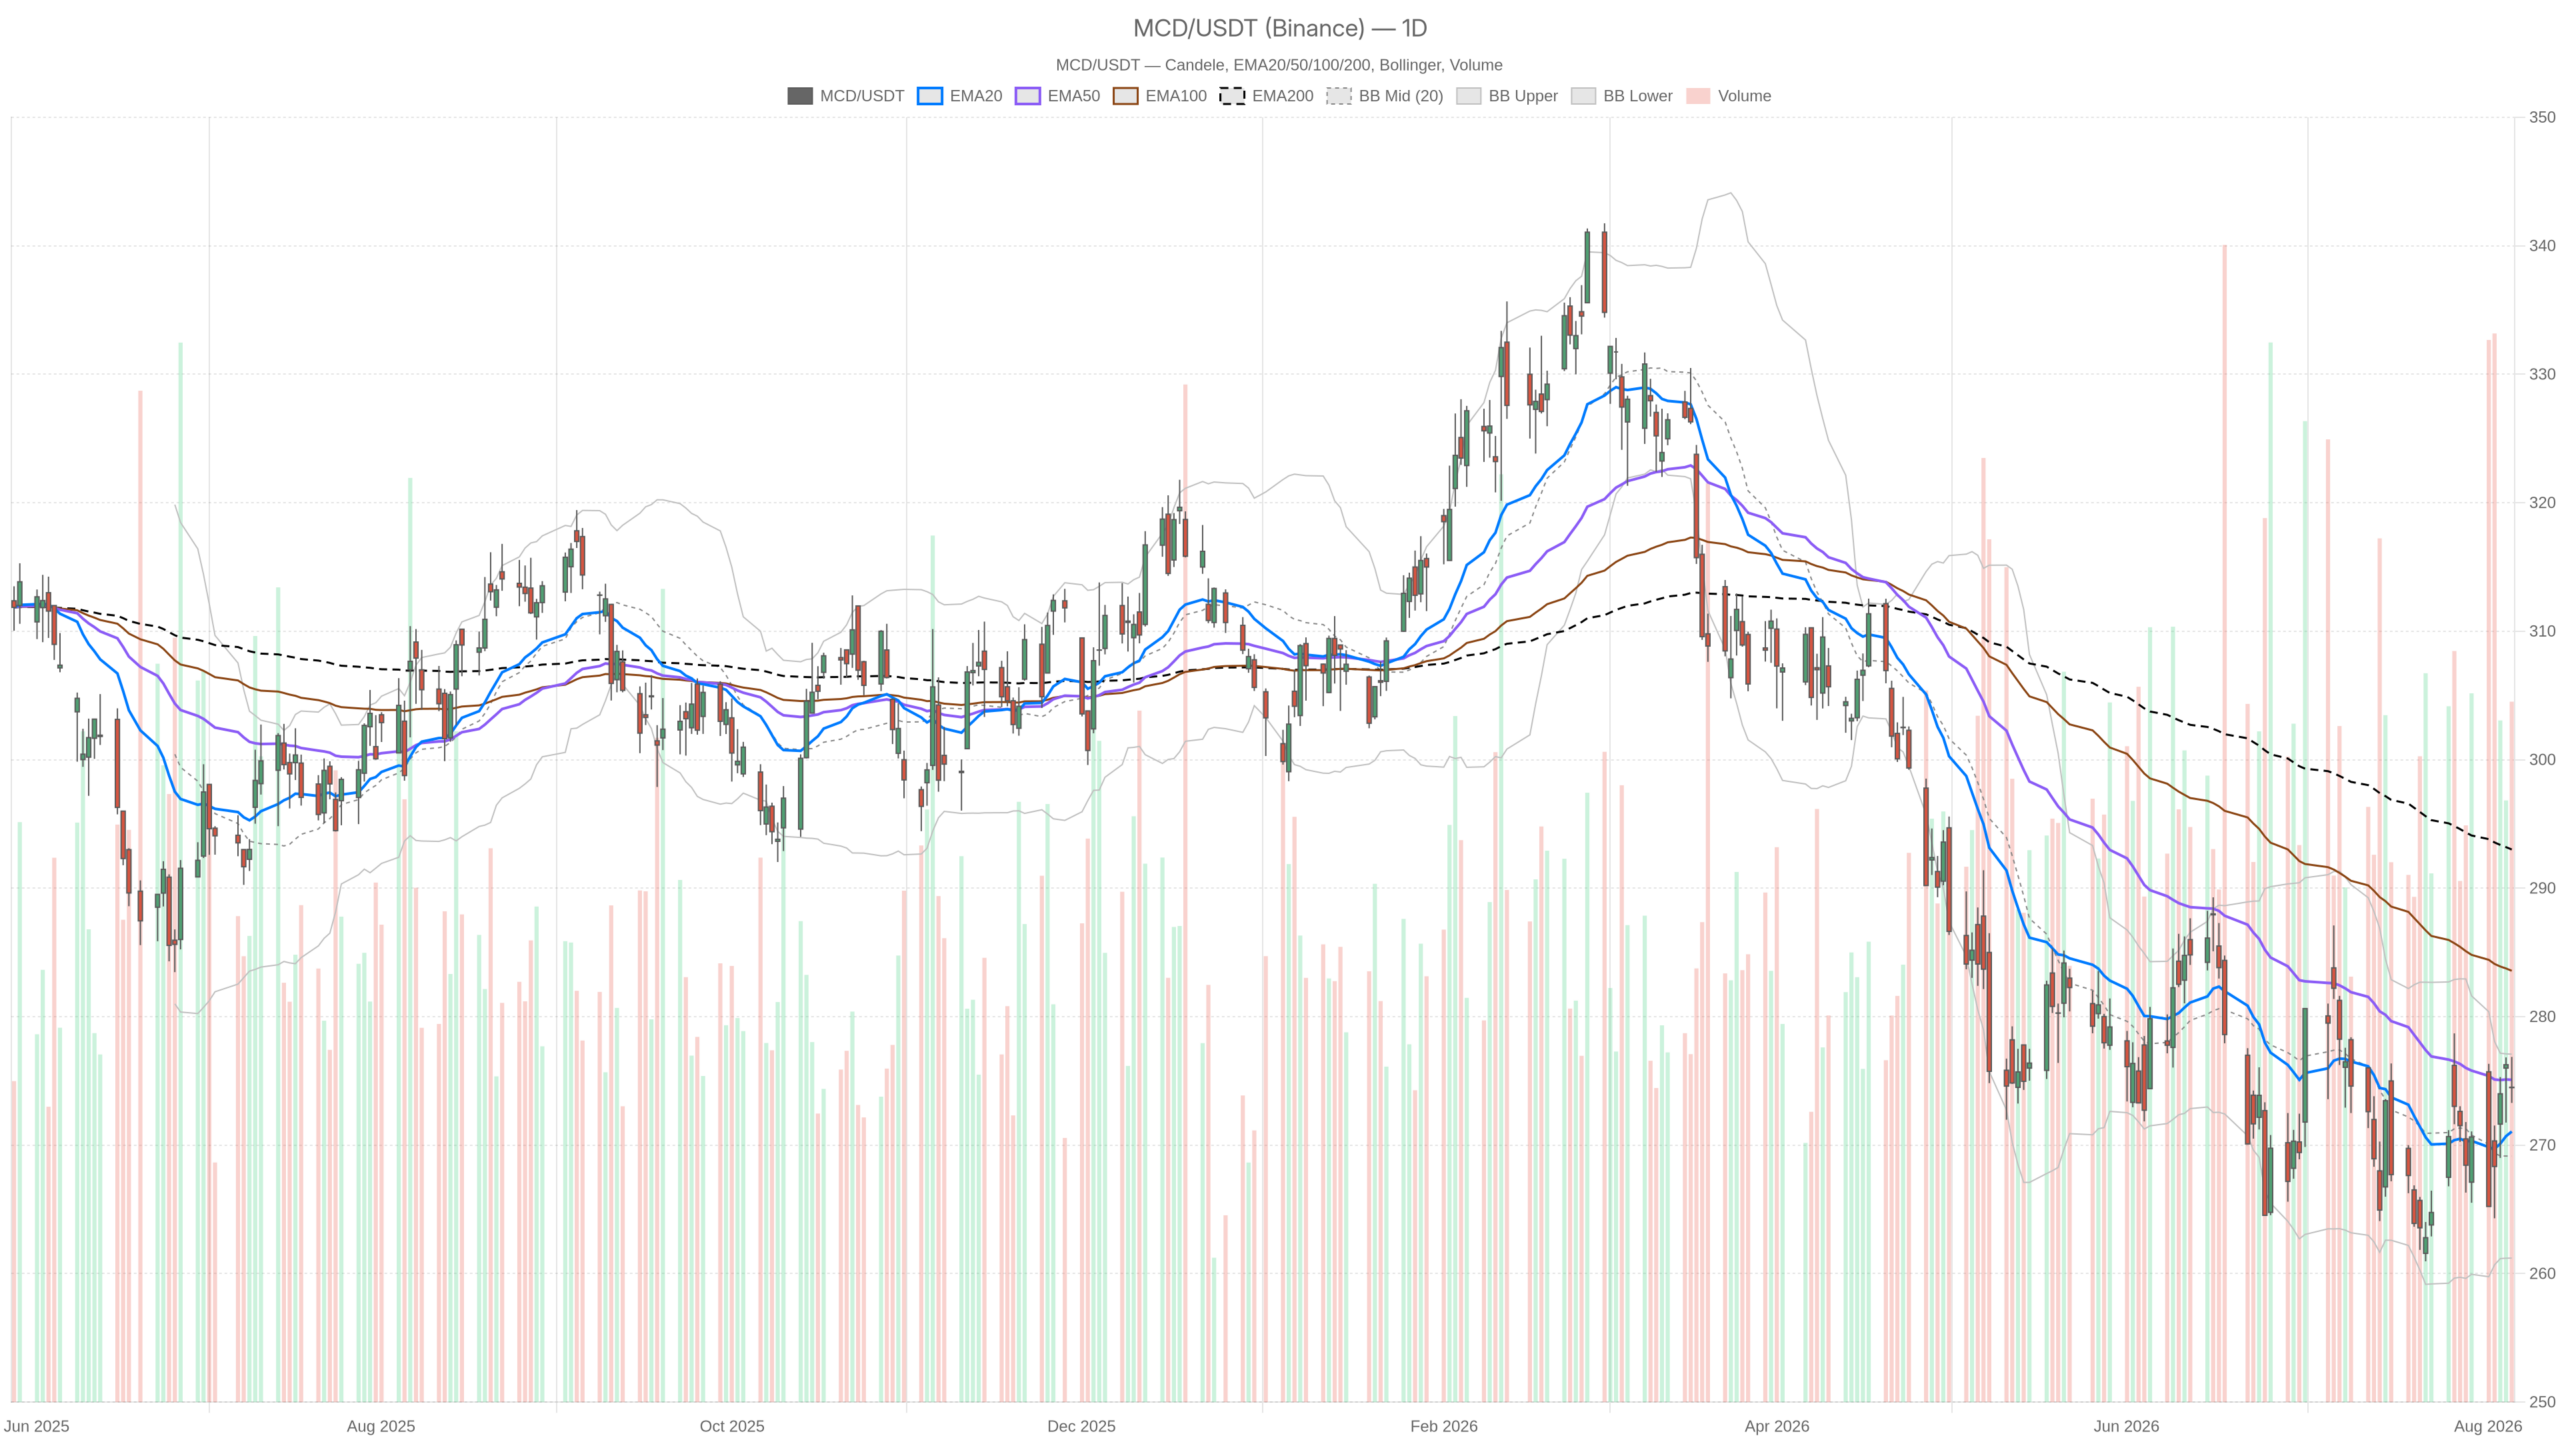 MCD — daily chart with candlesticks, EMA20/EMA50 and volume.
Key takeaways
- MCD closed at 274.48, well below its 200-day EMA at 293.01, confirming a damaged daily structure.
- Daily RSI at 53.48 signals neutral momentum, while MACD shows a fading but still-negative reading of -0.34.
- The 50-day EMA at 275.09 is the critical level bulls must reclaim to shift the medium-term bias.
- Key resistance sits in the 276.47–277.08 band; support lies at 272.89 and 271.06.
- Burger King posted +8.5% comparable sales against MCD’s +0.8%, widening the competitive gap.
Daily structure defines the bias for McDonald’s Corporation stock
The daily chart shows McDonald’s Corporation stock trapped inside a downtrend compression, squeezed between short-term support and medium-term resistance. Price is stabilising, but it is not recovering in trend terms.
EMA stack and trend structure
To begin with, the daily EMA stack tells a clear story. Currently, price trades above the 20-day EMA at 271.06. However, it remains below the 50-day at 275.09 and far beneath the 200-day at 293.01. In short, that is textbook compression inside a downtrend.
In this setup, short-term buyers have controlled the last two weeks. Meanwhile, longer-term sellers still own the year. The structure is repairing at the margin, not reversing.
RSI and MACD momentum signals
At the same time, daily RSI at 53.48 confirms the balance. Momentum has lifted off weakness without reaching strength. There is no overbought risk here, and no capitulation either. It is the reading of a market rebuilding a base.
Meanwhile, MACD adds nuance. The line at -0.34 remains below zero. Yet it has crossed above its signal at -1.52, producing a positive histogram of 1.18. Downside momentum is fading. The impulse has shifted in favour of buyers. However, a negative MACD line still means the recovery is happening inside a broader bearish cycle.
Bollinger Bands and volatility context
Similarly, Bollinger Bands reinforce that picture. The daily mid-band sits at 269.15, with the upper edge at 277.08. Still, price is riding the upper half of the range, which is constructive. Notably, the 277.08 level almost overlaps with the daily R1 pivot at 276.47. That cluster is the first real ceiling.
In terms of volatility, daily ATR of 5.50 sets expectations. Roughly five and a half points of average daily range sets the context. The gap between 274.48 and the 277 resistance shelf can be covered in a single session. Volatility is not the obstacle—conviction is.
The 1H chart confirms the short-term bid
The hourly chart confirms that a short-term bid remains intact for McDonald’s Corporation stock. However, momentum is cooling as price approaches the resistance wall visible on the daily timeframe.
At this level, the regime reads bullish, and the moving averages agree. EMA20 at 273.80 sits above EMA50 at 271.98, which in turn sits above EMA200 at 271.62. Overall, that is a proper ascending alignment. As a result, price above all three keeps intraday structure constructive.
In turn, hourly RSI at 56.16 supports that read without excess. Meanwhile, hourly MACD is flashing a caution signal. The line at 1.10 has slipped below the signal at 1.31, producing a histogram of -0.21. The uptrend is intact, but its thrust is cooling. That is typical behaviour as a market approaches resistance.
On the band structure, the hourly Bollinger mid-band at 274.34 is effectively where price is trading. Above sits the upper band at 276.43 and the daily R1 zone. Below, the lower band at 272.25 lines up closely with the daily S1 pivot at 272.89. Hourly ATR of 1.76 suggests that band can be traversed inside a few hours.
In summary, the 1H timeframe confirms the short-term rebound but does not resolve the daily conflict. In other words, it shows a market grinding higher into a wall, not breaking through it.
15m execution context: hesitation right at the pivot
Stepping down further, the 15-minute chart reveals hesitation at the 274.25 pivot for McDonald’s Corporation stock. Short-term traders are pausing, not reversing, and the tape is quiet.
Indeed, the fatigue is most visible on this timeframe. EMA20 at 274.47 and EMA50 at 274.29 are nearly stacked on price. RSI at 49.52 is dead neutral. MACD is marginally negative, with the line at -0.23 under its signal at -0.18.
In contrast, the 15m EMA200 at 271.62 remains well below price. Therefore, the intraday regime is still classified as bullish. The message is simple: short-term traders are hesitating at the 274.25 pivot, not reversing. With a 15m ATR of just 0.59, the tape is quiet and coiled.
For now, the relevant execution markers are tight. R1 at 274.83 and the upper band at 275.35 cap the immediate upside. S1 at 273.90 and the lower band at 273.64 define the first slip level. Losing 273.64 would hand intraday initiative back to sellers.
Bullish scenario: reclaiming the 50-day EMA
The bullish case for McDonald’s Corporation stock requires a specific sequence to flip the narrative. First, an hourly close above the 274.96 R1 pivot. Then acceptance above the 275.09 daily 50-day EMA. Finally, a push through the 276.47–277.08 band where the daily R1 and upper Bollinger converge.
If achieved, clearing that zone would turn the daily MACD recovery into something more meaningful. The positive histogram of 1.18 would gain confirmation from price rather than momentum alone. With daily ATR at 5.50, follow-through toward the upper end of the daily range becomes mechanically plausible.
Still, the narrative side offers a hook too. Coverage of MCD points to loyalty scale and a beverage platform rolling out ahead of plan as potential drivers into December.
Bearish scenario: what invalidates the recovery
The bearish case for McDonald’s Corporation stock is simpler, because the trend already favours it. A rejection at 275–277 followed by a break of 272.89 would end the rebound attempt.
Consequently, the daily 20-day EMA at 271.06 becomes the pivotal battleground. A loss of 271.06 would put the 269.15 mid-band and then the 261.21 lower band in play.
At the same time, the fundamental backdrop leans this way as well. Reporting highlights that McDonald’s has acknowledged alienating its most loyal customers, with value perception the central complaint. Competitive data is more pointed still. Burger King delivered +8.5% comparable sales against MCD’s +0.8%. Market share loss at that scale is exactly the kind of pressure that keeps a stock capped below its 200-day average.
Therefore, the bullish argument stays conditional. Without a sustained reclaim of 275.09, every bounce should be treated as range behaviour inside a longer downtrend.
Positioning, volatility and the honest verdict
The honest verdict on McDonald’s Corporation stock is that timeframes genuinely disagree. On the daily side, the regime is neutral with bearish trend architecture. The 1H and 15m regimes are bullish but losing momentum at resistance. Mixed signals like these usually resolve through a breakout or a failed retest, rarely through slow drift.
Meanwhile, volatility is currently compressed across all three horizons. Specifically, a 0.59 ATR on 15m and 1.76 on 1H point to a market storing energy. Expansion tends to follow such quiet phases. The direction of that expansion will be decided at 275.09 above and 272.89 below.
In the end, McDonald’s Corporation stock is a stabilisation story fighting a weak trend and a deteriorating competitive narrative. Still, the technical repair is real but unfinished. For context, the 200-day EMA at 293.01 remains the reminder of how much ground is still lost. Until that gap narrows, patience and level discipline matter more than conviction in either direction.
FAQ
What is the key level to watch for McDonald’s Corporation stock?
The 50-day EMA at 275.09 is the critical level. A sustained reclaim above it would shift the medium-term bias. Until then, rallies remain corrective inside a broader downtrend.
Is McDonald’s Corporation stock in a bullish or bearish trend?
The daily trend is bearish, with price trading well below the 200-day EMA at 293.01. However, short-term momentum has improved, keeping the near-term outlook neutral-to-constructive within a damaged structure.
What are the main support levels for MCD?
The first support sits at 272.89, the daily S1 pivot. Below that, the 20-day EMA at 271.06 becomes the pivotal battleground. A break there opens the path to the mid-band at 269.15 and lower band at 261.21.
What competitive pressures is McDonald’s facing?
Burger King posted +8.5% comparable sales against MCD’s +0.8%, a significant gap. Additionally, McDonald’s has acknowledged alienating its most loyal customers over value perception, adding fundamental pressure to the technical weakness.
Disclaimer: This article is for informational purposes only and does not constitute financial advice, an investment recommendation, or a solicitation to buy or sell any financial instrument or cryptocurrency. The analysis provided is not indicative of future results. Investing in crypto assets and financial markets carries a high risk of capital loss. Always do your own research (DYOR) and consult a qualified financial advisor before making any decision.
Article produced with the assistance of artificial intelligence and reviewed by the editorial team.









 English (US) ·