
 2 hours ago
11
2 hours ago
11

Merck & Company, Inc. stock shows a clear split between timeframes. The daily chart remains firmly bullish, while shorter timeframes reveal cooling momentum. Fresh clinical news from the Merck-Moderna melanoma vaccine program adds another layer. Trend and timing must now be read separately.
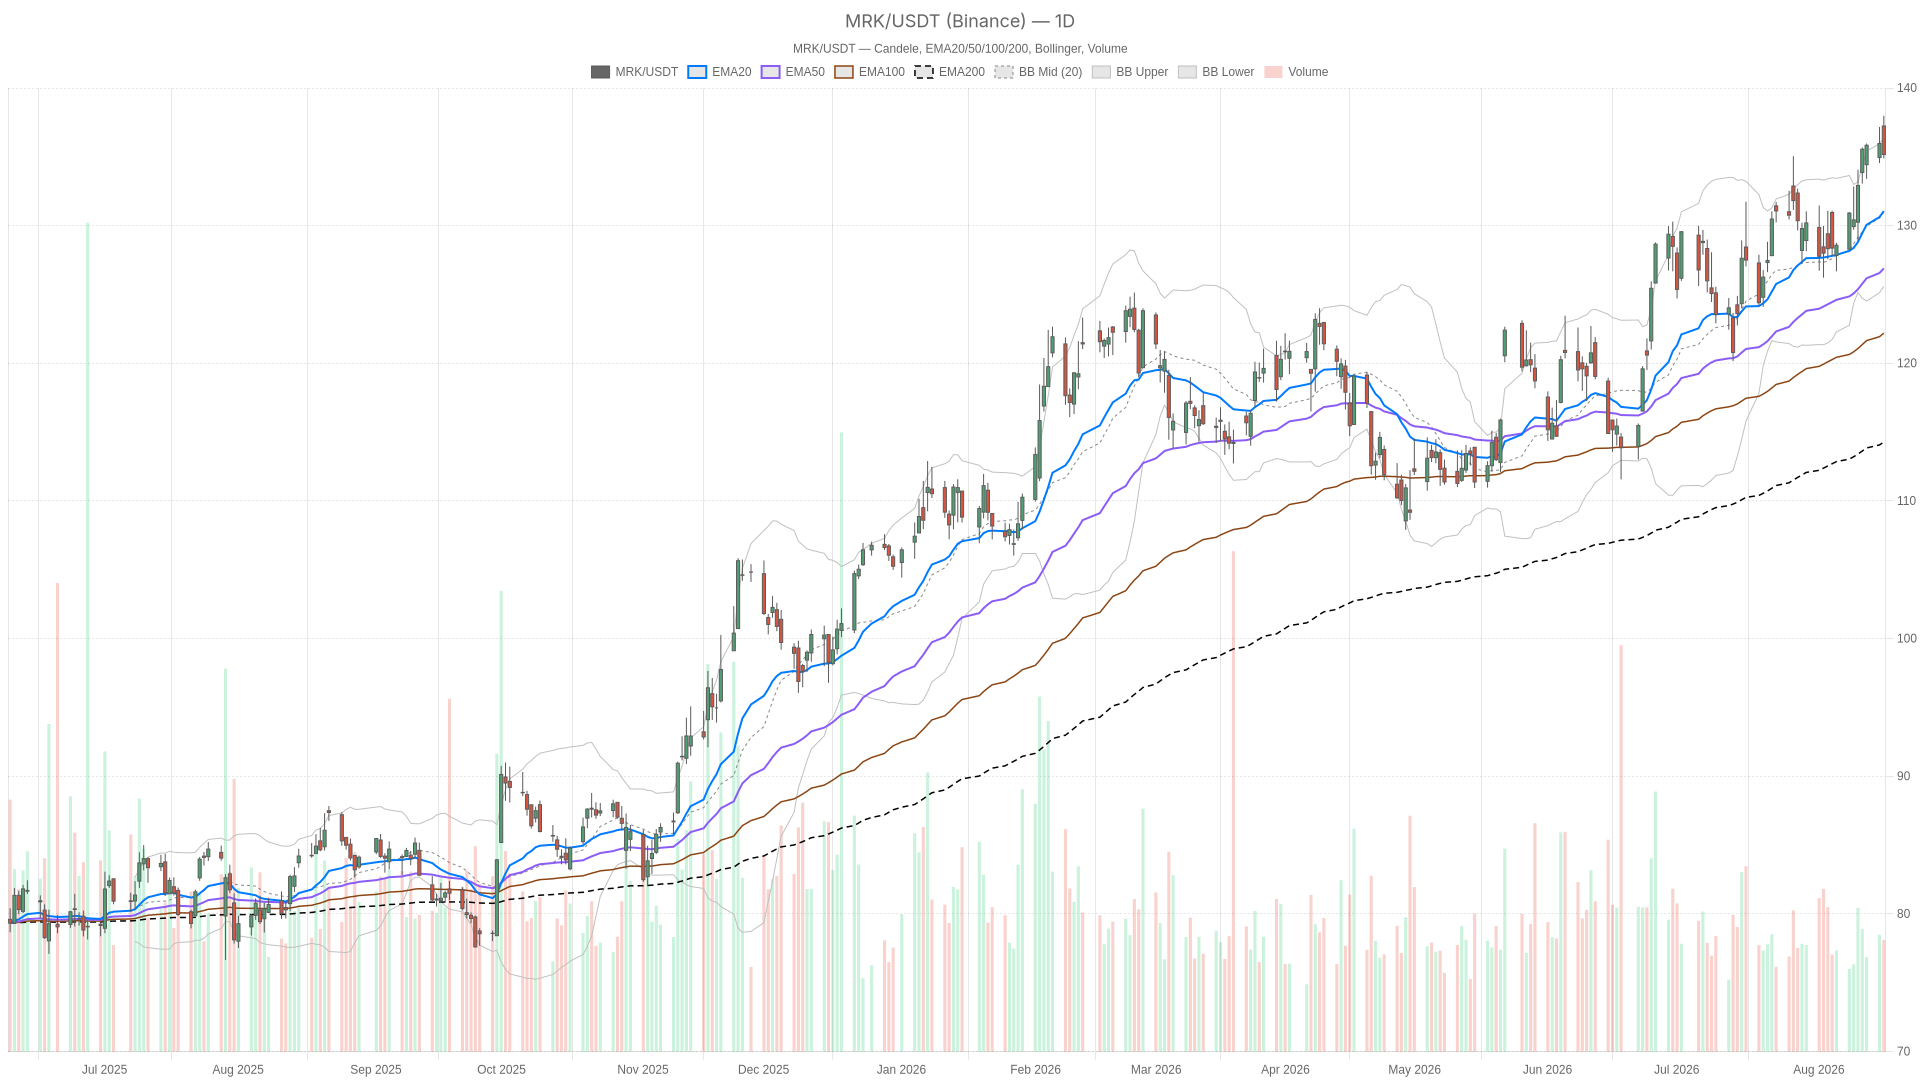 MRK — daily chart with candlesticks, EMA20/EMA50 and volume.
Key takeaways
- Merck & Company, Inc. stock closed at 135.17, with the daily EMA20/EMA50/EMA200 stack in classic bullish alignment.
- Daily RSI14 at 65.81 and a positive MACD histogram of 0.44 confirm momentum is still expanding to the upside.
- Hourly RSI14 has cooled to 50.99 and the 1H MACD histogram turned negative (-0.27), signaling short-term hesitation.
- The Phase 3 INTerpath-001 melanoma vaccine trial met its primary endpoints, driving shares in both Merck and Moderna higher.
- Price is boxed in a tight range near the daily pivot at 136.01, with S1 at 134.04 and R1 at 137.14.
Daily Trend: Bulls Still in Control of Merck Stock
The daily trend for Merck & Company, Inc. stock remains firmly bullish. The EMA20 at 131.06, EMA50 at 126.90, and EMA200 at 114.28 are stacked in classic uptrend order. This alignment signals a market where dips continue to attract buyers on a multi-month view.
Notably, Merck closed at 135.17 after printing a session high of 137.98 and a low of 134.88. The close came in below the open of 137.24, indicating sellers pushed back near the highs. Even so, the broader structure stayed intact. The stock has also been cited jumping to 52-week highs on strong earnings momentum, reinforcing the established advance.
Short-Term Momentum Diverges from the Daily Uptrend
Shorter timeframes tell a more cautious story for Merck & Company, Inc. stock. While the daily trend points higher, intraday momentum has clearly cooled. This divergence leaves the stock in a holding pattern that demands patience from bulls.
Hourly Indicators Point to Cooling
Meanwhile, the 1H RSI14 has dropped to 50.99, settling in neutral territory. The 1H MACD line sits at 0.50 against a signal of 0.77, producing a negative histogram of -0.27. In short, short-term momentum has turned lower even as the daily trend stays intact. This is a case where timeframes disagree: the bigger trend is bullish, but the immediate momentum is fading.
15-Minute Chart Shows Intraday Weakness
On the 15-minute chart, RSI14 reads 39.99 — the weakest reading across all three timeframes. The MACD histogram is barely positive at 0.01, with the line at -0.18 versus a signal of -0.20. However, the near-flat reading suggests the decline may be losing steam. No clean reversal signal has emerged yet.
Volatility and Pivots Frame the Near-Term Picture
Merck & Company, Inc. stock is consolidating in a tighter range after a wide daily move. The volatility structure and pivot levels together define where the next directional break could occur.
Daily Bollinger Bands show price at 135.17, above the mid-band of 130.99 and close to the upper band at 136.39. Daily ATR14 stands at 3.25, confirming wide swings on this timeframe. In contrast, the hourly bands are far tighter, with a mid-band at 135.71 and an ATR14 of just 1.00. The 15-minute ATR14 is even narrower at 0.29. The stock made a large daily move and is now consolidating in lower volatility.
On the pivot side, the daily level sits at 136.01, with resistance R1 at 137.14 and support S1 at 134.04. Price closed below the daily pivot — a mildly cautious signal inside a bullish broader trend. Meanwhile, the hourly pivot is 135.29, with R1 at 135.48 and S1 at 134.98. The 15-minute structure mirrors this. Price is boxed inside this narrow band, which explains the indecisive short-term tone.
Melanoma Vaccine Trial Provides a Fresh Catalyst
A meaningful clinical update is now in play alongside the technical picture for Merck & Company, Inc. stock. Merck and Moderna announced that the Phase 3 INTerpath-001 trial met its primary endpoints. The combination of intismeran autogene plus KEYTRUDA showed significant improvement in recurrence-free survival and distant metastasis-free survival. The trial evaluated patients with resected Stage IIB-IV melanoma.
Notably, reports from CNBC and Bloomberg confirmed the regimen extended the time patients lived without their melanoma returning. The improvement was measured against KEYTRUDA alone. Shares in both companies surged on the news. Therefore, this pipeline catalyst can shift sentiment beyond what the daily candle alone reflects. After all, the news broke after the last completed daily bar. The fundamental backdrop was already constructive, with Merck highlighted among names hitting 52-week highs on strong earnings momentum.
Bullish Scenario for Merck Stock
The bullish case for Merck & Company, Inc. stock rests on the daily trend reasserting control. First, a reclaim of the daily pivot at 136.01, followed by a push through R1 at 137.14, would put the recent high of 137.98 back in focus. Hourly RSI would need to move above 50 with conviction for this to carry weight. The hourly MACD histogram would also need to flip positive again.
At the same time, a daily RSI holding in the mid-60s without rolling over would support the broader uptrend. The EMA20/EMA50/EMA200 stack must stay intact. Sustained strength tied to the melanoma trial results and ongoing earnings momentum would be a logical trigger for such a move.
Bearish Risks and Invalidation Points
Bearish risk centers on a loss of daily structure. Specifically, a break below S1 at 134.04 would be the first warning sign. A deeper slide toward the daily EMA20 at 131.06 would signal that recent strength is fading rather than pausing.
In contrast, if the daily RSI drops decisively below 60 while the MACD histogram shrinks from its current 0.44, that would confirm momentum is genuinely turning. On the hourly chart, a break below the EMA50 at 133.87 would add weight to this bearish path. Such a combination would invalidate the near-term bullish setup. The longer-term EMA200 trend at 114.28 would still remain technically bullish, but the tactical picture would shift.
Positioning and Outlook for Merck Stock
Overall, Merck & Company, Inc. stock presents a split picture. The daily trend is bullish, supported by well-aligned EMAs, a positive MACD, and RSI still under overbought extremes. However, the hourly and 15-minute timeframes show cooling momentum and a tight, undecided range around the 135 area.
Still, given the ATR readings across timeframes, volatility could pick up quickly. The fresh clinical catalyst from the melanoma vaccine trial adds urgency. Therefore, near-term direction hinges on how price behaves around the daily pivot at 136.01 and the S1/R1 hourly band. Until smaller-timeframe momentum realigns with the daily trend, the setup remains one of controlled uncertainty rather than a clean directional signal.
FAQ
Is Merck & Company, Inc. stock still in a daily uptrend?
Yes. The daily EMA20 at 131.06, EMA50 at 126.90, and EMA200 at 114.28 are stacked in classic bullish order. Daily RSI14 at 65.81 and a positive MACD histogram of 0.44 confirm momentum is still expanding to the upside. The stock has also been cited reaching 52-week highs on strong earnings momentum.
Why is intraday momentum cooling for Merck stock?
Hourly RSI14 has cooled to 50.99, which is neutral territory. The 1H MACD histogram has turned negative at -0.27. On the 15-minute chart, RSI14 is at 39.99 — the weakest reading across all timeframes — indicating short-term sellers remain active even as the daily trend stays intact.
What is the Merck-Moderna melanoma vaccine news?
Merck and Moderna announced that the Phase 3 INTerpath-001 trial met its primary endpoints. The combination of intismeran autogene plus KEYTRUDA significantly extended recurrence-free survival and distant metastasis-free survival in patients with resected Stage IIB-IV melanoma, compared with KEYTRUDA alone.
What are the key levels to watch for Merck stock?
The daily pivot at 136.01 is the near-term battleground. Resistance sits at R1 137.14, with the recent high at 137.98. Support lies at S1 134.04, with the daily EMA20 at 131.06 serving as a deeper floor. On the hourly chart, the EMA50 at 133.87 is also a critical level to monitor.
Disclaimer: This article is for informational purposes only and does not constitute financial advice, an investment recommendation, or a solicitation to buy or sell any financial instrument or cryptocurrency. The analysis provided is not indicative of future results. Investing in crypto assets and financial markets carries a high risk of capital loss. Always do your own research (DYOR) and consult a qualified financial advisor before making any decision.
Article produced with the assistance of artificial intelligence and reviewed by the editorial team.






 English (US) ·