
 1 month ago
50
1 month ago
50

Microsoft stock (MSFT) closed at $399.76 on June 15, firmly below all major daily moving averages. The daily bearish regime remains intact, though an intraday bounce is pushing back. The path of least resistance points downward, and any recovery should be treated as a counter-trend move.
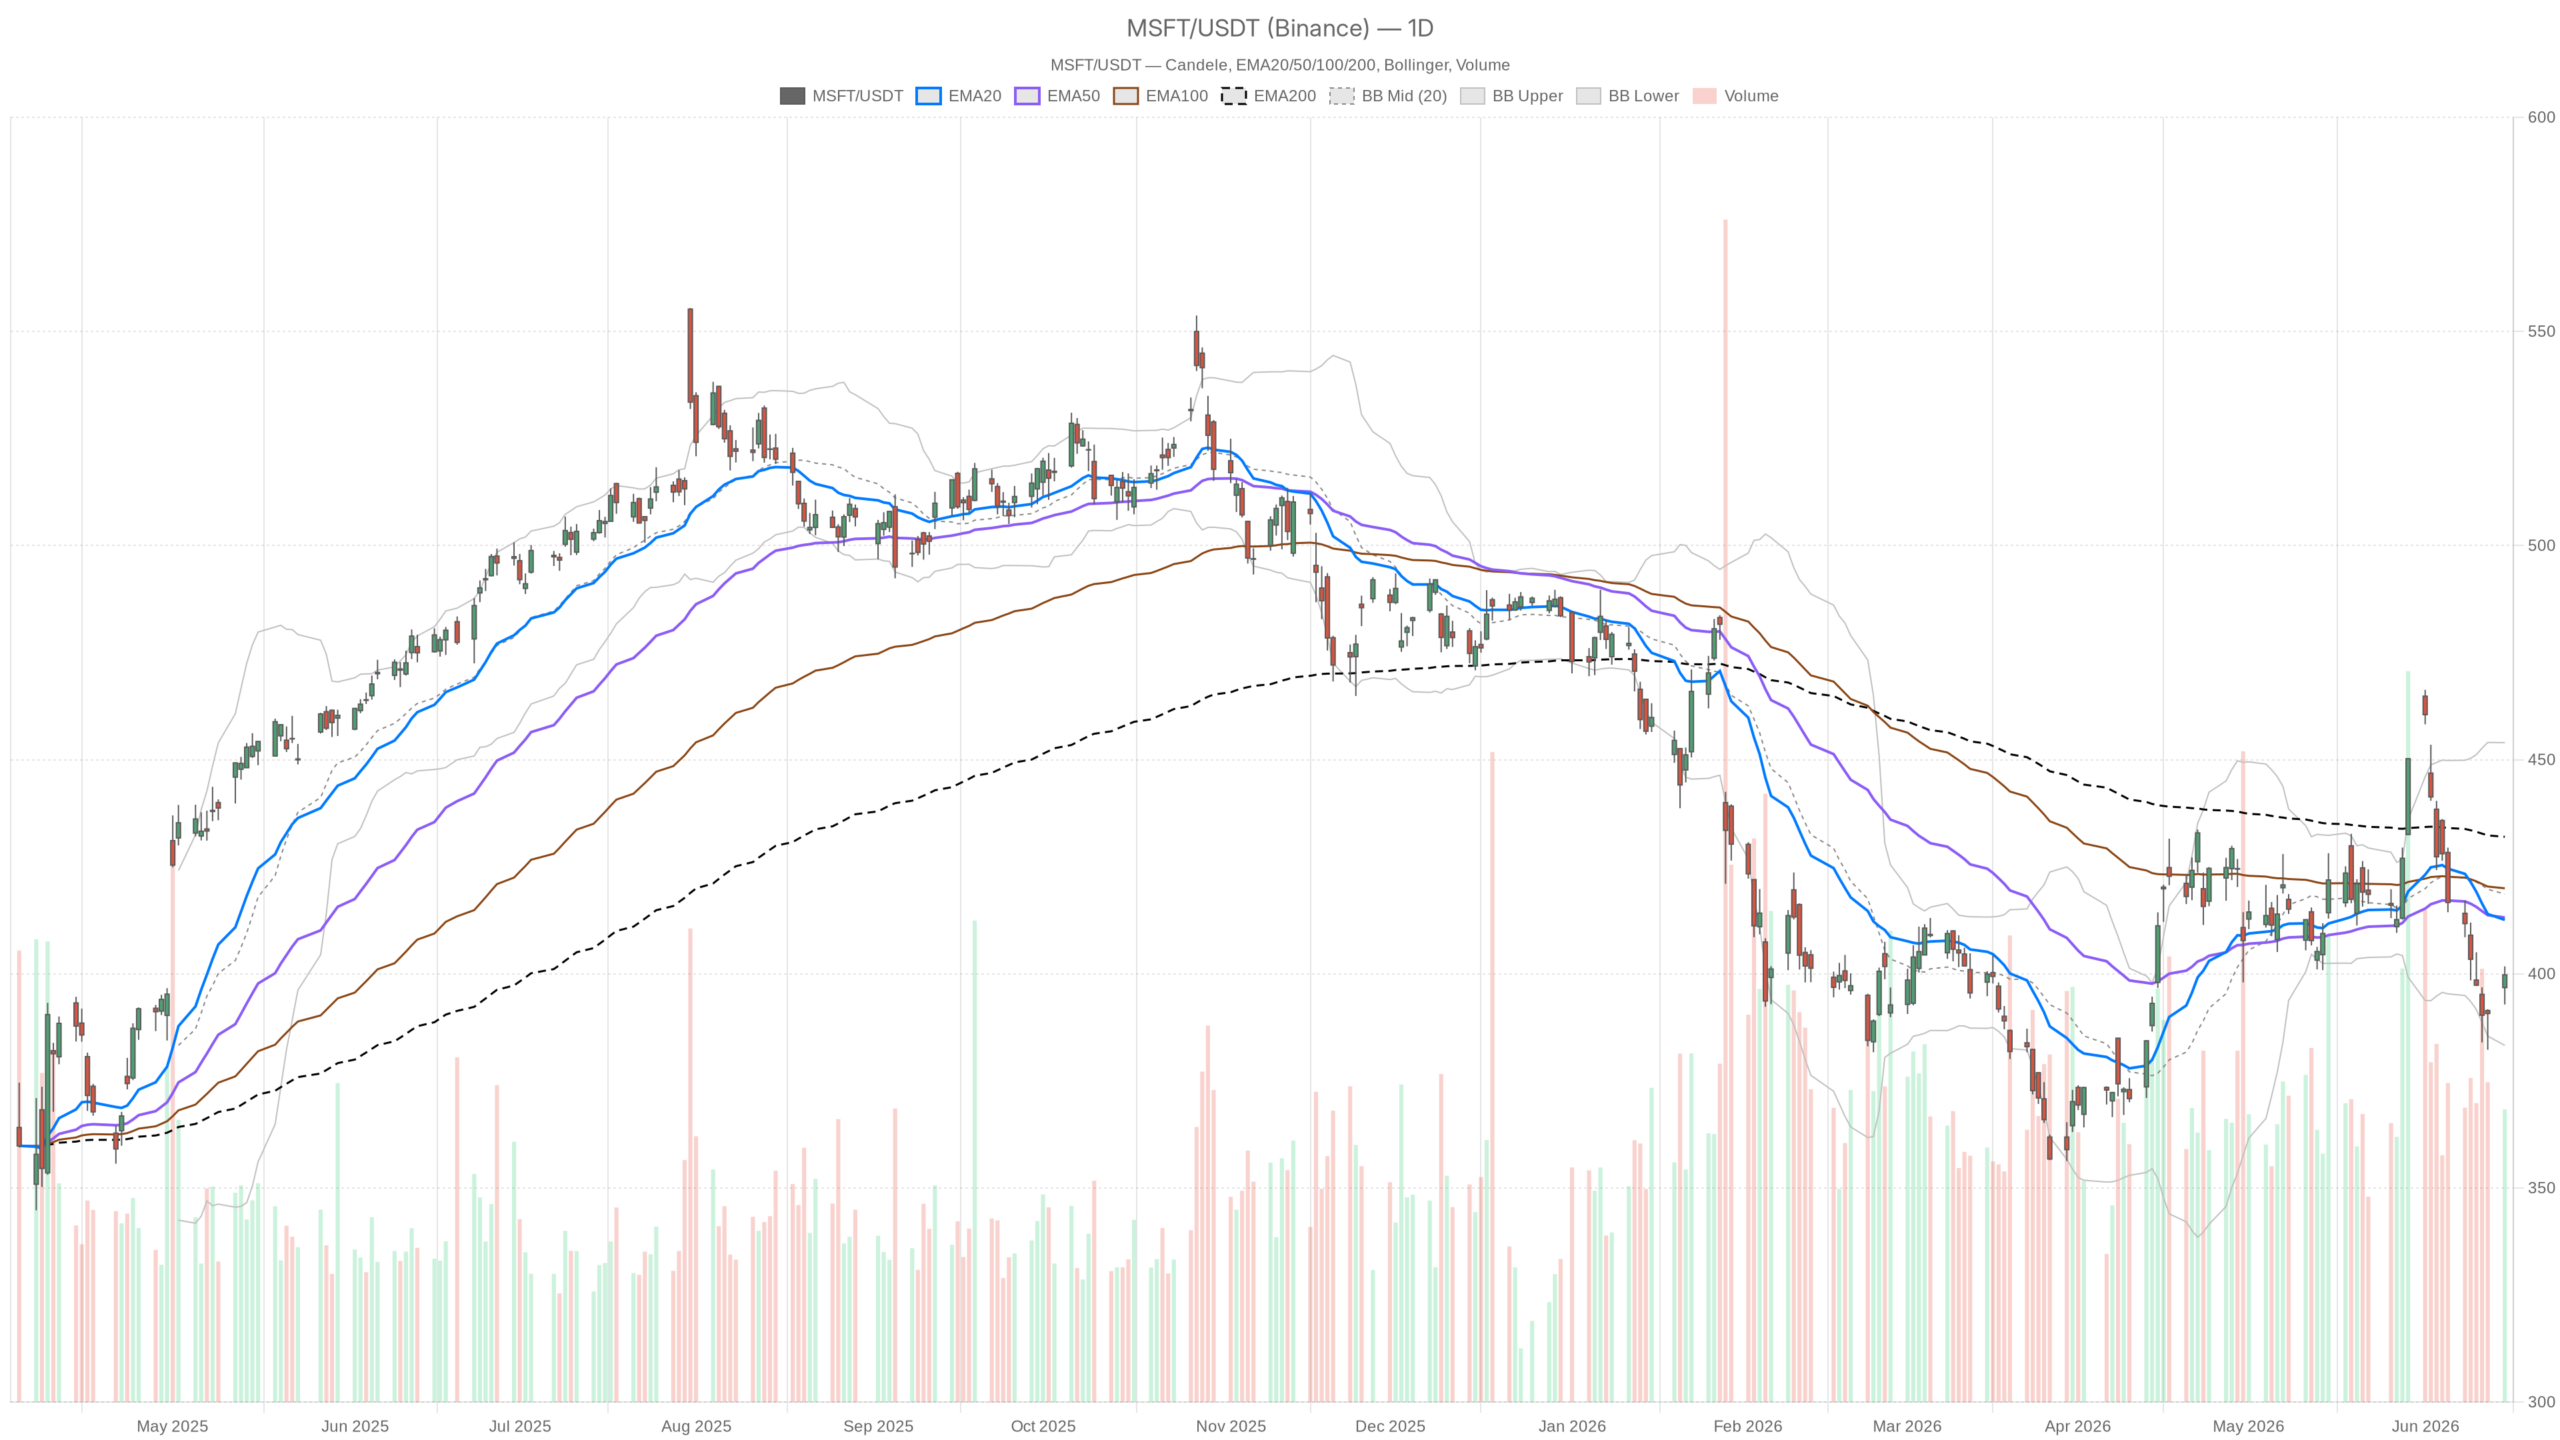 MSFT — daily chart with candlesticks, EMA20/EMA50 and volume.
Key takeaways
- MSFT closed at $399.76, below the EMA20, EMA50, and EMA200 — a classic bearish alignment on the daily chart.
- The daily MACD histogram at -4.75 confirms bearish momentum with no reversal signal in sight.
- Hourly RSI at 55.8 and a brewing MACD crossover hint at a potential short-term bounce.
- Daily support sits at $394.49; a breakdown could accelerate losses toward the lower Bollinger Band at $383.30.
- A shareholder class-action lawsuit alleging Azure cloud growth concealment adds fundamental risk to the technical weakness.
Daily Structure — A Bearish Framework
Microsoft stock’s daily structure is unequivocally bearish. Price sits below all three major moving averages, and momentum indicators confirm sellers remain firmly in control.
Moving Average Alignment Confirms Bearish Control
The daily chart shows a textbook bearish alignment. MSFT closed at $399.76, sitting below the EMA20 at $412.61, below the EMA50 at $413.16, and sharply below the EMA200 at $432.01. All three EMAs are stacked above price. This is not merely a pullback — it represents a sustained downtrend on the daily frame.
Meanwhile, the Bollinger Bands midline sits at $418.64. Price is trading beneath it, firmly in the lower half of the band. The lower band at $383.30 presents a credible downside target if selling pressure intensifies. The upper band at $453.99 is effectively irrelevant under current conditions.
Still, the daily ATR of 13.46 confirms meaningful daily range is being generated. Moves in either direction carry real weight. The pivot framework places support at $394.49 and resistance at $403.39, with the price pivot at $398.12. MSFT closed above the pivot — a mild positive, though well within the noise given the broader bearish context.
Momentum Indicators Show No Reversal Signal
On the momentum front, the daily RSI at 42.72 confirms persistent weakness. It drifts in bearish territory without reaching oversold conditions, suggesting sellers remain in control without any sign of capitulation.
The MACD reinforces this view with conviction. The MACD line sits at -4.67, the signal at 0.08, and the histogram at -4.75. That deeply negative histogram reading shows bearish momentum has not produced any meaningful cross or flattening to hint at reversal. Overall, the daily momentum picture leaves little ambiguity.
Hourly Timeframe — A Flicker of Recovery
The hourly chart offers a more nuanced picture. MSFT has reclaimed the hourly EMA20 at $396.03, and the RSI has climbed above 50 — however, overhead resistance from the EMA50 and EMA200 still caps any sustained upside.
Notably, the hourly regime is classified as neutral, reflecting a genuine short-term stabilization attempt. MSFT closed the last hourly candle at $399.97, sitting above the hourly EMA20 at $396.03. However, the hourly EMA50 at $402.57 and EMA200 at $414.41 remain above price, limiting the recovery’s ceiling.
The hourly MACD histogram at +2.03 provides the most encouraging signal at this timeframe. The MACD line at -0.45 is rising toward the signal line at -2.48 — a potential bullish crossover is brewing. That would confirm short-term buying momentum is building.
The hourly RSI at 55.8 supports this view. It has climbed above the neutral 50 level, suggesting buyers have regained some ground intraday. In contrast to the daily RSI’s bearish drift, the hourly RSI indicates short-term momentum has tilted modestly constructive.
At the same time, the hourly Bollinger Bands show price testing the upper band at $403.07. Breaking and holding above that level would signal a more sustained intraday move. The pivot levels on the 1H frame are tight: support at $398.61, resistance at $400.97. MSFT is currently sandwiched between these levels, reflecting the indecision embedded in the hourly frame.
15-Minute Context — Short-Term Buyers Are Active
Zooming in further, the 15-minute chart shows short-term buyers are engaged, though momentum is losing some steam near intraday resistance. The 15m RSI at 63.55 indicates elevated but not yet overbought conditions. Price is trading above the 15m EMA20 and EMA50, supporting the intraday bid.
However, the 15m MACD histogram at -0.37 is slightly negative, suggesting the immediate push may be fading. The 15m Bollinger Band upper bound sits at $401.16 — very close to current price. A stall near this level would not be surprising. With ATR on the 15m frame at just 1.05, moves in this window remain small and choppy. This is purely execution territory, not a frame for directional conviction.
The News Overhang — Litigation and Strategic Risk
Fundamental pressure is compounding the bearish technical picture. A proposed shareholder class-action lawsuit alleges Microsoft defrauded investors by concealing a slowdown in Azure cloud growth and failing to disclose the scale of AI infrastructure spending commitments. Reuters and Yahoo Finance both covered the development on June 15.
This is not a trivial headline. Azure is Microsoft’s most critical growth engine. Any credible narrative of decelerating cloud growth — real or alleged — carries multiple re-rating risk for Microsoft stock. Shares are already down roughly 14–15% over the past year, and this litigation adds another layer of uncertainty to near-term sentiment.
On the other side, Wells Fargo analyst Michael Turrin maintained a Buy rating with a $650 price target as recently as June 11. That target implies substantial upside from current levels. The bull case rests on Microsoft’s positioning in the AI infrastructure cycle — the so-called “neo cloud boom” thesis. At $400, some argue the stock now represents a value opportunity rather than a growth premium name.
Bullish Scenario
For Microsoft stock to flip bullish, buyers must reclaim the $403–$413 zone with a decisive daily close above the EMA20 at $412.61. Alongside that, the daily MACD histogram — currently at -4.75 — would need to begin flattening as a prerequisite for any trend change.
On the fundamental side, any positive resolution or early dismissal of the shareholder lawsuit, or a strong Azure update from management, could serve as a catalyst. The $650 Wells Fargo target suggests institutional conviction in the long-term AI infrastructure story has not evaporated. If macro conditions remain supportive, MSFT could attract buyers at these levels given the valuation compression of recent months.
Bearish Scenario
The bearish case requires far less work. A failure to hold the $394.49 daily support opens the door toward the lower Bollinger Band at $383.30 — a zone that would represent a significant further drawdown. The daily MACD shows no signs of turning, and with all EMAs pointing south, the default path remains lower unless buyers step in with force.
The litigation risk amplifies the downside case. If discovery reveals evidence supporting the Azure slowdown narrative, earnings estimates could face downward revision. That would invalidate the value-stock thesis being floated by bulls. In that scenario, even the $383 Bollinger Band floor may not hold for long.
Positioning and Uncertainty
Microsoft stock presents a conflicted setup right now. The daily bearish trend is the dominant fact, yet the hourly recovery creates tactical complexity for both sides. Traders pressing the short side should be mindful of the hourly recovery signals and the litigation-driven headline risk that could trigger sharp, reactive moves.
Meanwhile, those looking at the long side face the weight of a daily trend that has not yet shown any technical evidence of turning. Volatility, as measured by the daily ATR of 13.46, remains meaningful — whipsaws are possible in either direction. Overall, the daily bearish bias is the primary framework. The intraday recovery is a development worth watching, but not yet a reason to fight the dominant trend.
FAQ
Is Microsoft stock in a bearish or bullish trend?
The daily chart clearly favors the bears. MSFT closed at $399.76 on June 15, below the EMA20 ($412.61), EMA50 ($413.16), and EMA200 ($432.01). The daily MACD histogram at -4.75 and RSI at 42.72 confirm bearish momentum. However, a short-term recovery is unfolding on the hourly timeframe, creating a tactical conflict between the dominant daily trend and the intraday bounce.
What are the key support and resistance levels for MSFT?
On the daily chart, immediate support sits at $394.49, with the lower Bollinger Band at $383.30 serving as the next downside target. Resistance is clustered in the $403–$413 zone, with the daily pivot resistance at $403.39 and the EMA20 at $412.61 representing the first meaningful levels bulls need to reclaim. The upper Bollinger Band at $453.99 is currently out of reach.
How is the shareholder lawsuit affecting Microsoft stock?
A proposed class-action lawsuit alleges Microsoft concealed a slowdown in Azure cloud growth and the scale of AI infrastructure spending. Since Azure is Microsoft’s most critical growth engine, any credible slowdown narrative carries re-rating risk. The stock is already down roughly 14–15% over the past year, and the litigation adds another layer of uncertainty that could amplify downside if evidence supports the allegations.
What would signal a bullish reversal for Microsoft stock?
A bullish reversal would require a decisive daily close above the $403–$413 zone, specifically reclaiming the EMA20 at $412.61. The daily MACD histogram would also need to begin flattening from its current -4.75 reading. A positive catalyst — such as dismissal of the lawsuit or a strong Azure update from management — could accelerate the recovery, particularly given the stock’s compressed valuation at current levels.
Disclaimer: This article is for informational purposes only and does not constitute financial advice, an investment recommendation, or a solicitation to buy or sell any financial instrument or cryptocurrency. The analysis provided is not indicative of future results. Investing in crypto assets and financial markets carries a high risk of capital loss. Always do your own research (DYOR) and consult a qualified financial advisor before making any decision.
Article produced with the assistance of artificial intelligence and reviewed by the editorial team.


 English (US) ·