
 1 month ago
75
1 month ago
75

Microsoft stock closed at $381.58 on July 23, sitting below its EMA20, EMA50, and EMA200 — a rare bearish alignment across all three major moving averages. With earnings approaching and AI spending concerns mounting, the technical backdrop reinforces a cautious stance across every timeframe.
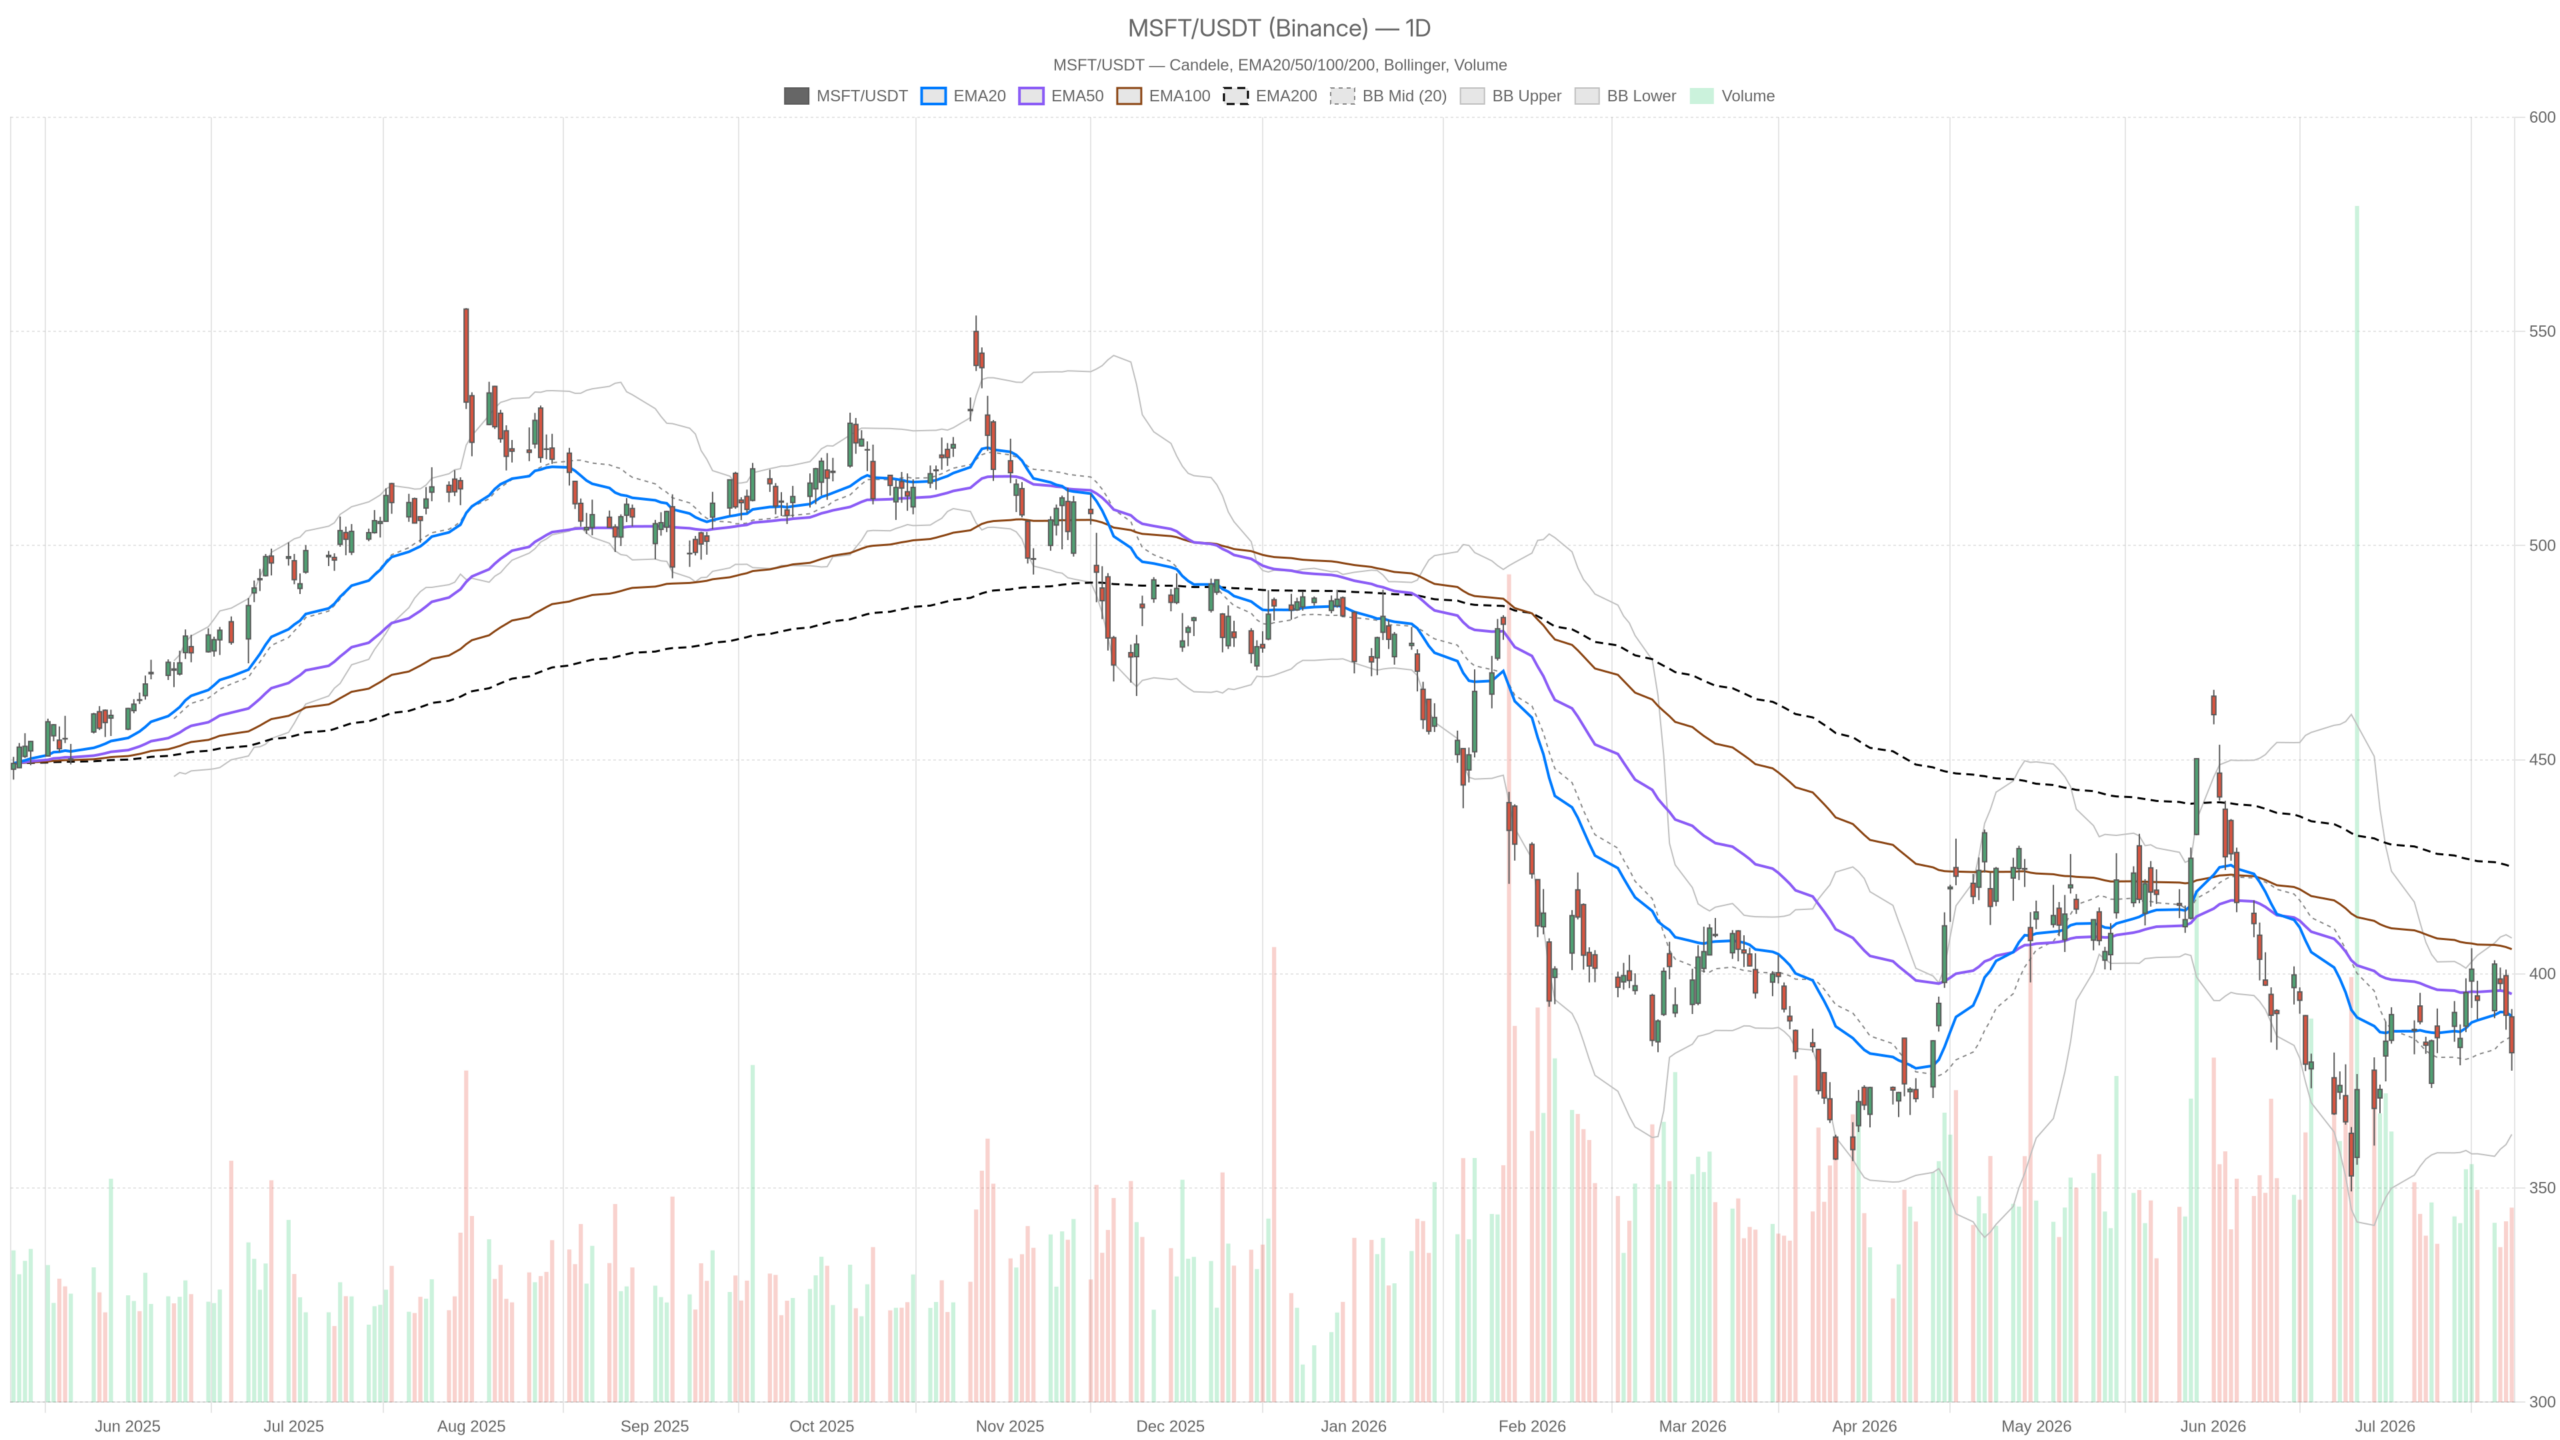 MSFT — daily chart with candlesticks, EMA20/EMA50 and volume.
Key takeaways
- Microsoft stock closed at $381.58 on July 23, below its EMA20, EMA50, and EMA200 — a full bearish moving average stack with no dynamic support above current price.
- The daily RSI at 44.67 signals no buyer urgency, while the daily ATR of 11.2 confirms elevated volatility heading into earnings.
- Hourly MACD remains in active bearish expansion with no signs of convergence, reinforcing intraday selling pressure.
- MSFT is down roughly 17% year-to-date, with AI spending concerns threatening to overshadow even strong earnings results.
- The bearish case remains the path of least resistance unless price reclaims the EMA20 near $390 with sustained volume.
Daily Bias: A Bearish Structure for Microsoft Stock
The daily chart confirms Microsoft stock is in a clear downtrend, with no meaningful dynamic support above current price. MSFT closed the July 23 session at $381.58 after printing a high of $391.78 and a low of $377.40. That intraday range of more than $14 signals meaningful volatility and sellers stepping in at resistance.
Price sits below the EMA20 at $390.13, the EMA50 at $395.31, and well below the EMA200 at $425.01. This full bearish stack is one of the clearest trend signals available. It means no dynamic support exists above current price on the daily chart.
Momentum Confirms Drift, Not Reversal
The daily RSI at 44.67 is neither oversold nor in recovery mode. It reflects a market drifting lower with no urgency from buyers. Meanwhile, the MACD line at -0.47 sits fractionally below the signal line at -1.69, but the histogram has turned positive at 1.22. This suggests the pace of selling is slowing, though it is not a reversal signal.
The Bollinger Bands reinforce the bearish context. The midline sits at $385.45, comfortably above the current close. Price is hugging the lower half of the band, consistent with a stock under sustained pressure. The upper band at $408.38 and lower band at $362.52 define a wide range, while the daily ATR of 11.2 confirms large swings are the norm.
Pivot Levels Reinforce the Negative Bias
Pivot analysis adds further weight to the bearish thesis. The pivot point at $383.59 sits above current price, with resistance at R1 of $389.77 and support at S1 of $375.39. Notably, with price already below the pivot, the default bias remains negative unless buyers reclaim $383.59 with conviction.
Hourly Timeframe: Microsoft Stock Bears Remain Firmly in Control
The 1H chart actively reinforces the daily bearish picture. At 15:30 on July 23, MSFT was trading at $381.43 on the hourly close. Every key moving average sits above price — the EMA20 at $387.41, EMA50 at $390.61, and EMA200 at $391.62 — all compressed within a tight range and stacked bearishly.
The 1H RSI at 32.93 is approaching oversold territory. This does not mean price must bounce, but short-side momentum is stretched and the risk of a technical snap-back is growing. However, traders should not confuse a low RSI with a buy signal — context matters, and the broader regime remains bearish.
MACD Expansion Drives Intraday Selling
On the hourly MACD, the picture is unambiguous. The line at -4.17 is below the signal at -3.26, and the histogram at -0.91 shows the divergence is still widening. This is an active sell signal on the intraday structure, with no signs of convergence yet.
The 1H Bollinger midline at $389.22 is well above price. At the same time, price at $381.43 is approaching the lower band at $374.98, indicating a band-squeeze situation. The hourly ATR of 3.6 suggests moves of that magnitude per hour are entirely plausible in the current environment.
15-Minute Context: A Minor Stabilization, Not a Reversal
Zooming into the 15-minute chart, the picture softens slightly at the edges. The 15m close at $381.43 shows price trading near its EMA20 of $381.71. The MACD histogram turned positive at 0.39, and RSI at 44.06 sits in a neutral zone — suggesting a very short-term consolidation around the $380–$382 range.
However, the 15m EMA50 at $385.17 and EMA200 at $390.44 both loom overhead as resistance. Any short-term stabilization is occurring within a larger bearish structure. The Bollinger Bands on the 15m are narrow — upper at $382.60, lower at $378.63 — which means price is coiling and a breakout could follow in either direction.
The Fundamental Overhang: AI Spending and Earnings Risk
Fundamental concerns are reinforcing Microsoft stock’s technical weakness. MSFT is down roughly 17% year-to-date, according to retail investor commentary cited across recent coverage. Despite that decline, Morgan Stanley has described the current valuation as “highly attractive.” That divergence between institutional conviction and price action is worth noting.
On the other hand, concerns about soaring AI spending could overshadow even strong earnings results. A preview from Yahoo Finance noted explicitly that massive AI expenditure may send shares lower regardless of top-line performance. This creates an asymmetric risk setup — strong earnings may not reverse the trend, but a miss could accelerate the decline.
Retail investors on Reddit have been buying the dip, citing intact fundamentals. Still, Seeking Alpha has flagged persistent ROIC lag and surging depreciation from short-lived assets as risks to GAAP margins and premium multiples. These concerns align with the broader “dead money” narrative that has plagued the stock for an extended period.
Bullish Scenario: What Would Have to Change for Microsoft Stock
A bullish reversal for Microsoft stock requires a clear sequence of technical milestones — starting with reclaiming the daily pivot at $383.59 and holding it. Beyond that, a push through the EMA20 at $390 with sustained volume would start to rebuild a constructive technical structure.
Earnings results that both beat expectations and provide reassuring guidance on AI capital spending could serve as the catalyst. Morgan Stanley’s “highly attractive” valuation call would gain traction quickly in that scenario. The MACD histogram turning positive on the daily — already nudging in that direction — would confirm that selling pressure is genuinely fading.
In that case, the upper Bollinger Band at $408.38 becomes a medium-term target, with the EMA50 at $395.31 as the first real test.
Bearish Scenario: What Would Confirm the Downtrend
The bearish case remains the path of least resistance for Microsoft stock. A failure to hold the $379–$380 zone on any near-term bounce would keep the S1 support level at $375.39 squarely in focus. Below that, the lower Bollinger Band at $362.52 on the daily chart becomes the next structural reference.
Notably, an earnings miss — or a beat paired with aggressive AI capex commentary — could trigger a sharp gap lower, given the current daily ATR of 11.2. The hourly MACD, still in active bearish expansion, would accelerate with any fresh negative catalyst. A drop in 1H RSI below 30 would signal that the selling wave is intensifying, not stabilizing.
Positioning and Outlook
Overall, Microsoft stock presents a technically deteriorated setup heading into what could be a pivotal earnings catalyst. Every major timeframe registers a bearish regime. The daily structure is broken, the hourly confirms the slide, and even the 15-minute chart’s minor stabilization is contained within a bearish envelope.
Volatility is elevated. With a daily ATR of 11.2 and an earnings release approaching, large price swings in either direction should be expected. The risk-reward for new long positions is uncomfortable at current levels — near-term bounces are possible, but the broader structure does not support a trend reversal call yet. Bears retain the structural advantage until Microsoft reclaims meaningful dynamic resistance above $390.
FAQ
Is Microsoft stock in a bearish trend right now?
Yes. As of July 23, MSFT closed at $381.58, below its EMA20 at $390.13, EMA50 at $395.31, and EMA200 at $425.01 — a full bearish moving average stack across the daily chart. The daily RSI at 44.67 further confirms no buyer urgency is present.
What key levels should traders watch for Microsoft stock?
The daily pivot at $383.59 is the first level to reclaim for any bullish signal. Support sits at S1 of $375.39, with the lower daily Bollinger Band at $362.52 as the next structural reference. Resistance above lies at the EMA20 of $390.13 and the EMA50 of $395.31.
How could earnings affect Microsoft stock’s technical setup?
With a daily ATR of 11.2, the earnings release could trigger sharp moves in either direction. However, AI spending concerns may overshadow even strong results, creating asymmetric risk. A beat may not reverse the trend, but a miss or cautious capex outlook could accelerate declines toward the $362.52 lower Bollinger Band.
What would signal a bullish reversal for Microsoft stock?
A sustained reclaim of the daily pivot at $383.59, followed by a push through the EMA20 at $390.13 with volume, would start rebuilding a constructive structure. The daily MACD histogram has already turned positive, hinting that selling pressure is decelerating — but confirmation requires price action to follow.
Disclaimer: This article is for informational purposes only and does not constitute financial advice, an investment recommendation, or a solicitation to buy or sell any financial instrument or cryptocurrency. The analysis provided is not indicative of future results. Investing in crypto assets and financial markets carries a high risk of capital loss. Always do your own research (DYOR) and consult a qualified financial advisor before making any decision.
Article produced with the assistance of artificial intelligence and reviewed by the editorial team.






 English (US) ·