
 3 hours ago
14
3 hours ago
14
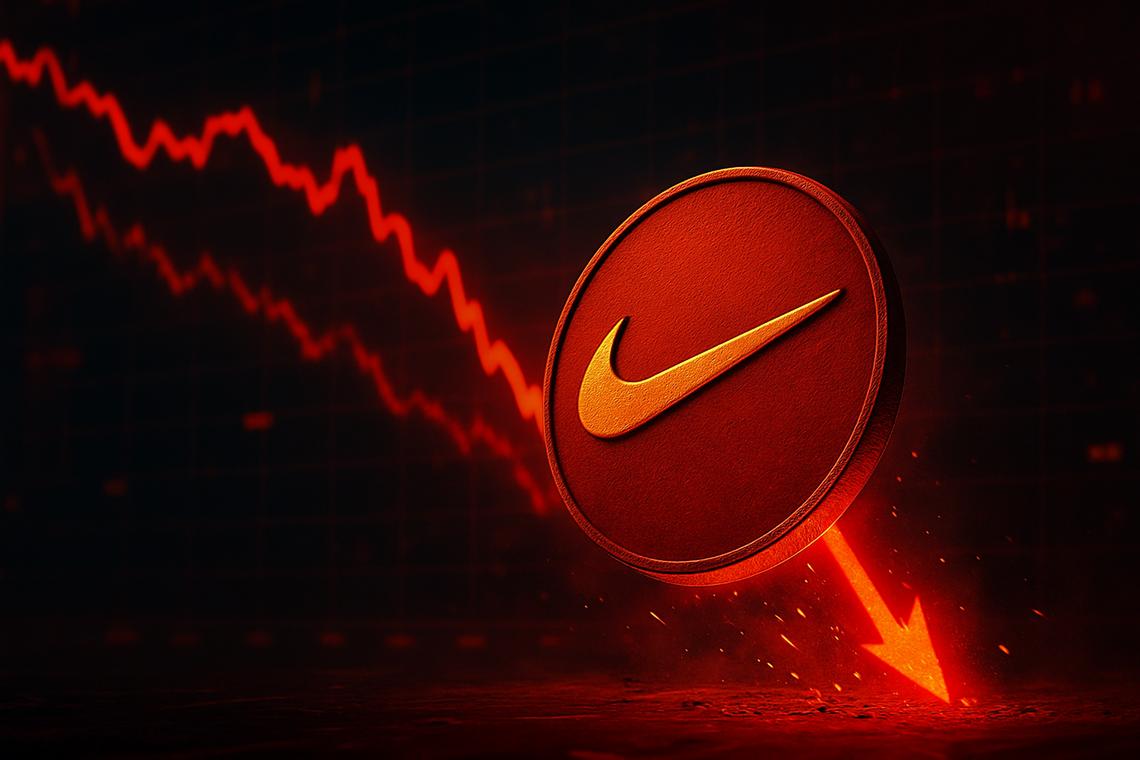
Nike, Inc. stock is under heavy technical pressure after closing at $39.09 on August 17, a 12-year low. The daily chart shows price trading well below every major moving average, confirming a structural downtrend that has been building for a long time.
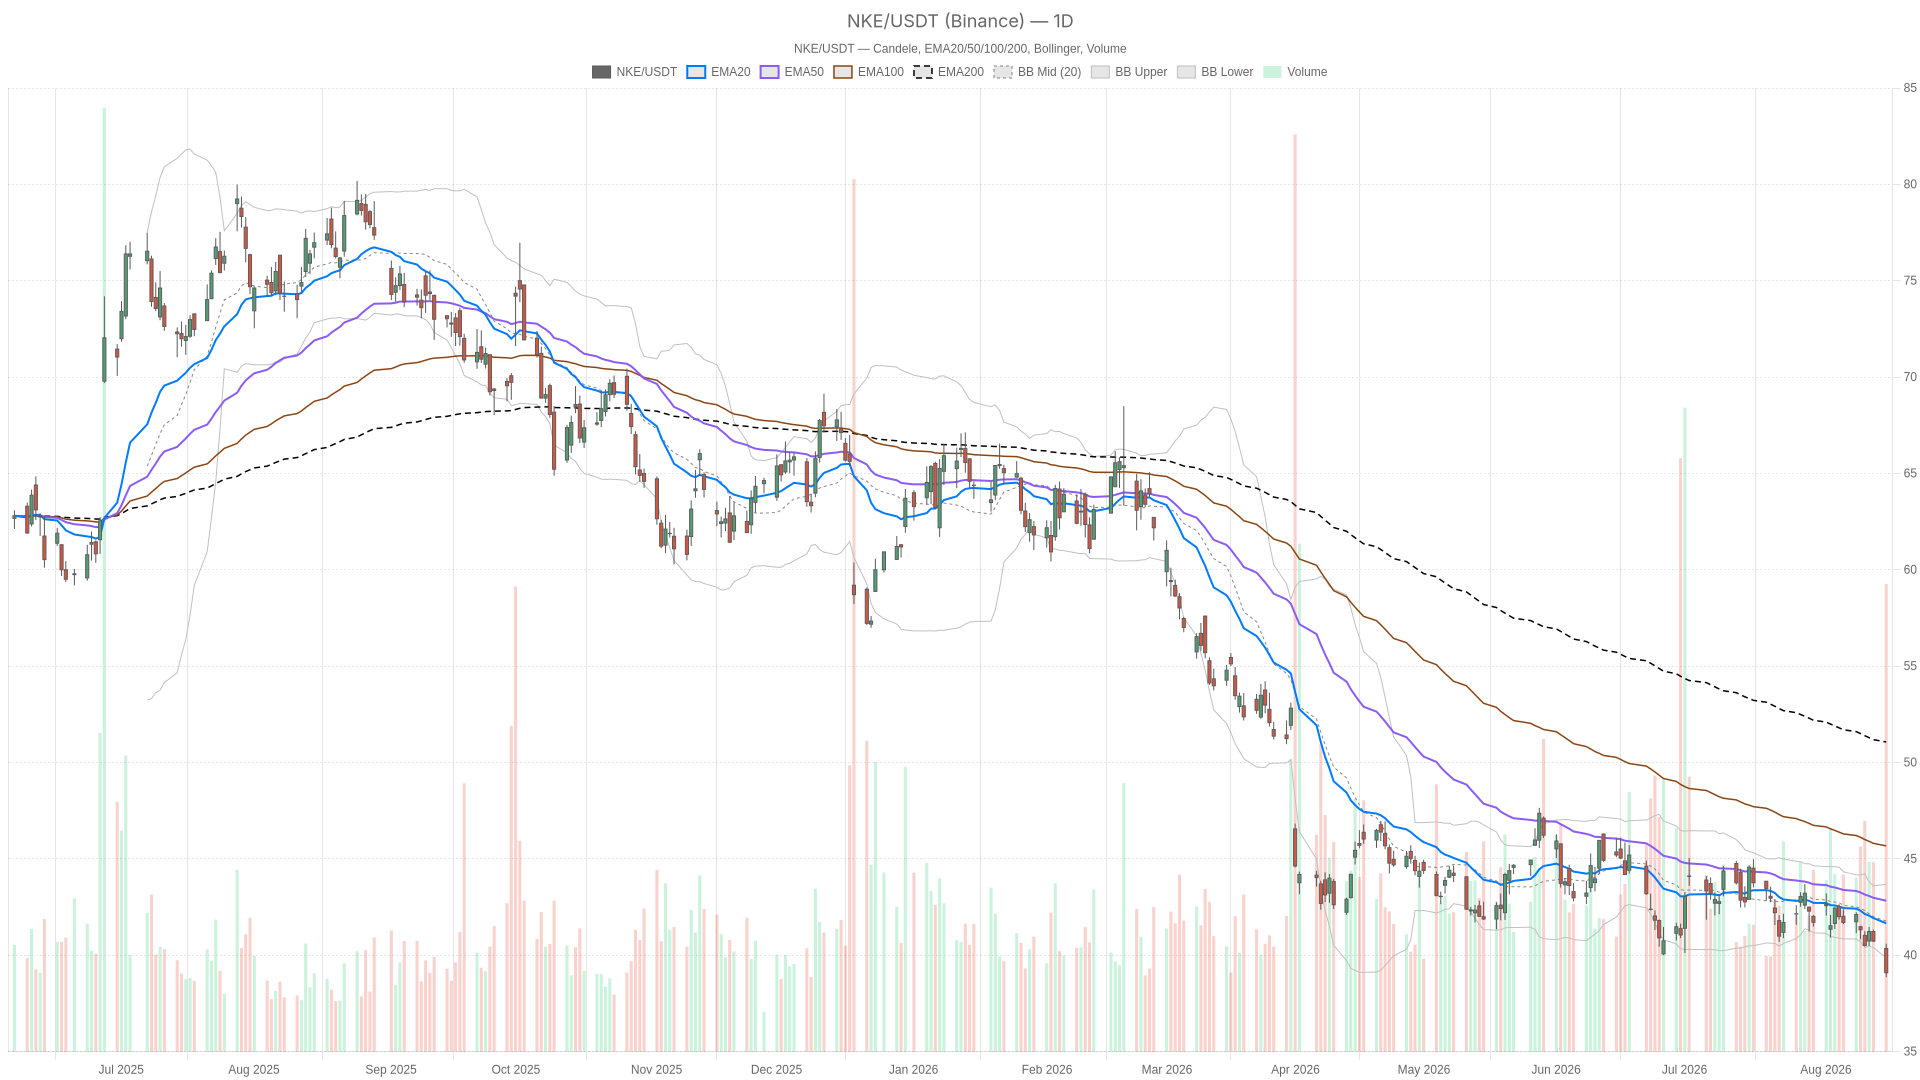 NKE — daily chart with candlesticks, EMA20/EMA50 and volume.
Key takeaways
- Nike, Inc. stock closed at $39.09 on August 17, a 12-year low.
- Price trades below the daily lower Bollinger Band at 39.87.
- Daily RSI14 at 35.68 is weak but not yet oversold.
- Hourly RSI14 at 26.07 signals oversold conditions inside the bearish structure.
- Daily pivot support sits at 38.43, with resistance at 40.17.
Nike, Inc. Stock: Daily Chart Confirms a Bearish Regime
The daily chart confirms a bearish regime for Nike, Inc. stock (NKE). Momentum is negative across the board. The MACD line sits at -0.70 against a signal line of -0.48, producing a histogram of -0.22. That gap is widening, not narrowing, which shows sellers remain in control.
Still, daily RSI14 reads 35.68. That is weak, but not oversold in the classic sub-30 sense. This matters because there is still room for price to fall further. An extreme reading has not yet arrived to attract mean-reversion buyers.
Meanwhile, Bollinger Bands reinforce the same picture. The daily mid-band stands at 41.78, with the upper band at 43.69 and the lower band at 39.87. Closing at 39.09 means Nike stock is trading below its own lower band. That is a signal of a genuine breakdown, not a routine dip toward support.
Volatility has also expanded. The daily ATR14 reads 1.19, an elevated figure showing larger daily swings than usual. Pivot levels sit at a pivot point of 39.52, resistance at 40.17 (R1) and support at 38.43 (S1). Losing S1 would open the door to an extension of the down-move with limited technical cushion underneath.
Hourly Timeframe: Oversold Conditions Inside a Bearish Structure
The hourly chart confirms the bearish bias but adds one nuance. It shows genuinely oversold conditions. Hourly RSI14 has dropped to 26.07, which sits in classic oversold territory.
However, the moving averages still tell a bearish story. EMA20 (40.08), EMA50 (40.76) and EMA200 (42.00) are all stacked above the 39.08 close. This keeps the hourly regime bearish as well.
That creates the first real conflict in this setup. The daily trend says sellers remain dominant and daily RSI has not reached extreme levels. The hourly trend agrees on direction but shows momentum already stretched into oversold territory. In practice, that combination often precedes short-lived relief bounces inside a broader downtrend, rather than a reversal of the primary trend itself.
The hourly MACD remains negative as well. Its line reads -0.55 against a signal of -0.40, producing a histogram of -0.15. This is consistent with the daily reading. Bollinger Bands on the 1H frame show a mid-band of 40.36, an upper band of 42.09 and a lower band of 38.64. Price at 39.08 trades near the lower band but has not broken decisively below it.
At the same time, hourly ATR14 sits at 0.34, and pivot levels are tight. The pivot point reads 39.12, R1 at 39.21 and S1 at 39.00. That narrow band suggests the market is consolidating just above short-term support after the sharp daily breakdown.
15-Minute Execution: Short-Term Stabilization Within a Downtrend
The 15-minute chart softens slightly without changing the underlying bias. It shows early signs of short-term stabilization. EMA20 (39.26), EMA50 (39.80) and EMA200 (40.79) remain stacked bearish, and the regime tag stays bearish.
Yet RSI14 has ticked up to 36.96. Notably, the MACD histogram has flipped positive at 0.08, even though the MACD line (-0.25) remains below its signal line (-0.33). That is a subtle but real short-term signal. It suggests selling pressure is easing slightly at the intraday level.
Meanwhile, Bollinger Bands on the 15m chart are tight, with a mid-band of 39.11, an upper band of 39.39 and a lower band of 38.83. ATR14 has compressed to 0.16. Low volatility inside a downtrend often precedes a directional move. Given the higher-timeframe bias, that move is more likely to resolve lower than higher, though it is not guaranteed.
Bullish Scenario for Nike Stock
A bullish case for Nike stock exists, but it currently relies more on narrative than hard technical confirmation. Recent coverage has highlighted management changes under CEO Elliott Hill. It also points to a renewed focus on innovation and retail partnerships. One Seeking Alpha contributor cited that reasoning for buying Nike shares after a six-year hiatus.
Still, for the bullish scenario to gain traction technically, Nike stock would need to reclaim the daily pivot at 39.52. It would then need to push back above R1 at 40.17. A recovery above the hourly EMA20 near 40.08 would also signal that short-term sellers are losing control.
Daily RSI is not yet oversold. Therefore, any bounce would need real follow-through. Ideally, the daily MACD histogram would narrow to confirm the move as more than a relief rally.
Bearish Scenario and What Would Invalidate the Bullish Case
The bearish scenario is the one supported by nearly every timeframe right now. Nike shares sit at a 12-year low. As Seeking Alpha noted, the stock is not yet technically oversold on a daily basis. That means there is room for further downside before the market reaches an extreme reading.
In addition, Yahoo Finance coverage has flagged continued weakness across North America, direct-to-consumer and international segments. Wall Street skepticism also lingers over the pace of Hill’s turnaround plan.
Technically, a break below daily S1 at 38.43 would confirm continuation. This is especially true with the daily close already trading under the lower Bollinger Band. On the hourly chart, losing the 39.00 support level would remove the last short-term cushion. Should the 15-minute stabilization fail to hold above 39.00, the broader bearish structure would likely reassert itself quickly.
Closing Take
Overall, Nike, Inc. stock remains in a clearly bearish daily regime. The hourly chart confirms that structure even as RSI flags oversold conditions that could fuel short-term bounces. The 15-minute chart shows early signs of stabilization, but that context is useful only for timing, not for changing the broader bias.
Elevated ATR readings on the daily and hourly charts point to continued volatility ahead. Pivot levels around 38.43 to 40.17 will likely define the next directional decision. At the same time, market comparisons between Nike and Lululemon underscore a broader retail sector reassessment. Both names are grappling with weaker demand and steep declines.
The signals are mixed. Hourly RSI is oversold, while the daily trend has not yet reached extreme territory. Given that tension, patience matters more than conviction in either direction.
FAQ
Is Nike, Inc. stock oversold right now?
On the daily chart, RSI14 reads 35.68, which is weak but not oversold. The hourly RSI14, however, has dropped to 26.07, which sits in classic oversold territory.
What is the key support level for Nike stock?
Daily support S1 sits at 38.43. On the hourly chart, the 39.00 level aligns with S1 and acts as the last short-term cushion.
What would a bullish scenario require?
Nike stock would need to reclaim the daily pivot at 39.52 and push back above R1 at 40.17. A recovery above the hourly EMA20 near 40.08 would also help confirm short-term seller exhaustion.
Why is Nike stock under pressure?
Yahoo Finance coverage has flagged continued weakness across North America, direct-to-consumer and international segments. Wall Street also remains skeptical over the pace of CEO Elliott Hill’s turnaround plan.
Disclaimer: This article is for informational purposes only and does not constitute financial advice, an investment recommendation, or a solicitation to buy or sell any financial instrument or cryptocurrency. The analysis provided is not indicative of future results. Investing in crypto assets and financial markets carries a high risk of capital loss. Always do your own research (DYOR) and consult a qualified financial advisor before making any decision.
Article produced with the assistance of artificial intelligence and reviewed by the editorial team.








 English (US) ·