
 1 month ago
47
1 month ago
47
Nokia stock has surged 127% YTD in 2026, but the rally now faces its first genuine test. The daily chart registers a neutral regime, yet intraday structure has already turned bearish. This is no longer a clean breakout — it is consolidation under growing pressure.
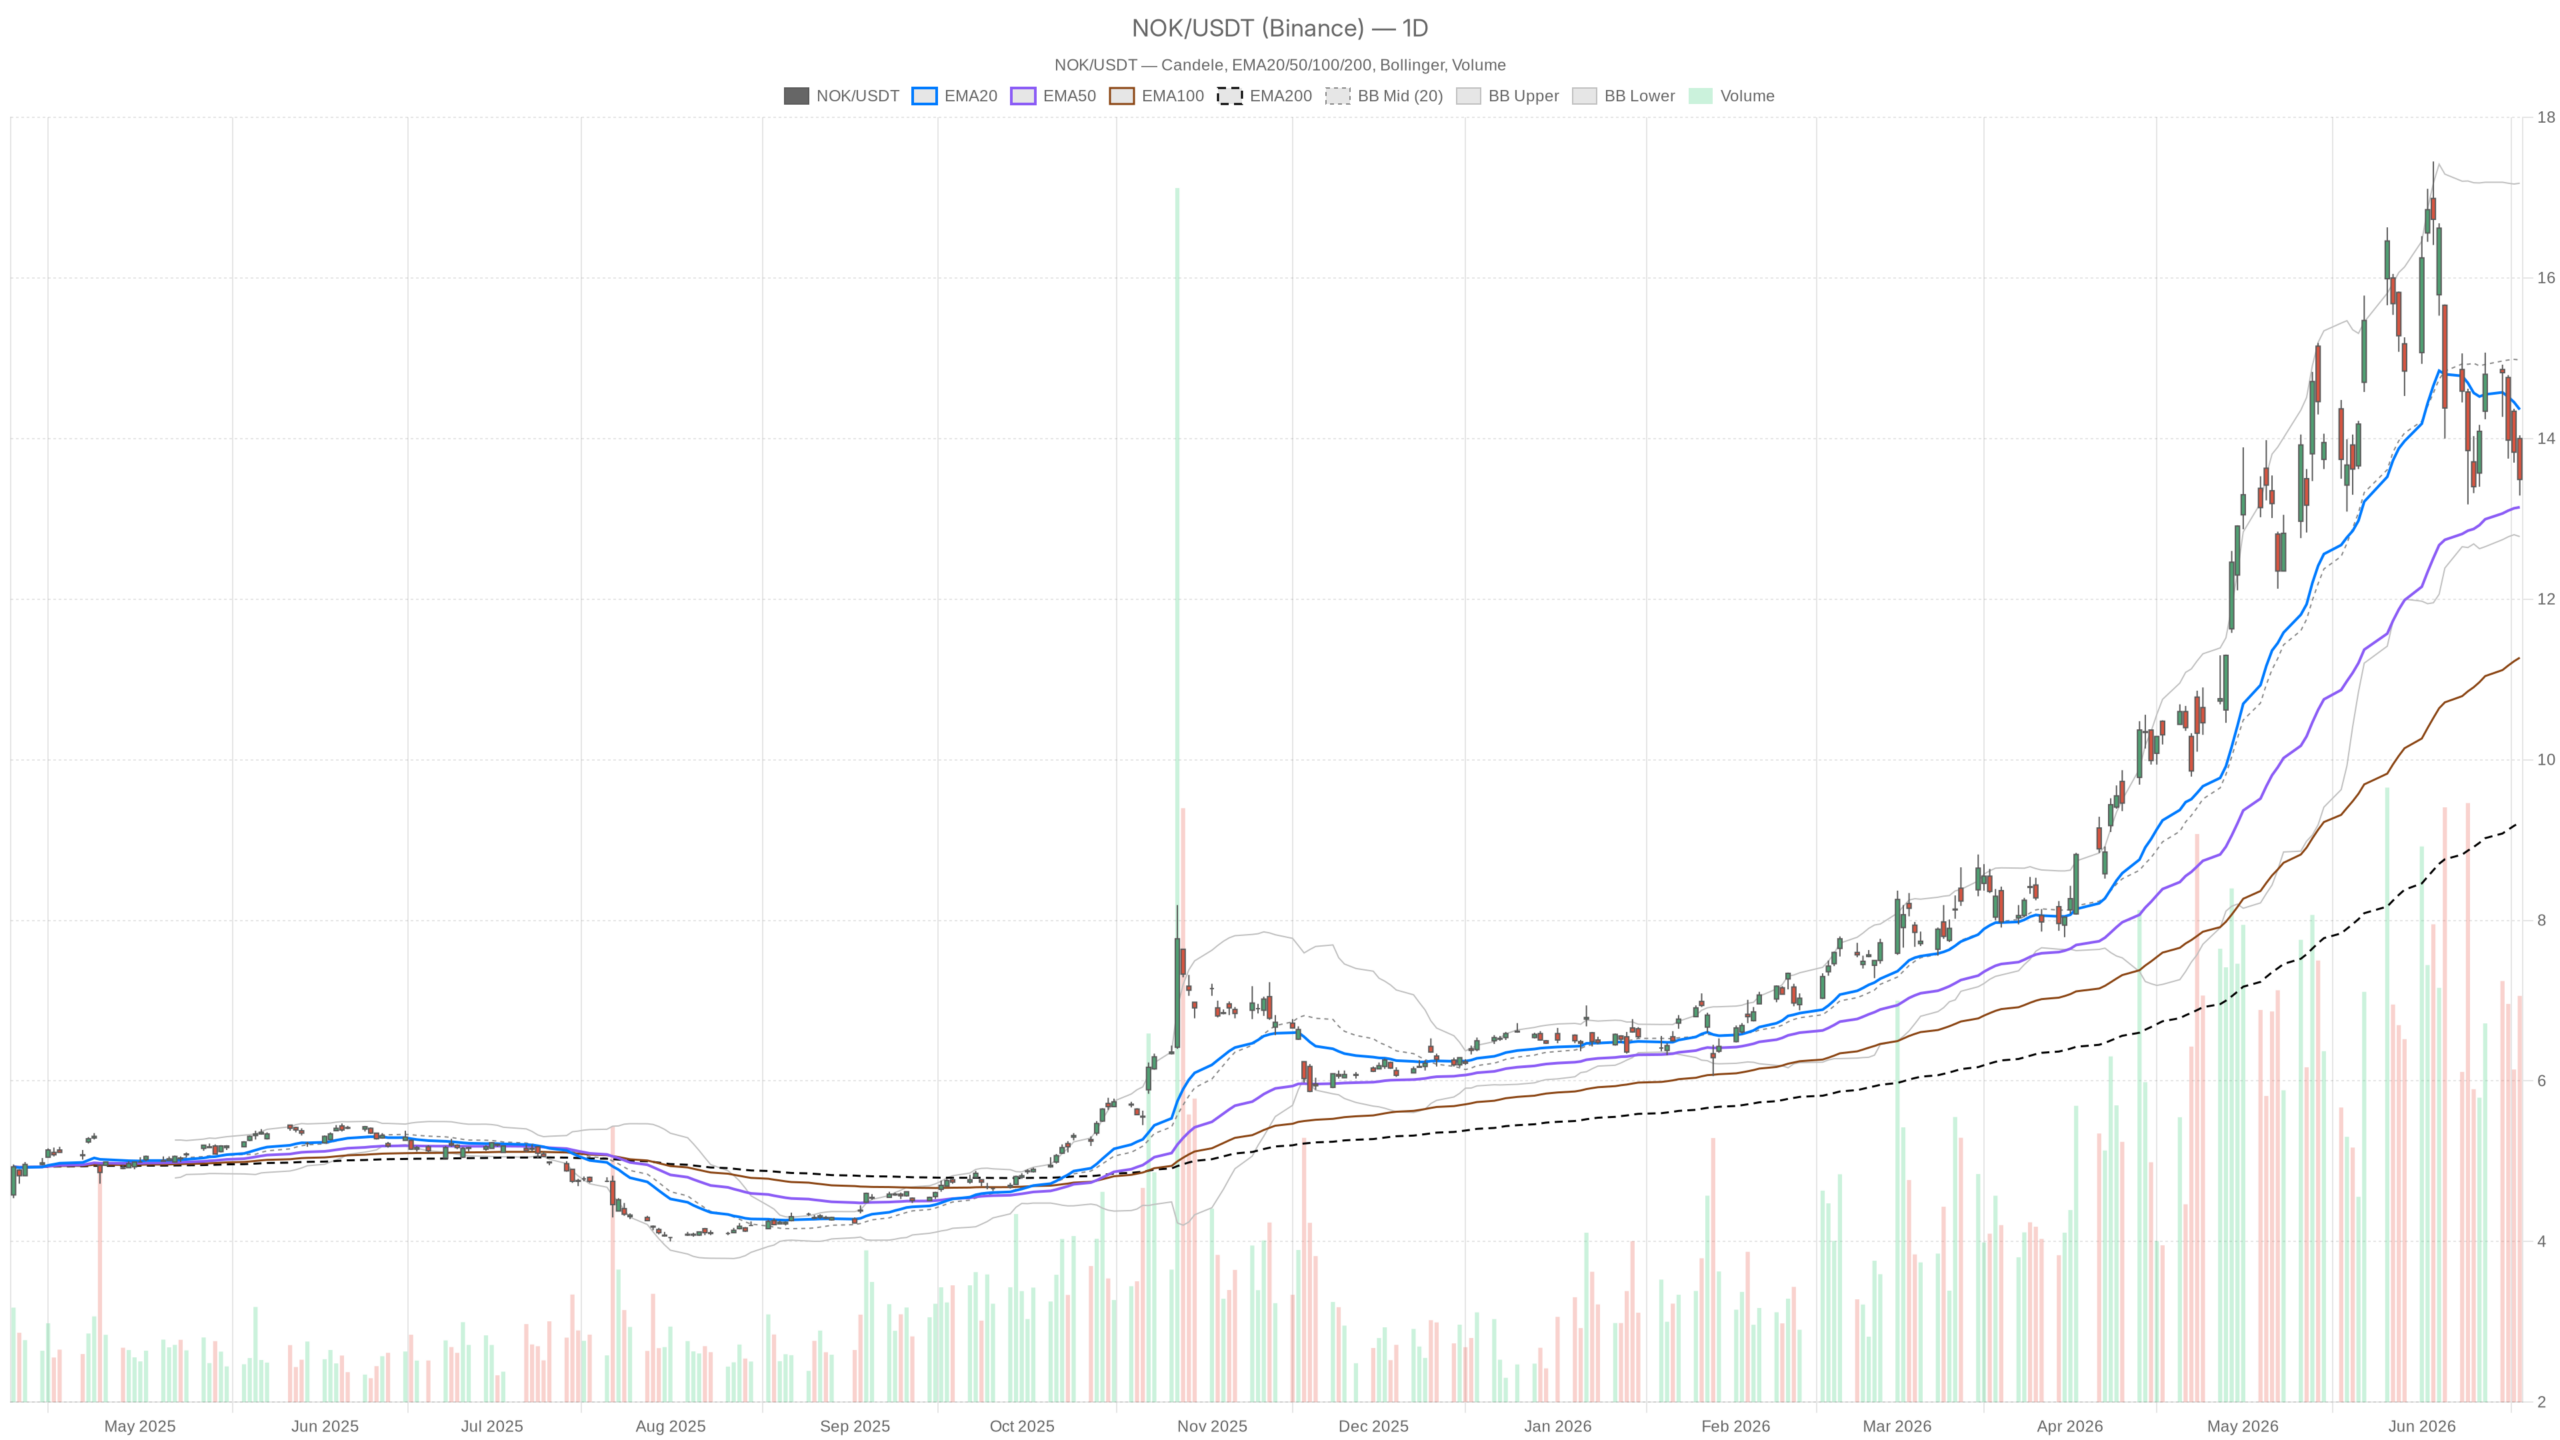 NOK — daily chart with candlesticks, EMA20/EMA50 and volume.
Key takeaways
- Nokia stock has rallied 127% year-to-date but is losing momentum, with the daily MACD turning decisively negative.
- The June 18 close at $13.49 marked a sharp intraday rejection from the $14.00 handle — a near-4% session selloff.
- The hourly chart shows a fully bearish EMA alignment, with price trading below all three key moving averages.
- Critical support clusters at $13.15–$13.17; a breakdown would expose the lower Bollinger Band at $12.78.
- JPMorgan sees a potential 50% upside, citing Nokia’s competitive positioning in the optical networking market.
The fundamental backdrop remains constructive. Nokia announced a $30 million investment to expand its advanced semiconductor packaging facility in Allentown, Pennsylvania. The move is projected to generate $500 million in economic impact and add 500 jobs. The company is also pushing into agentic AI, upgrading its Network Services Platform to automate multi-vendor IP networks.
JPMorgan has flagged a potential 50% upside target, citing Nokia’s strong product lineup and competitive positioning in the optical market. These are real catalysts, not noise. However, strong narratives and strong price action do not always move in lockstep.
Daily Timeframe: Neutral Regime, But Cracks Are Emerging
Nokia stock’s daily chart remains in a neutral regime, but fading momentum and a bearish intraday rejection suggest the rally is losing steam. The question is whether this marks a healthy pause or the start of something deeper.
Momentum Indicators Flash Warning Signs
The daily RSI at 45.32 reflects a market that has lost its bullish conviction without yet turning outright bearish. It sits in neutral territory — not oversold, not overbought. This means there is room to fall further before any mean-reversion bounce becomes technically compelling.
Meanwhile, the MACD tells a clearer story. The histogram stands at -0.33, with the MACD line at 0.14 below the signal at 0.47. This confirms momentum has shifted negative on the daily chart. The line crossing below the signal is typically the first mechanical confirmation that a pullback is underway — not just noise.
Volatility and Support Levels
On June 18, Nokia stock closed at $13.49 — well off the session open of $14.00 and the daily high of $14.04. That intraday rejection is meaningful. The stock opened near a key level and sold off roughly 4% within the session. Such a candle, regardless of the broader trend, puts sellers firmly in control of the short-term narrative.
The EMA stack tells a layered story. The EMA200 sits at $9.22, far below current prices, confirming the long-term uptrend remains intact and powerful. The EMA50 at $13.15 provides near-term structural support. However, the EMA20 at $14.36 is already above the current close of $13.49. That crossover serves as a warning: the short-term trend is rolling over, even as medium and long-term trends stay supportive.
Bollinger Bands place the midline at $14.98, with NOK trading well below at $13.49. The lower band at $12.78 acts as a natural gravitational target if selling pressure accelerates. The daily ATR of $1.08 represents roughly 8% of current price. This confirms NOK is a volatile name where sharp intraday reversals are entirely normal. The pivot point stands at $13.61, with R1 at $13.92 and S1 at $13.17. The close below the pivot adds another near-term negative signal.
Hourly Timeframe Confirms Bearish Control
The hourly chart for Nokia stock is explicitly bearish, with all three key EMAs aligned against the price and no credible reversal signal in sight. Short-term traders have little reason to fight this configuration.
EMA Stack Confirms Bearish Alignment
The EMA20 on the hourly sits at $13.79, the EMA50 at $14.12, and the EMA200 at $14.17. At $13.48, the current price trades below all three. This is full bearish EMA alignment — a configuration that typically signals sustained near-term selling rather than a temporary dip.
The hourly RSI at 38.52 is approaching oversold territory without quite reaching it. In a trending move lower, this kind of RSI reading can persist for extended periods. It is not a buy signal. It simply indicates the stock is under sustained stress.
Range Compression and Downside Risk
The hourly MACD shows the line at -0.22 below the signal at -0.19, with the histogram at -0.04. The negative histogram narrowing slightly hints at a potential deceleration in selling pace — but not a reversal. At best, it suggests the hourly decline may be pausing rather than accelerating sharply.
Meanwhile, the hourly Bollinger Bands place the midline at $13.79, with the stock printing near the lower band at $13.32. Trading close to the lower band in a bearish regime often marks continuation rather than reversal. The hourly ATR of $0.28 defines the typical move per session. The pivot structure — PP at $13.53, R1 at $13.58, S1 at $13.43 — shows the stock is compressed in an extremely tight range. Any break below $13.43 on the hourly would expose $13.17, the daily S1, as the next logical support level.
15-Minute Chart — Execution Context Only
The 15-minute chart remains bearish and offers execution context only — it provides no reversal signal for Nokia stock. Traders looking for an entry will find no encouragement here.
On the 15-minute timeframe, the MACD histogram has ticked marginally positive at 0.03. This micro-level signal is not enough to call a reversal. It suggests only that the immediate sell momentum has briefly stabilized — not that buyers have regained control. The 15m RSI at 45.81 sits in neutral territory. Price remains below all key EMAs, including the EMA200 at $14.21. The burden of proof remains squarely on the bulls. They must recapture $13.58 before anything changes intraday.
Bullish Scenario — What Nokia Stock Needs to Recover
For Nokia stock to resume its uptrend, it must reclaim $13.61 and push decisively above the EMA20 at $14.36. Without that, any bounce should be treated as corrective within a short-term downtrend.
Nokia’s fundamental story is strong enough to justify a recovery. A bullish scenario requires the stock to reclaim and hold above the daily pivot at $13.61, then push through R1 at $13.92. Above that, the EMA20 at $14.36 represents the real line in the sand. A close back above $14.36 on the daily timeframe would signal that the pullback was a healthy consolidation — not a trend reversal.
The Pennsylvania semiconductor expansion, JPMorgan’s bullish order acceleration thesis, and the AI network automation narrative all provide fundamental fuel. If broader market sentiment turns risk-on, Nokia is positioned to benefit disproportionately. Its exposure to optical networks and enterprise AI infrastructure gives it unique leverage to improving macro conditions.
Bearish Scenario — Where the Thesis Breaks Down
The bearish case for Nokia stock hinges on a break below the critical $13.15–$13.17 support cluster. Losing this zone would expose $12.78 as the next downside target and potentially invite a deeper retracement.
Those two levels — the daily S1 at $13.17 and the EMA50 at $13.15 — are separated by just two cents. That creates a meaningful support cluster. A breakdown here would be technically damaging after the 127% YTD surge. Profit-taking at scale remains a real risk. The daily MACD in negative histogram territory, the EMA20 now acting as overhead resistance, and the fully bearish hourly structure all point in the same direction. The path of least resistance is still lower in the short term. The stock would need a clear catalyst to reverse this momentum — not just a stabilization in price.
Overall, Nokia sits at a technically fragile point despite exceptional longer-term performance. The daily regime is neutral, but the weight of evidence argues for caution in the near term. The fundamental story has not broken, yet the price structure needs to stabilize before that story can drive the stock meaningfully higher again.
FAQ
Is Nokia stock still in a long-term uptrend?
Yes. The EMA200 at $9.22 sits far below the current price, confirming the long-term uptrend remains intact despite near-term weakness and the bearish hourly structure.
What is the key support level for Nokia stock right now?
The critical support cluster sits at $13.15–$13.17, where the daily S1 and the EMA50 converge. Below that, the next downside target is the lower Bollinger Band at $12.78.
What would signal a bullish reversal for Nokia stock?
A daily close above the EMA20 at $14.36 would signal that the pullback was a healthy consolidation rather than a trend reversal. Until then, the short-term bias remains bearish.
Why did Nokia stock drop sharply on June 18?
The stock opened near the psychologically important $14.00 level and faced heavy selling pressure throughout the session, closing at $13.49 for a near-4% intraday decline — a clear rejection candle.
Disclaimer: This article is for informational purposes only and does not constitute financial advice, an investment recommendation, or a solicitation to buy or sell any financial instrument or cryptocurrency. The analysis provided is not indicative of future results. Investing in crypto assets and financial markets carries a high risk of capital loss. Always do your own research (DYOR) and consult a qualified financial advisor before making any decision.
Article produced with the assistance of artificial intelligence and reviewed by the editorial team.


 English (US) ·