
 7 months ago
103
7 months ago
103
Bitcoin has fallen back below the $90,000 level after another wave of selling pressure and leveraged long liquidations, signaling that the market remains firmly on the defensive. Each attempt to stabilize has failed, with sellers quickly overwhelming buyers and forcing price into lower ranges. Fear and uncertainty continue to dominate sentiment, and traders increasingly prepare for the possibility of a deeper continuation of the downtrend as volatility accelerates.
Amid this weakness, a new signal has started to attract the attention of analysts. According to Maartunn, one of the market’s most respected on-chain researchers, old coins are waking up again. Dormant Bitcoin—specifically coins held for 3 to 5 years—has begun to move on-chain in noticeable spikes. Historically, this type of activity often reflects structural shifts in holder behavior, appearing during periods of stress, capitulation, or preparation for major market pivots.
While the direction of these moves is not always immediately clear, rising activity among long-dormant coins adds another layer of complexity to an already fragile market. As Bitcoin continues to struggle below $90K, the behavior of these older coins could help determine whether the current decline deepens—or sets the stage for a larger transition ahead.
Old Coins Start Moving as Macro Fear Collides With Policy Shifts
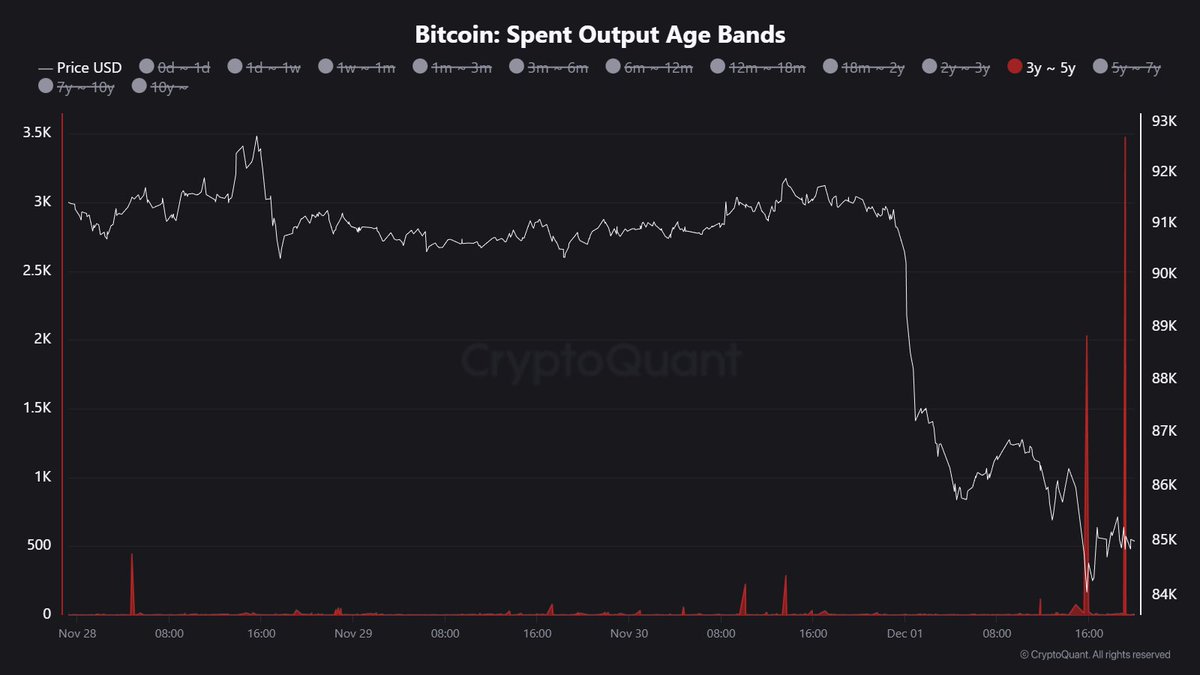
Maartunn highlights a notable rise in activity from 3–5 year-old Bitcoin, a cohort that typically remains dormant unless underlying conditions begin to shift. The Spent Output Age Bands show a sharp increase, jumping from 2,030 BTC earlier today to 3,475 BTC now. These spikes rarely happen randomly. Maartunn believes that “something’s stirring beneath the surface,” suggesting that long-term holders may be reacting to mounting market stress—or positioning ahead of a potential macro inflection.
This awakening of older coins comes at a moment filled with conflicting signals. Fear around Tether’s reserves has resurfaced, sparking concerns over liquidity stability across exchanges. At the same time, renewed headlines about a supposed China Bitcoin ban have circulated again, despite offering no new policy information. These narratives have added yet another layer of anxiety to an already fragile market.
Yet the macro backdrop also contains reasons for cautious optimism. The Federal Reserve is expected to bring its quantitative tightening (QT) program to an end, and markets are increasingly pricing in a potential interest rate cut this December. Such shifts historically improve liquidity conditions and support risk assets.
As long-term coins begin to move and macro forces pull in opposite directions, Bitcoin enters a complex environment—one that could precede either deeper volatility or the early stages of a larger transition.
Bitcoin Struggles to Recover as Daily Trend Remains Firmly Bearish
Bitcoin’s 1-day chart continues to reveal a market trapped in a strong downtrend, with price failing to reclaim the key moving averages that define higher-timeframe momentum. After breaking down from the $115,000 region, BTC plunged directly through the 50 SMA, 100 SMA, and 200 SMA, creating a steep momentum shift that sellers still control.
The current price action around $86,000–$88,000 shows hesitation and a lack of follow-through from bulls, even after several attempts to rebound.

The 50 and 100 SMAs both slope sharply downward, confirming a bearish trend structure. Meanwhile, the 200 SMA has flattened and now sits far above price, highlighting just how aggressive and extended the selloff has been. BTC continues to print lower highs and lower lows, a clear signal that the market has not yet found a stable bottom.
Volume spikes on major red candles suggest a mix of forced liquidations and panic-driven exits, while green candles remain smaller and less convincing. The lack of strong buy volume shows that investors remain cautious despite the magnitude of the correction.
If Bitcoin fails to break back above $92,000–$95,000, the market risks another leg lower. The next major supports sit between $80,000 and $78,000, levels that align with previous consolidation zones. For now, the bears still control the daily trend.
Featured image from ChatGPT, chart from TradingView.com


 English (US) ·