
 3 months ago
45
3 months ago
45
Bitcoin (BTC) price slipped below $67,000 on April 2, falling roughly 2.8% in 24 hours and extending a year-to-date decline that now sits near 23%.
The drop aligns with a pattern forming across on-chain data, chart structure, and derivatives positioning. One cohort of buyers has been steadily exiting since January, and the technical picture now threatens a 14% correction if a key level fails.
The Buyers Who Bought the Dip Are Walking Away
BTC HODL waves, an on-chain metric that tracks the percentage of supply held by different age groups, show a dramatic exit from the 1-month to 3-month cohort. On January 14, this group controlled 14.67% of the total Bitcoin supply. By April 1, that figure had fallen to 8.19%, its lowest reading of the year.
The decline accelerated in two distinct waves. The first came post mid-February, when the cohort’s share dropped from 12.72% on February 15 to single digits by February 22. A second aggressive leg down arrived around March 22, when the reading slipped from 9.44% and continued falling without recovery.
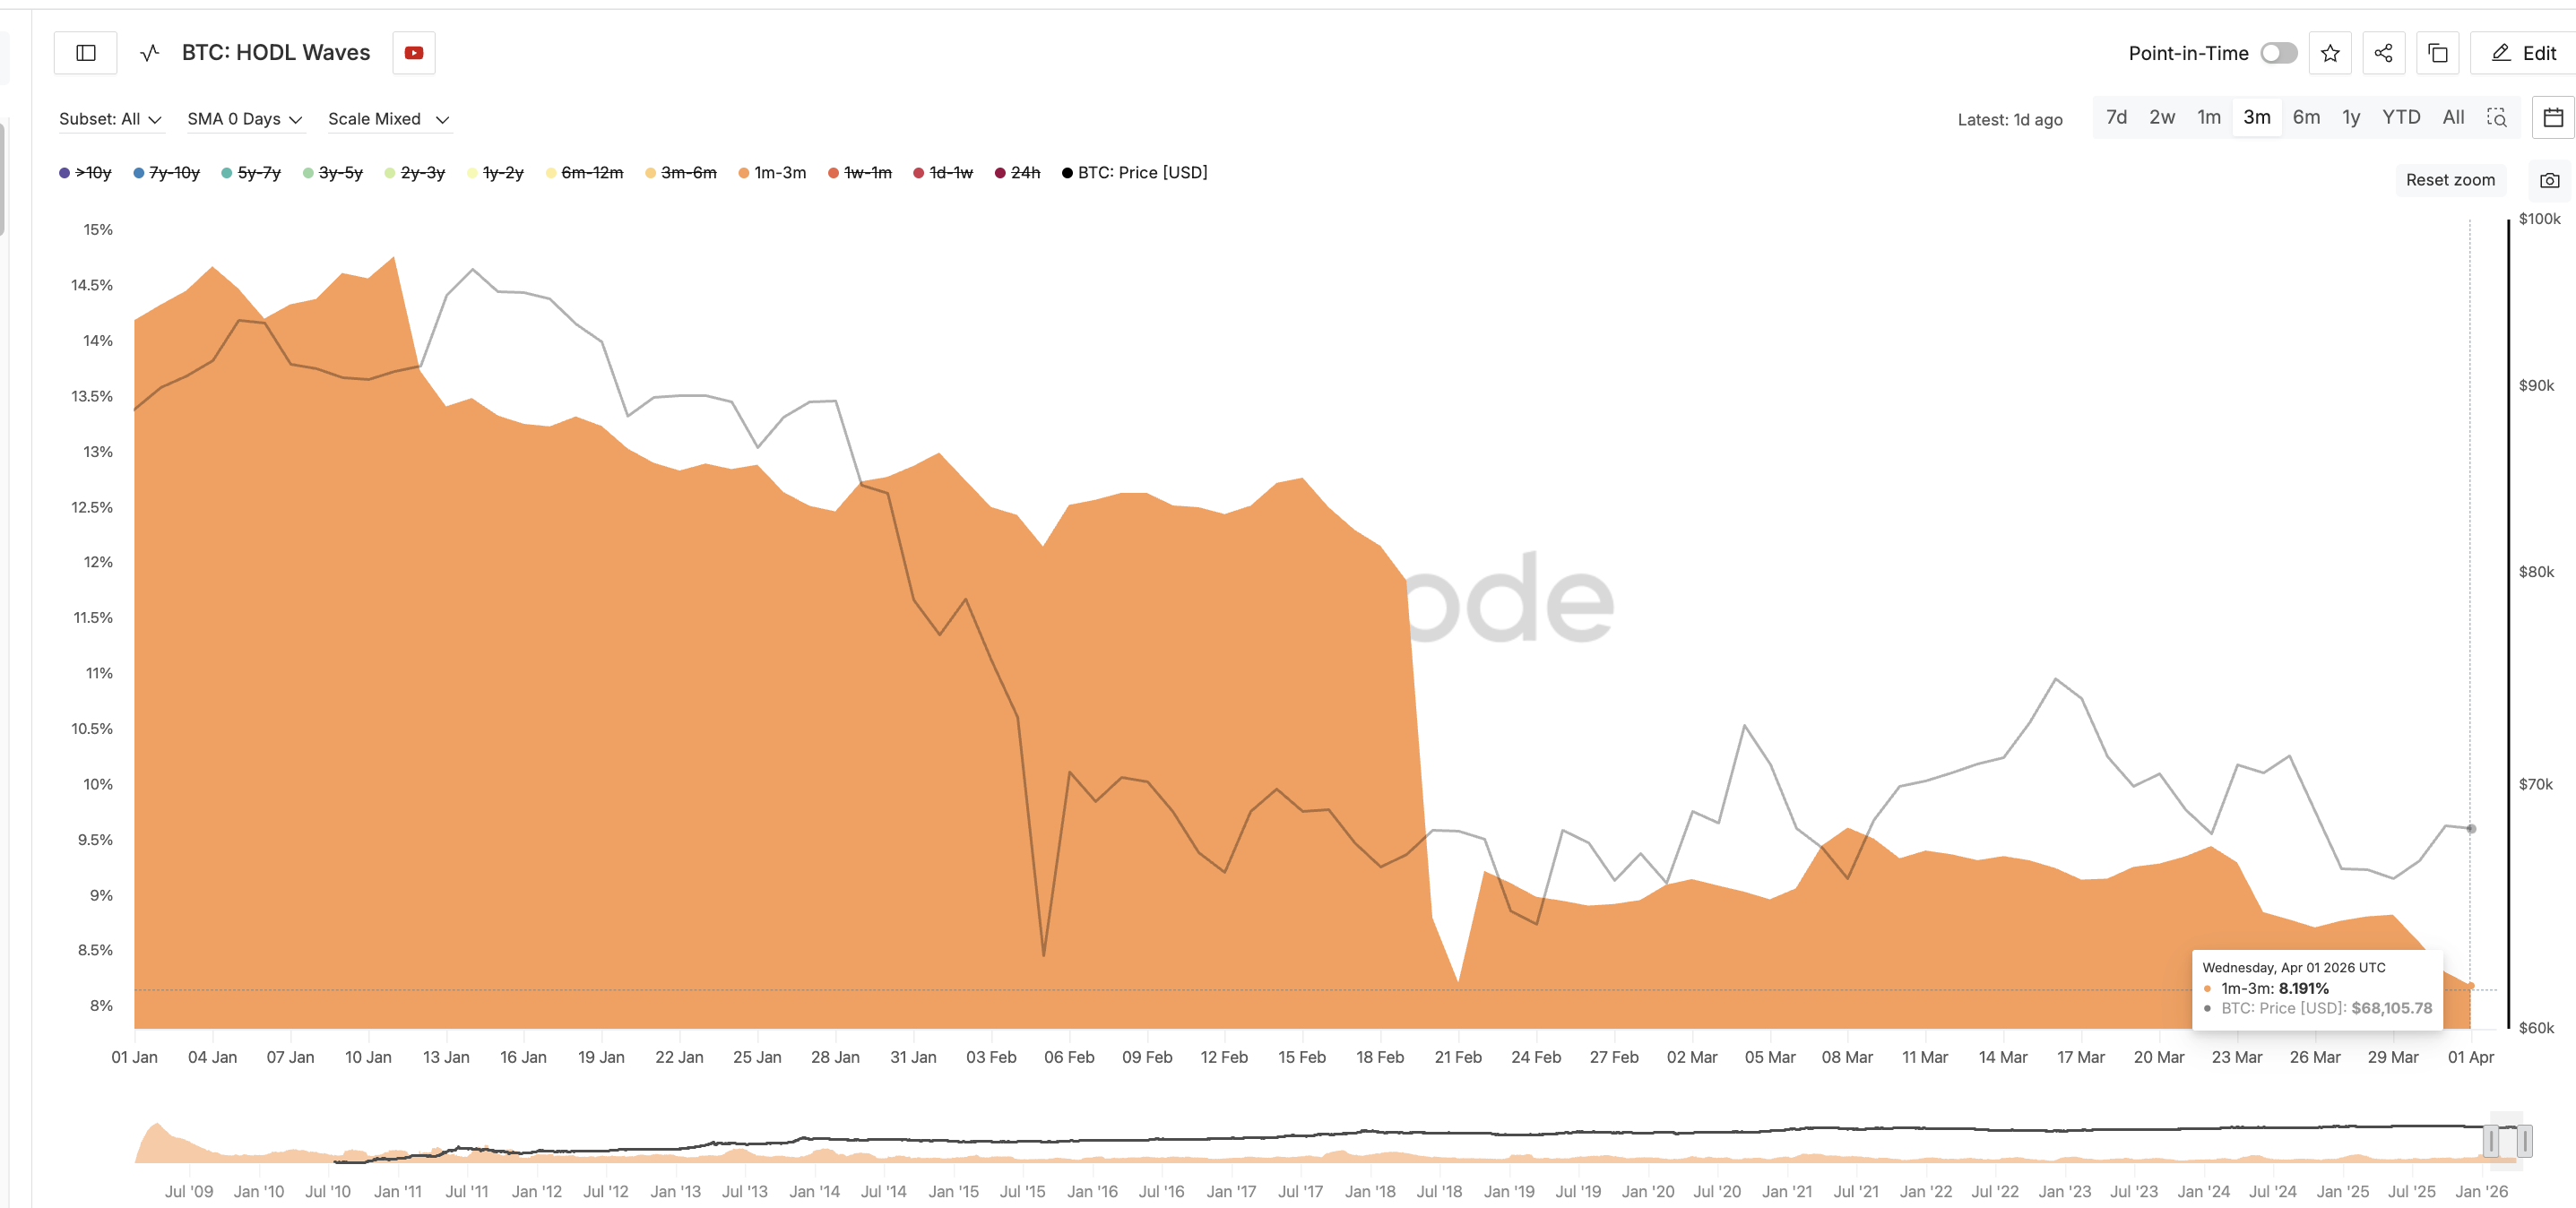 BTC HODL Waves 1m-3m Decline: Glassnode
Want more token insights like this? Sign up for Editor Harsh Notariya’s Daily Crypto Newsletter here.
This group represents participants who accumulated during the Q1 drawdown, expecting a bounce. Their persistent selling over nearly three months signals that short-term conviction has evaporated. When recent buyers distribute at a loss rather than averaging down, it typically reflects capitulation rather than healthy rotation.
That behavioral shift is visible on the Bitcoin price chart as well. Since late February, the daily timeframe has been forming a head and shoulders pattern. The pattern validates the weakness that the HODL wave data already flagged.
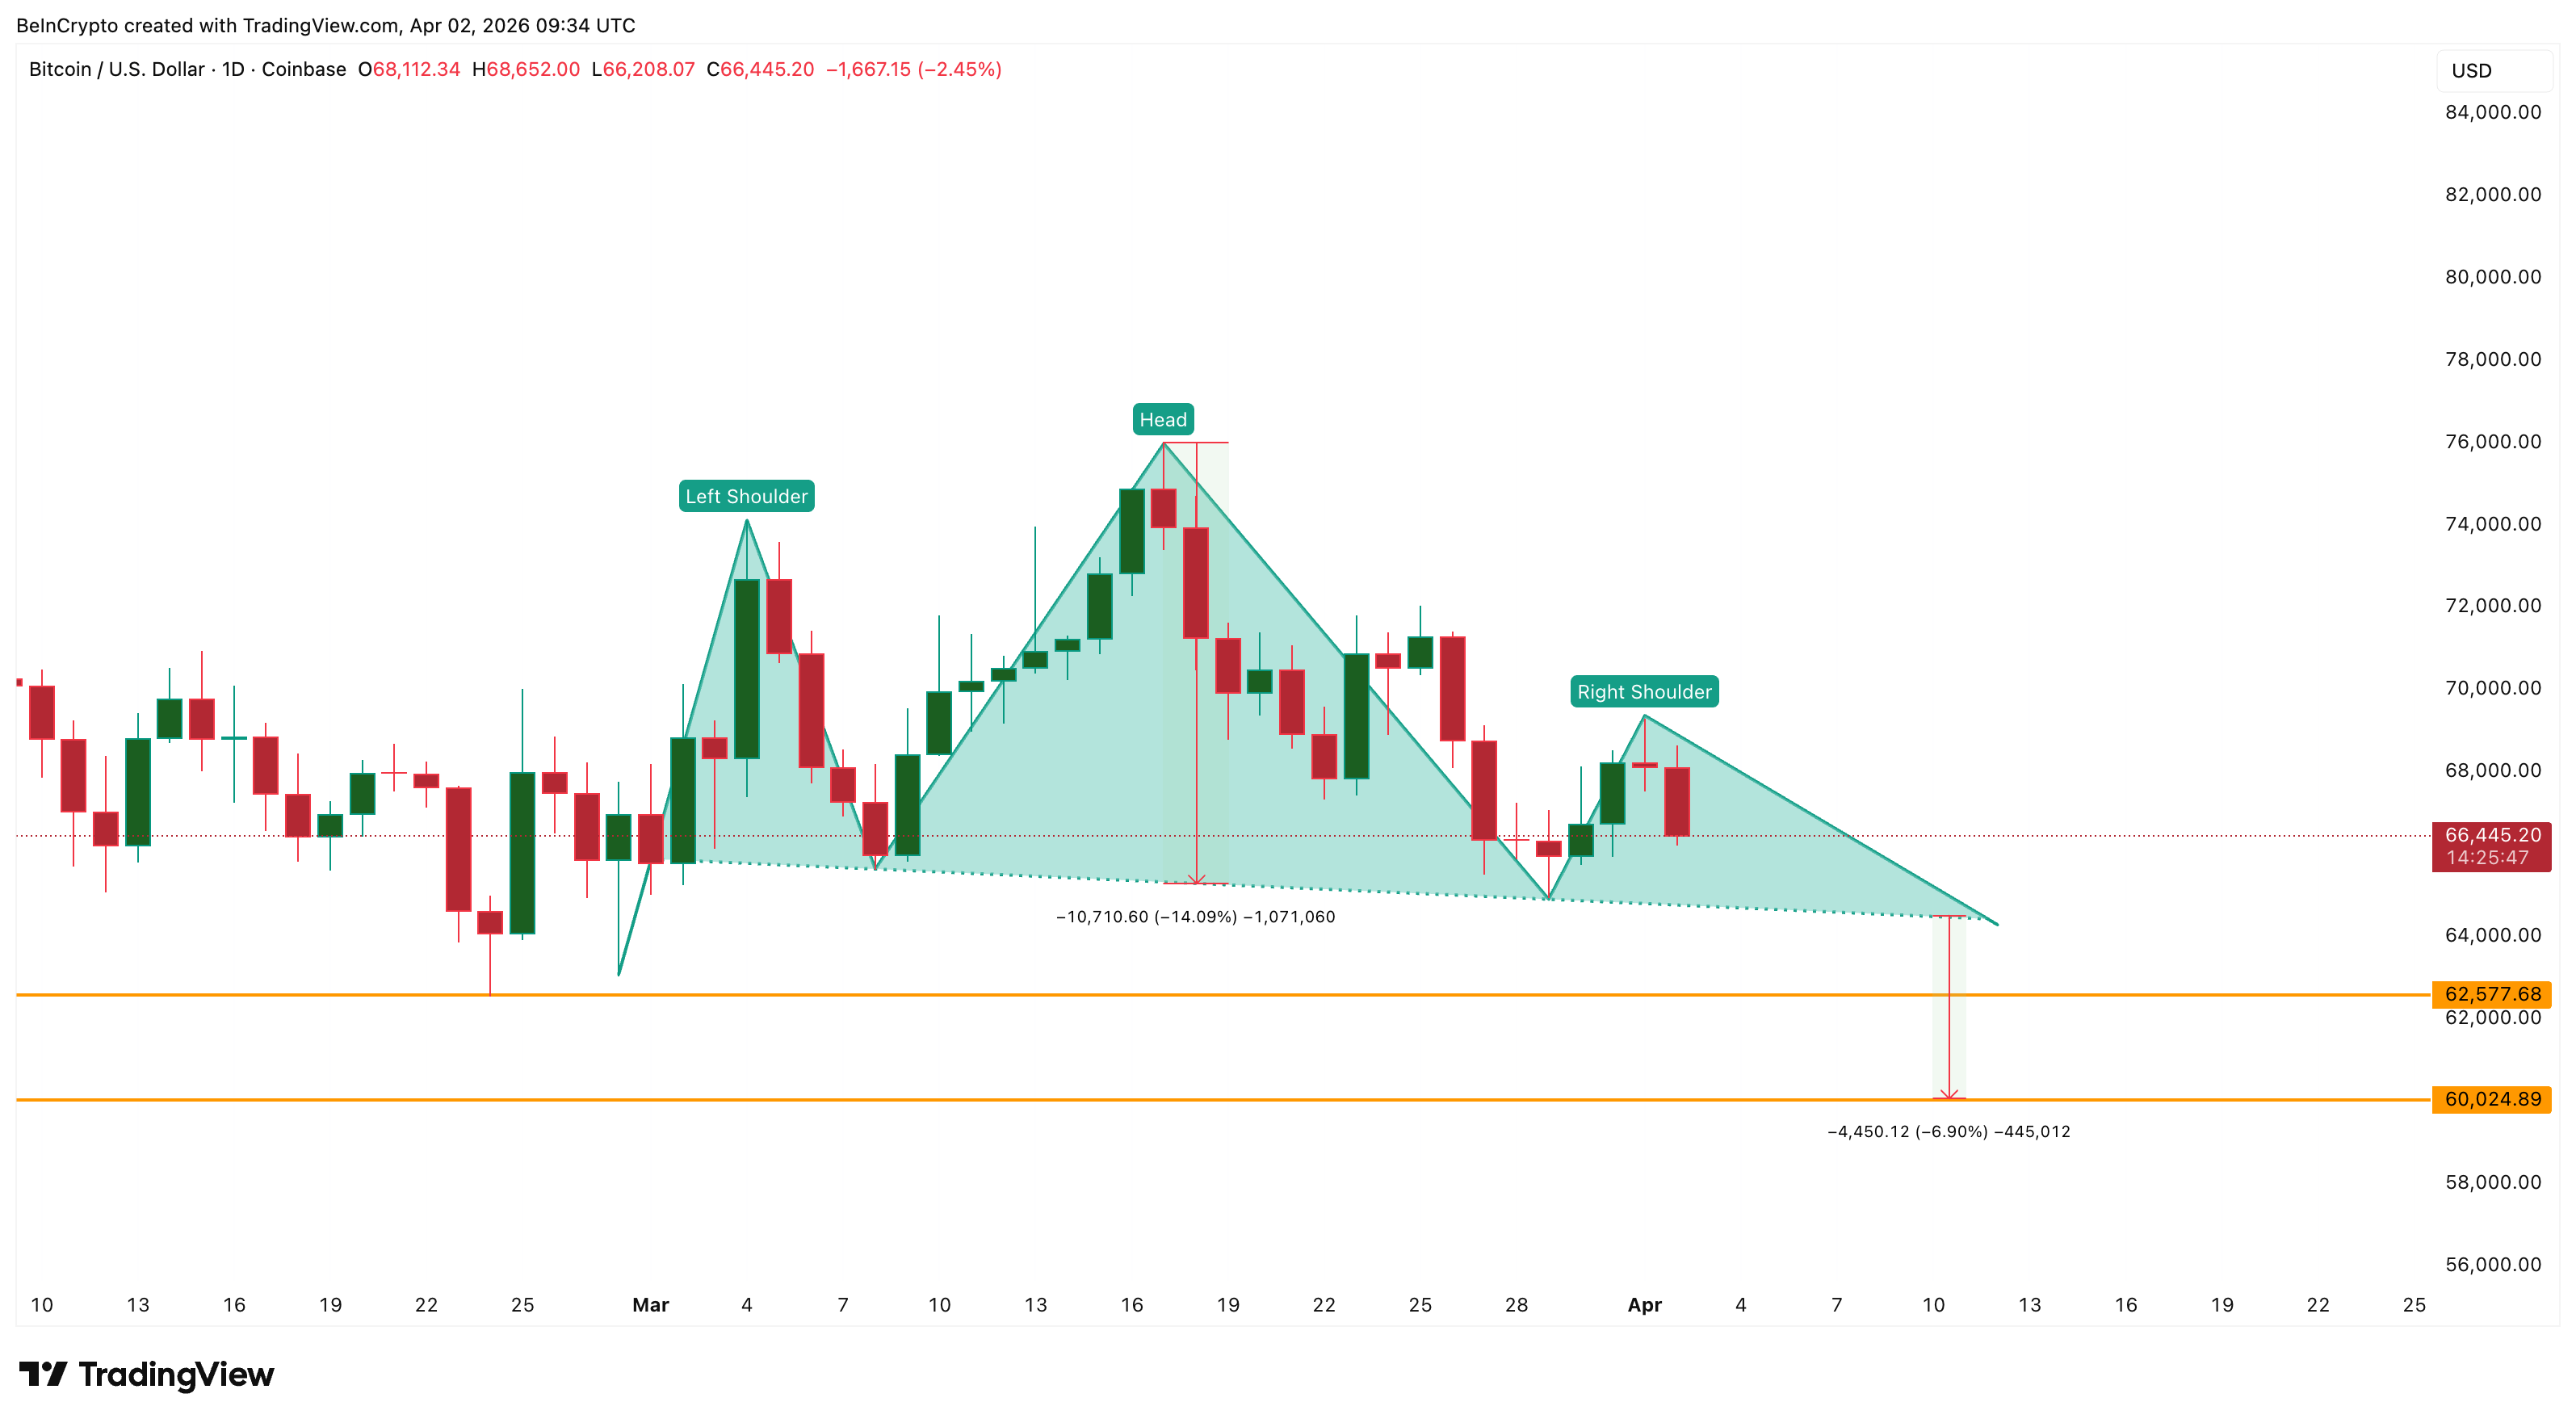 Head and Shoulders Formation: TradingView
However, whether the pattern triggers depends on how the derivatives market is positioned around the breakdown zone.
Leverage Leans the Wrong Way
Despite bearish signals from both on-chain behavior and chart structure, the BTC derivatives market has not adjusted defensively. Over the past seven days on the Binance BTC/USDT perpetual pair, cumulative long liquidation leverage totals $1.44 billion in active positions.
Short liquidation leverage sits at $1.03 billion. The roughly 40% skew toward longs means the market remains positioned for upside while the technical picture deteriorates.
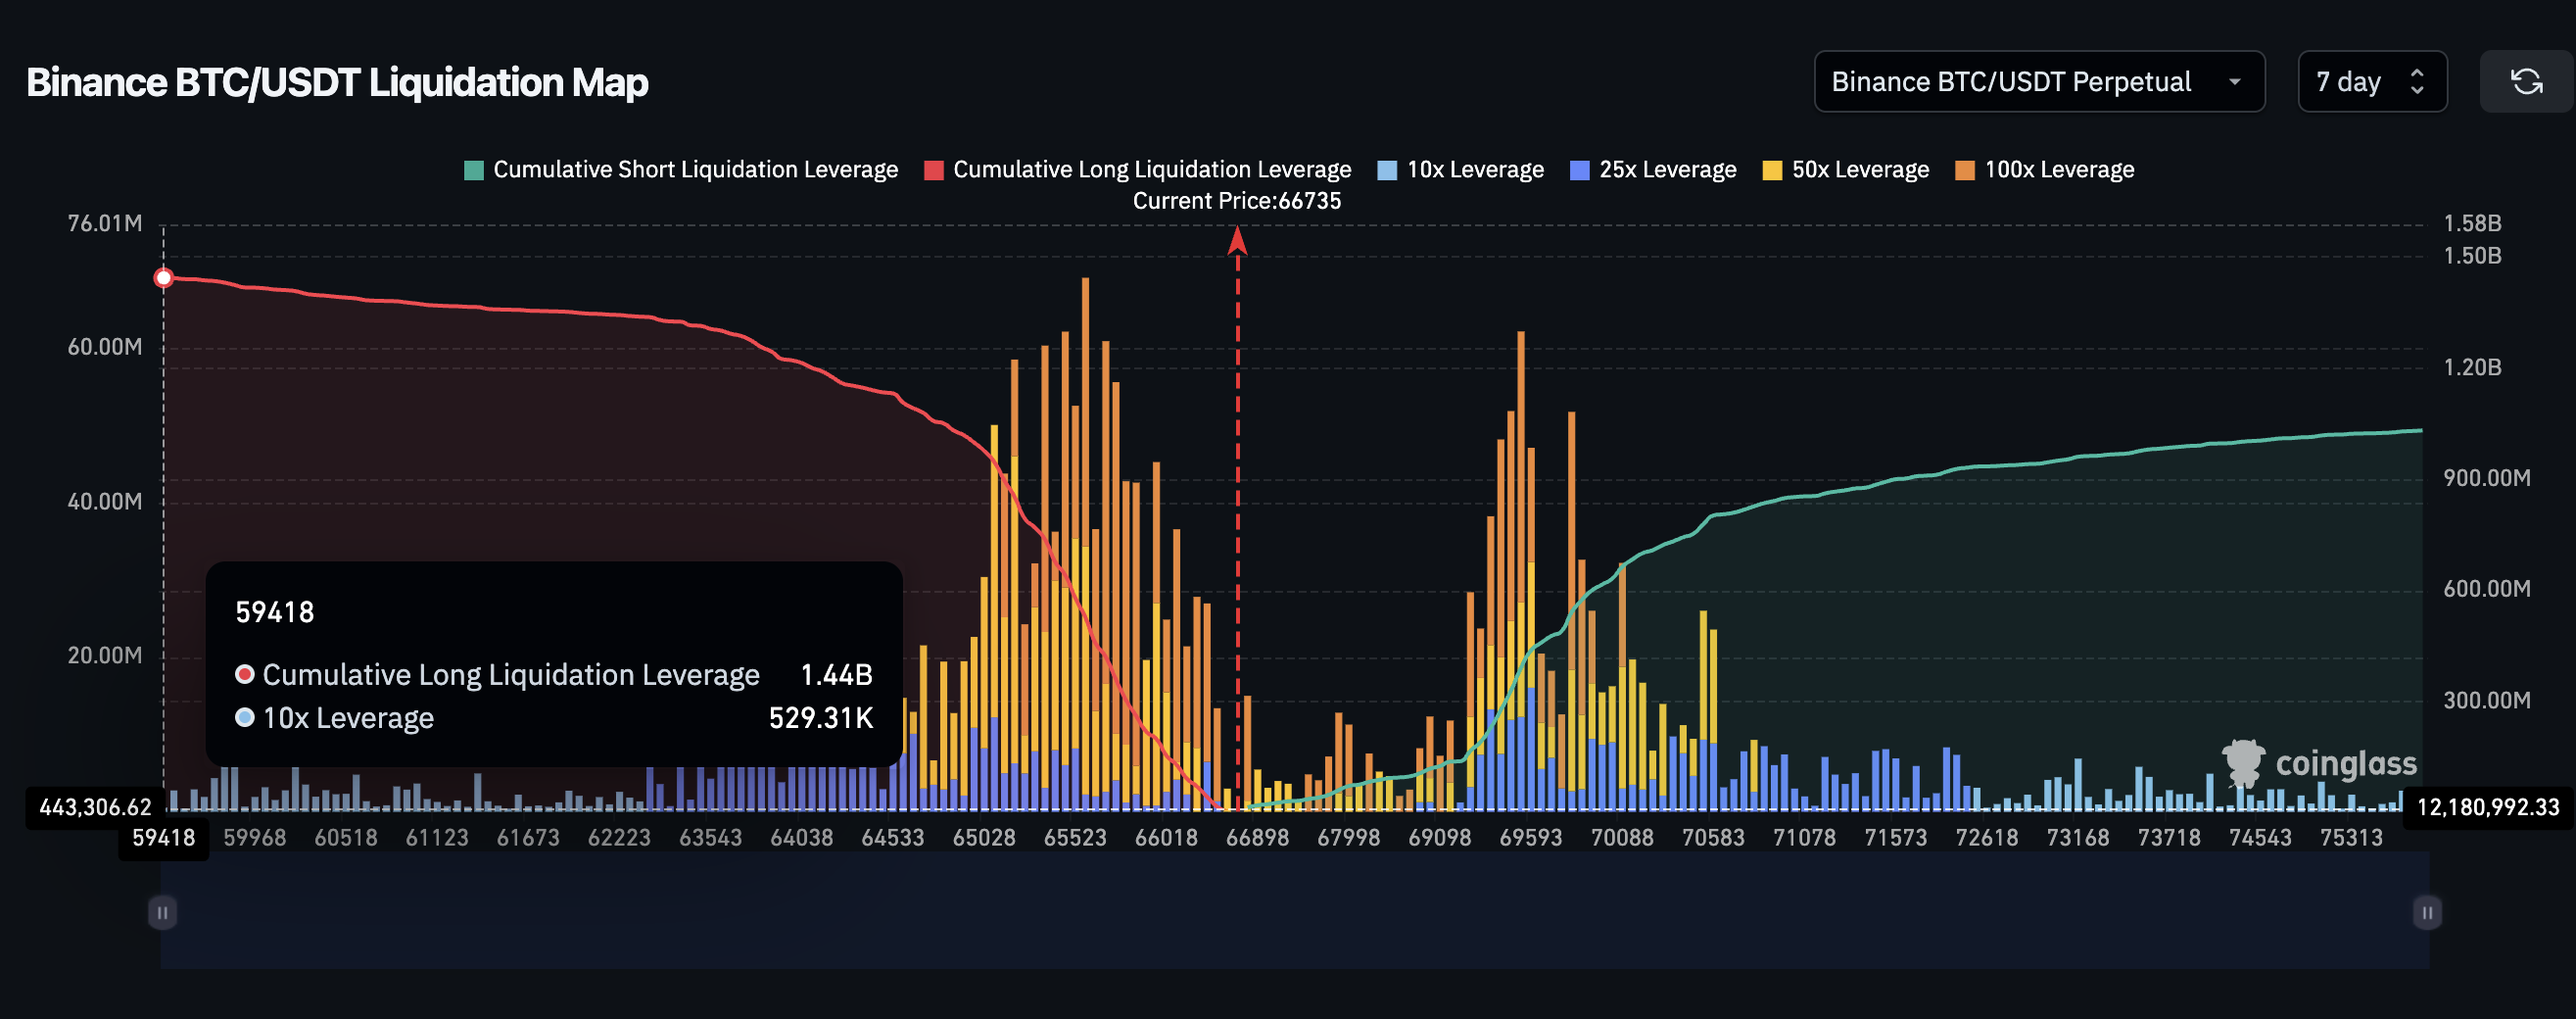 Binance BTC/USDT Liquidation Map: Coinglass
The Binance BTC liquidation map sharpens the risk further. Of the $1.44 billion in total long exposure, approximately $1.13 billion clusters at a single level near $64,533. That concentration means nearly 80% of all long positions opened over the past week would be forcibly closed if price reaches that zone.
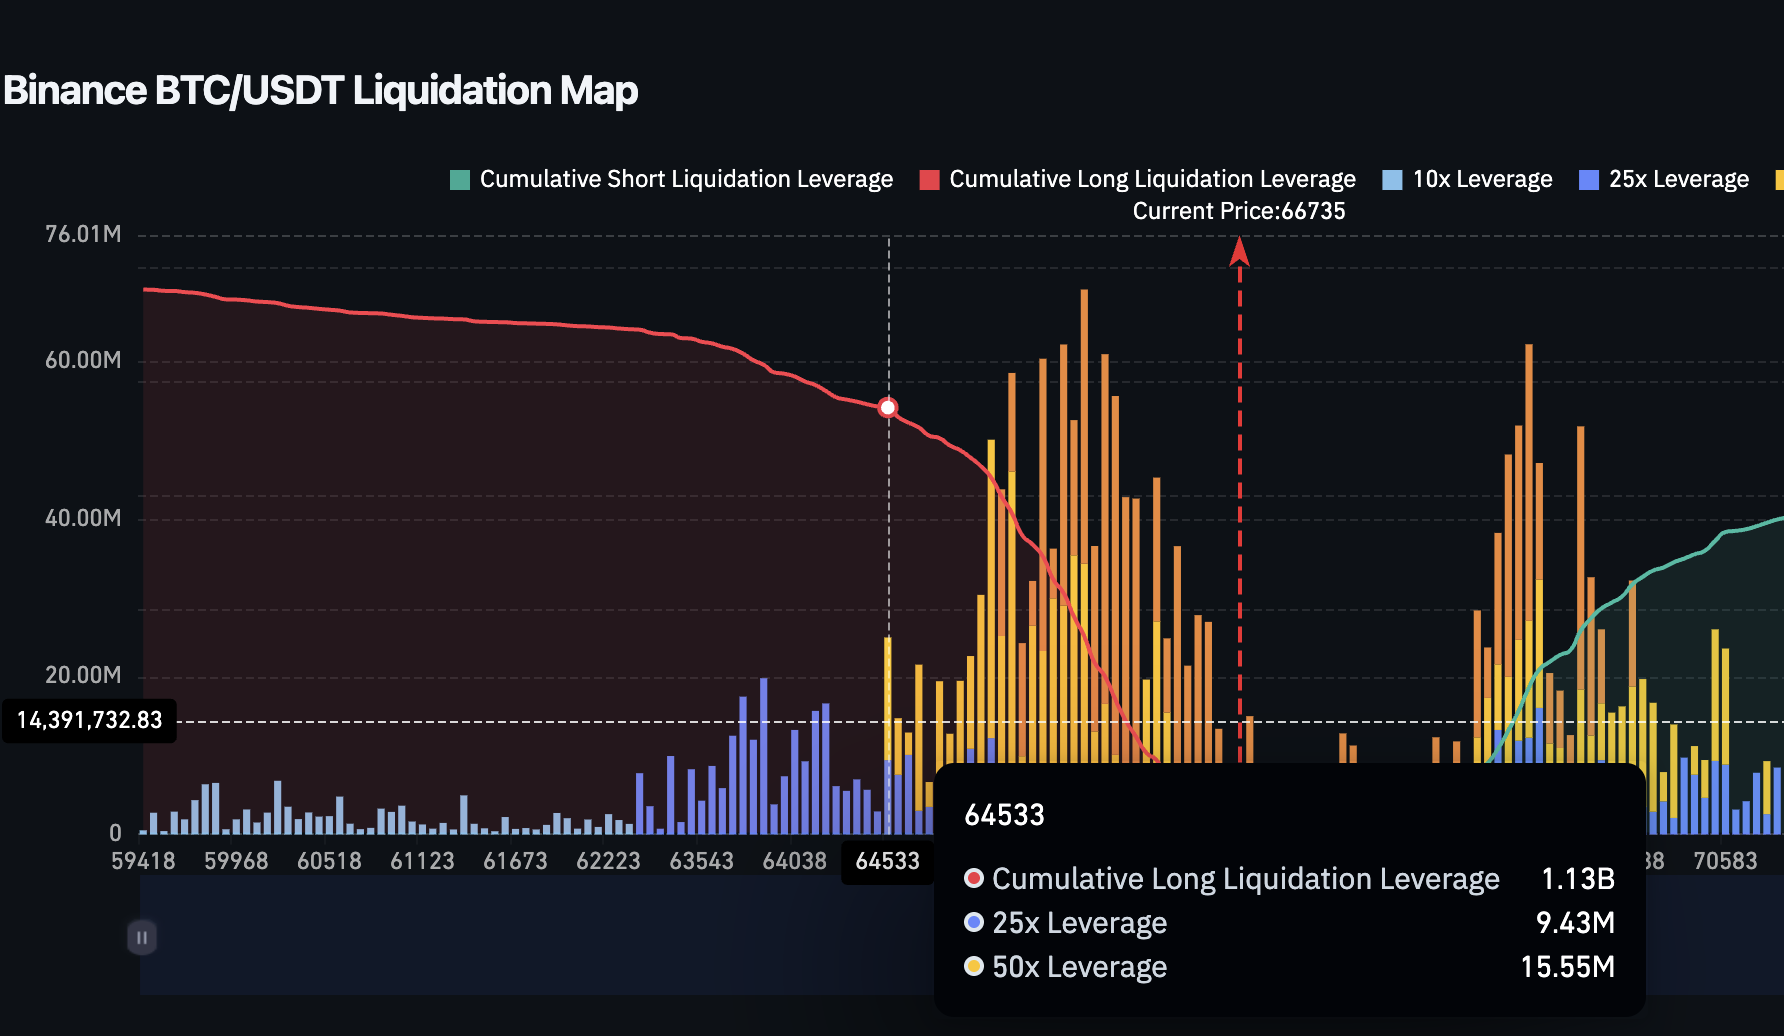 Liquidation Map Key Cluster: Coinglass
High-leverage positions using 25x and 50x multipliers dominate the cluster.
Even a modest push into that range could trigger cascading forced selling, turning a controlled decline into a liquidation-driven flush. The mismatch between bearish structure and bullish leverage is where the greatest Bitcoin price risk builds. The BTC price chart now becomes the final arbiter of whether that risk materializes.
Bitcoin Price Prediction and One Critical Line
The daily chart confirms the head and shoulders pattern with Fibonacci (Fib) levels mapping every critical zone. The Fib levels are drawn from the head of the pattern to the completed swing low.
Bitcoin currently trades near $66,425, having already lost the 0.236 Fib level at $67,510.
The measured move from the pattern projects a 14.16% decline, targeting approximately $60,024 on the way down. However, the path runs through $64,888, a level that is slightly above the neckline area for the pattern.
Losing $64,888 would place price directly into the $1.13 billion long liquidation cluster at $64,533 identified in the derivatives section. That overlap transforms the neckline break from a technical event into a leverage-driven cascade. From there the full 14% target, under $60,000 becomes realistic.
For the bearish thesis to fail, Bitcoin price needs a daily close above $69,132 to begin neutralizing the right shoulder. Strength only returns above $71,750, the 0.618 level, and a move past $75,997 would invalidate the head and shoulders entirely.
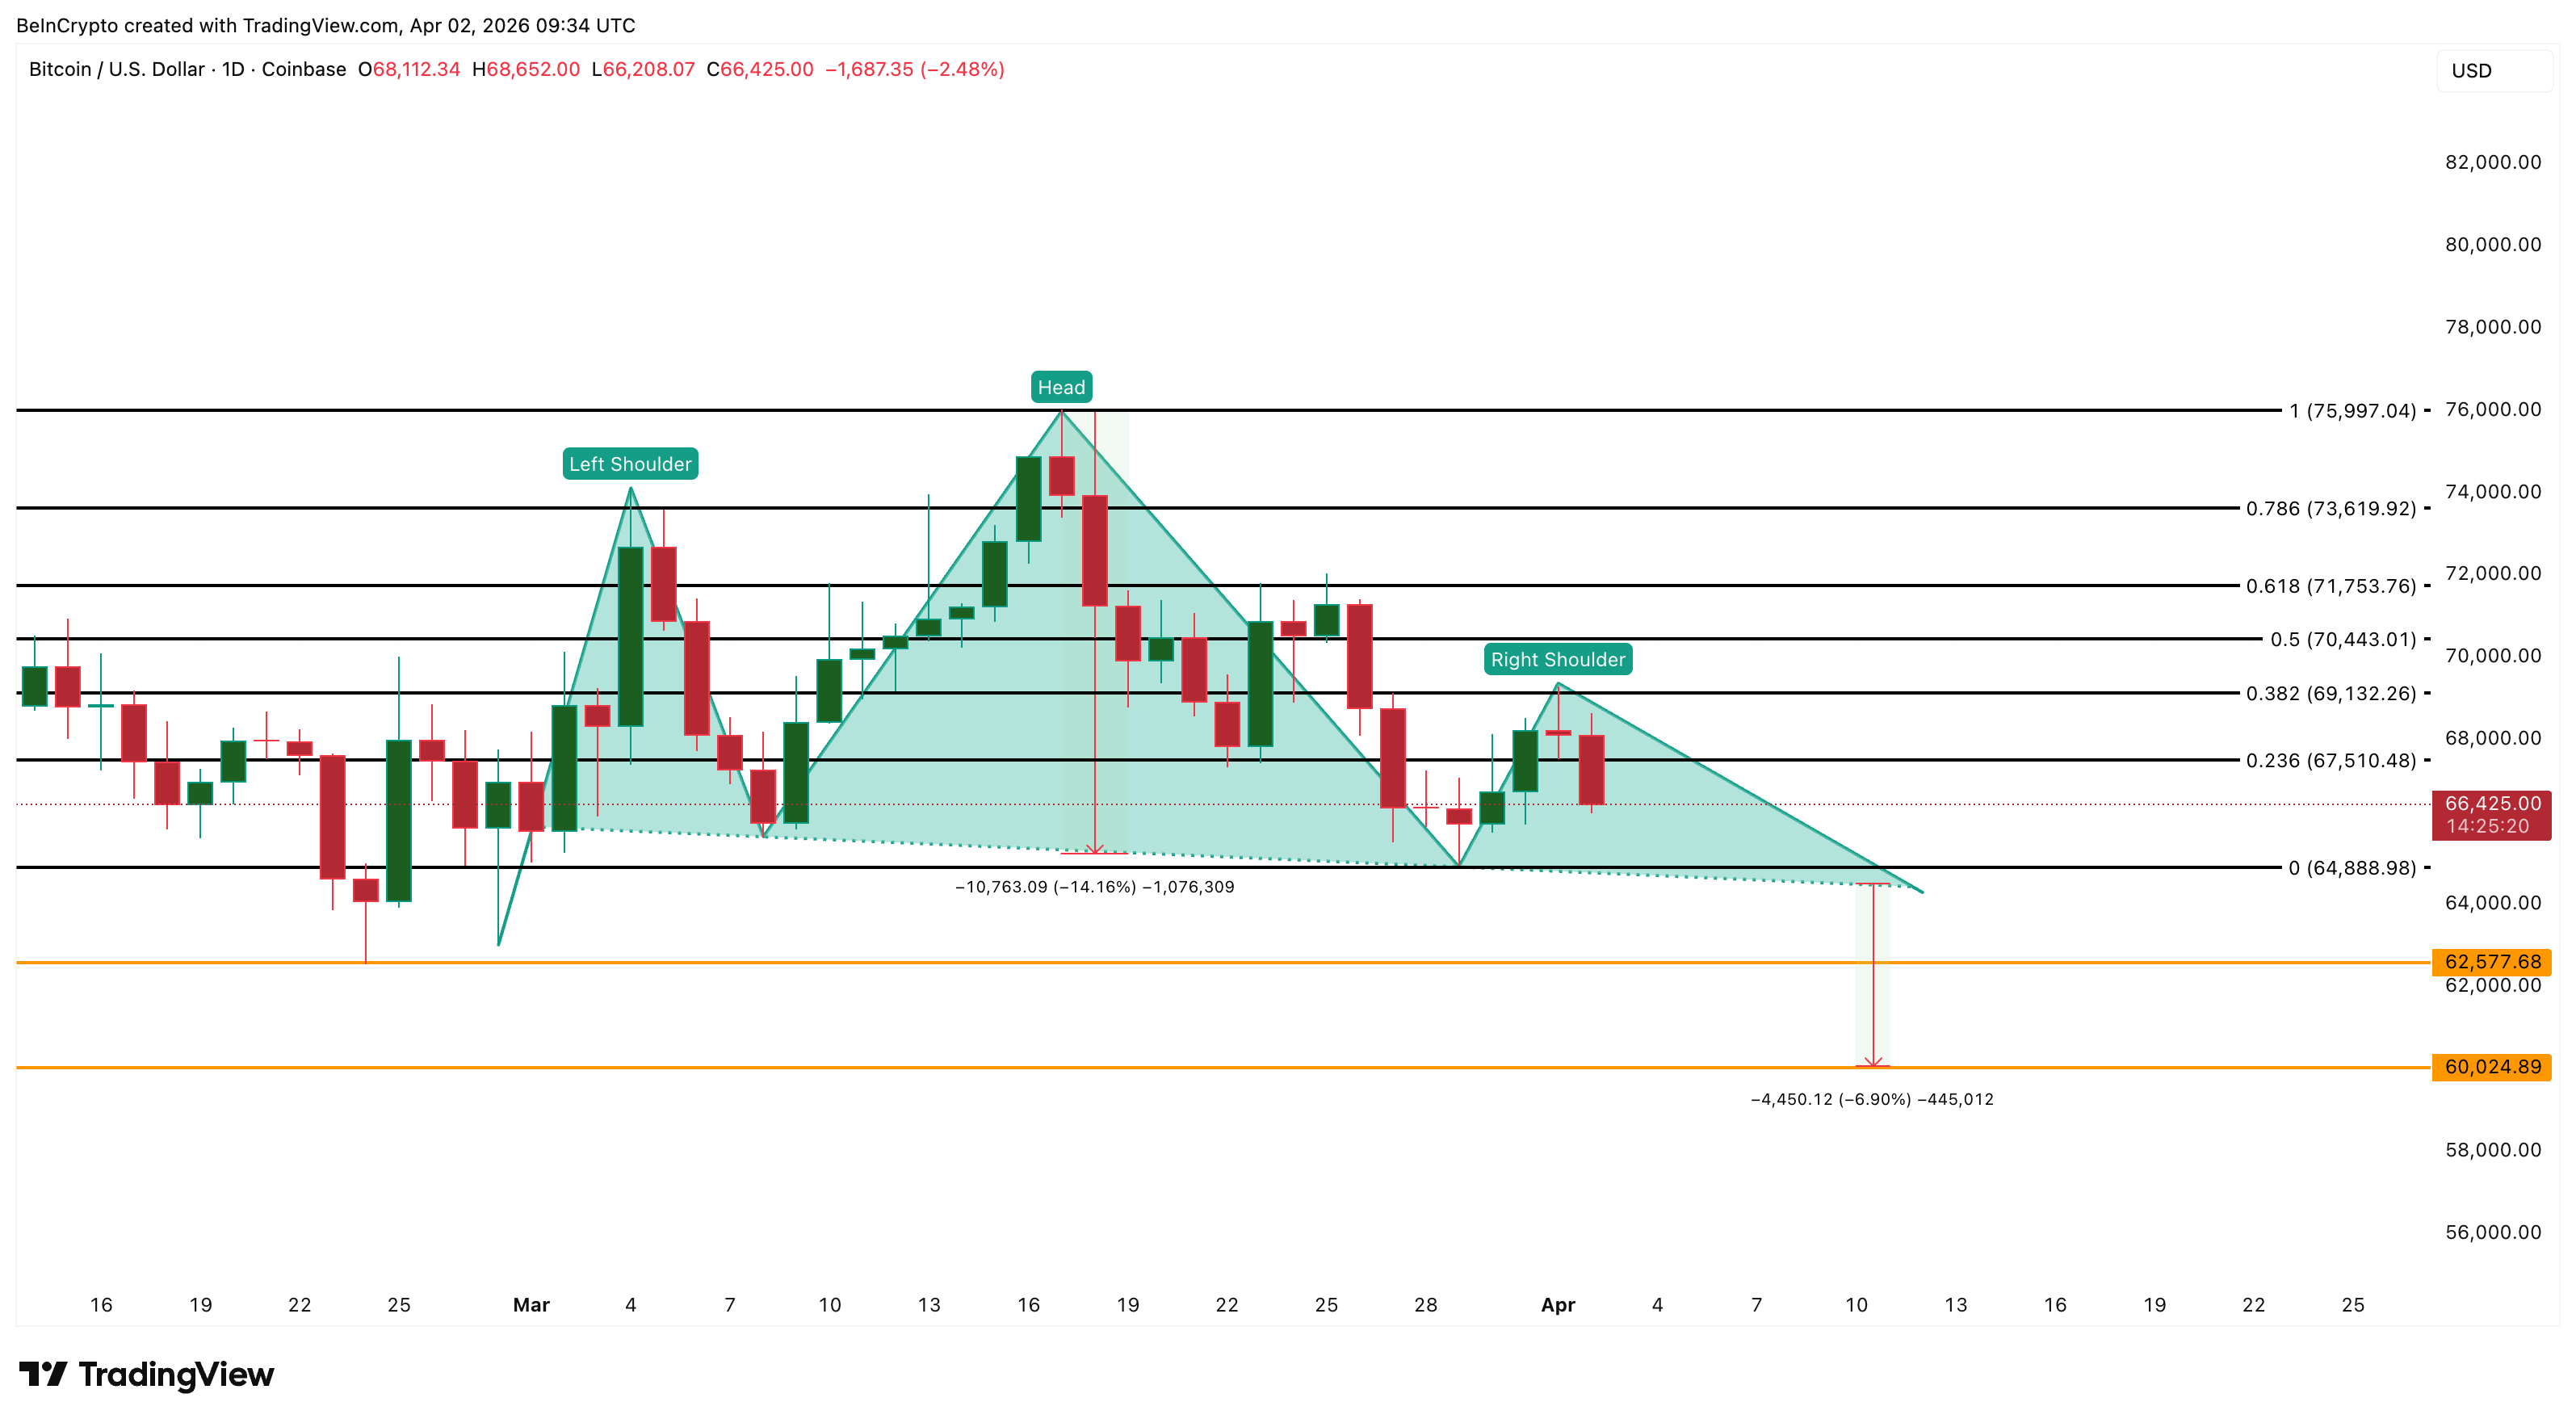 Bitcoin Price Analysis: TradingView
Head and shoulders patterns do not always resolve in the expected direction. A sudden demand surge or macro catalyst could reverse the structure before the neckline is tested. However, the convergence of capitulating short-term buyers, long-heavy leverage, and declining price structure lowers the probability of that outcome.
A daily close below $64,888 separates a measured pullback from a leveraged flush toward the $60,000 zone, while reclaiming $69,132 would be the first signal that sellers are running out of momentum.
The post One Selling Pattern Reveals the Next Major Bitcoin Price Risk of 2026 appeared first on BeInCrypto.


 English (US) ·