
 1 month ago
44
1 month ago
44

Opendoor Stock sits at a crossroads. The daily chart tells a bearish story, with price below every major moving average. However, the one-hour timeframe flashes a mild recovery signal. The result is bearish on structure, tentatively constructive on short-term momentum, and highly sensitive to macro catalysts.
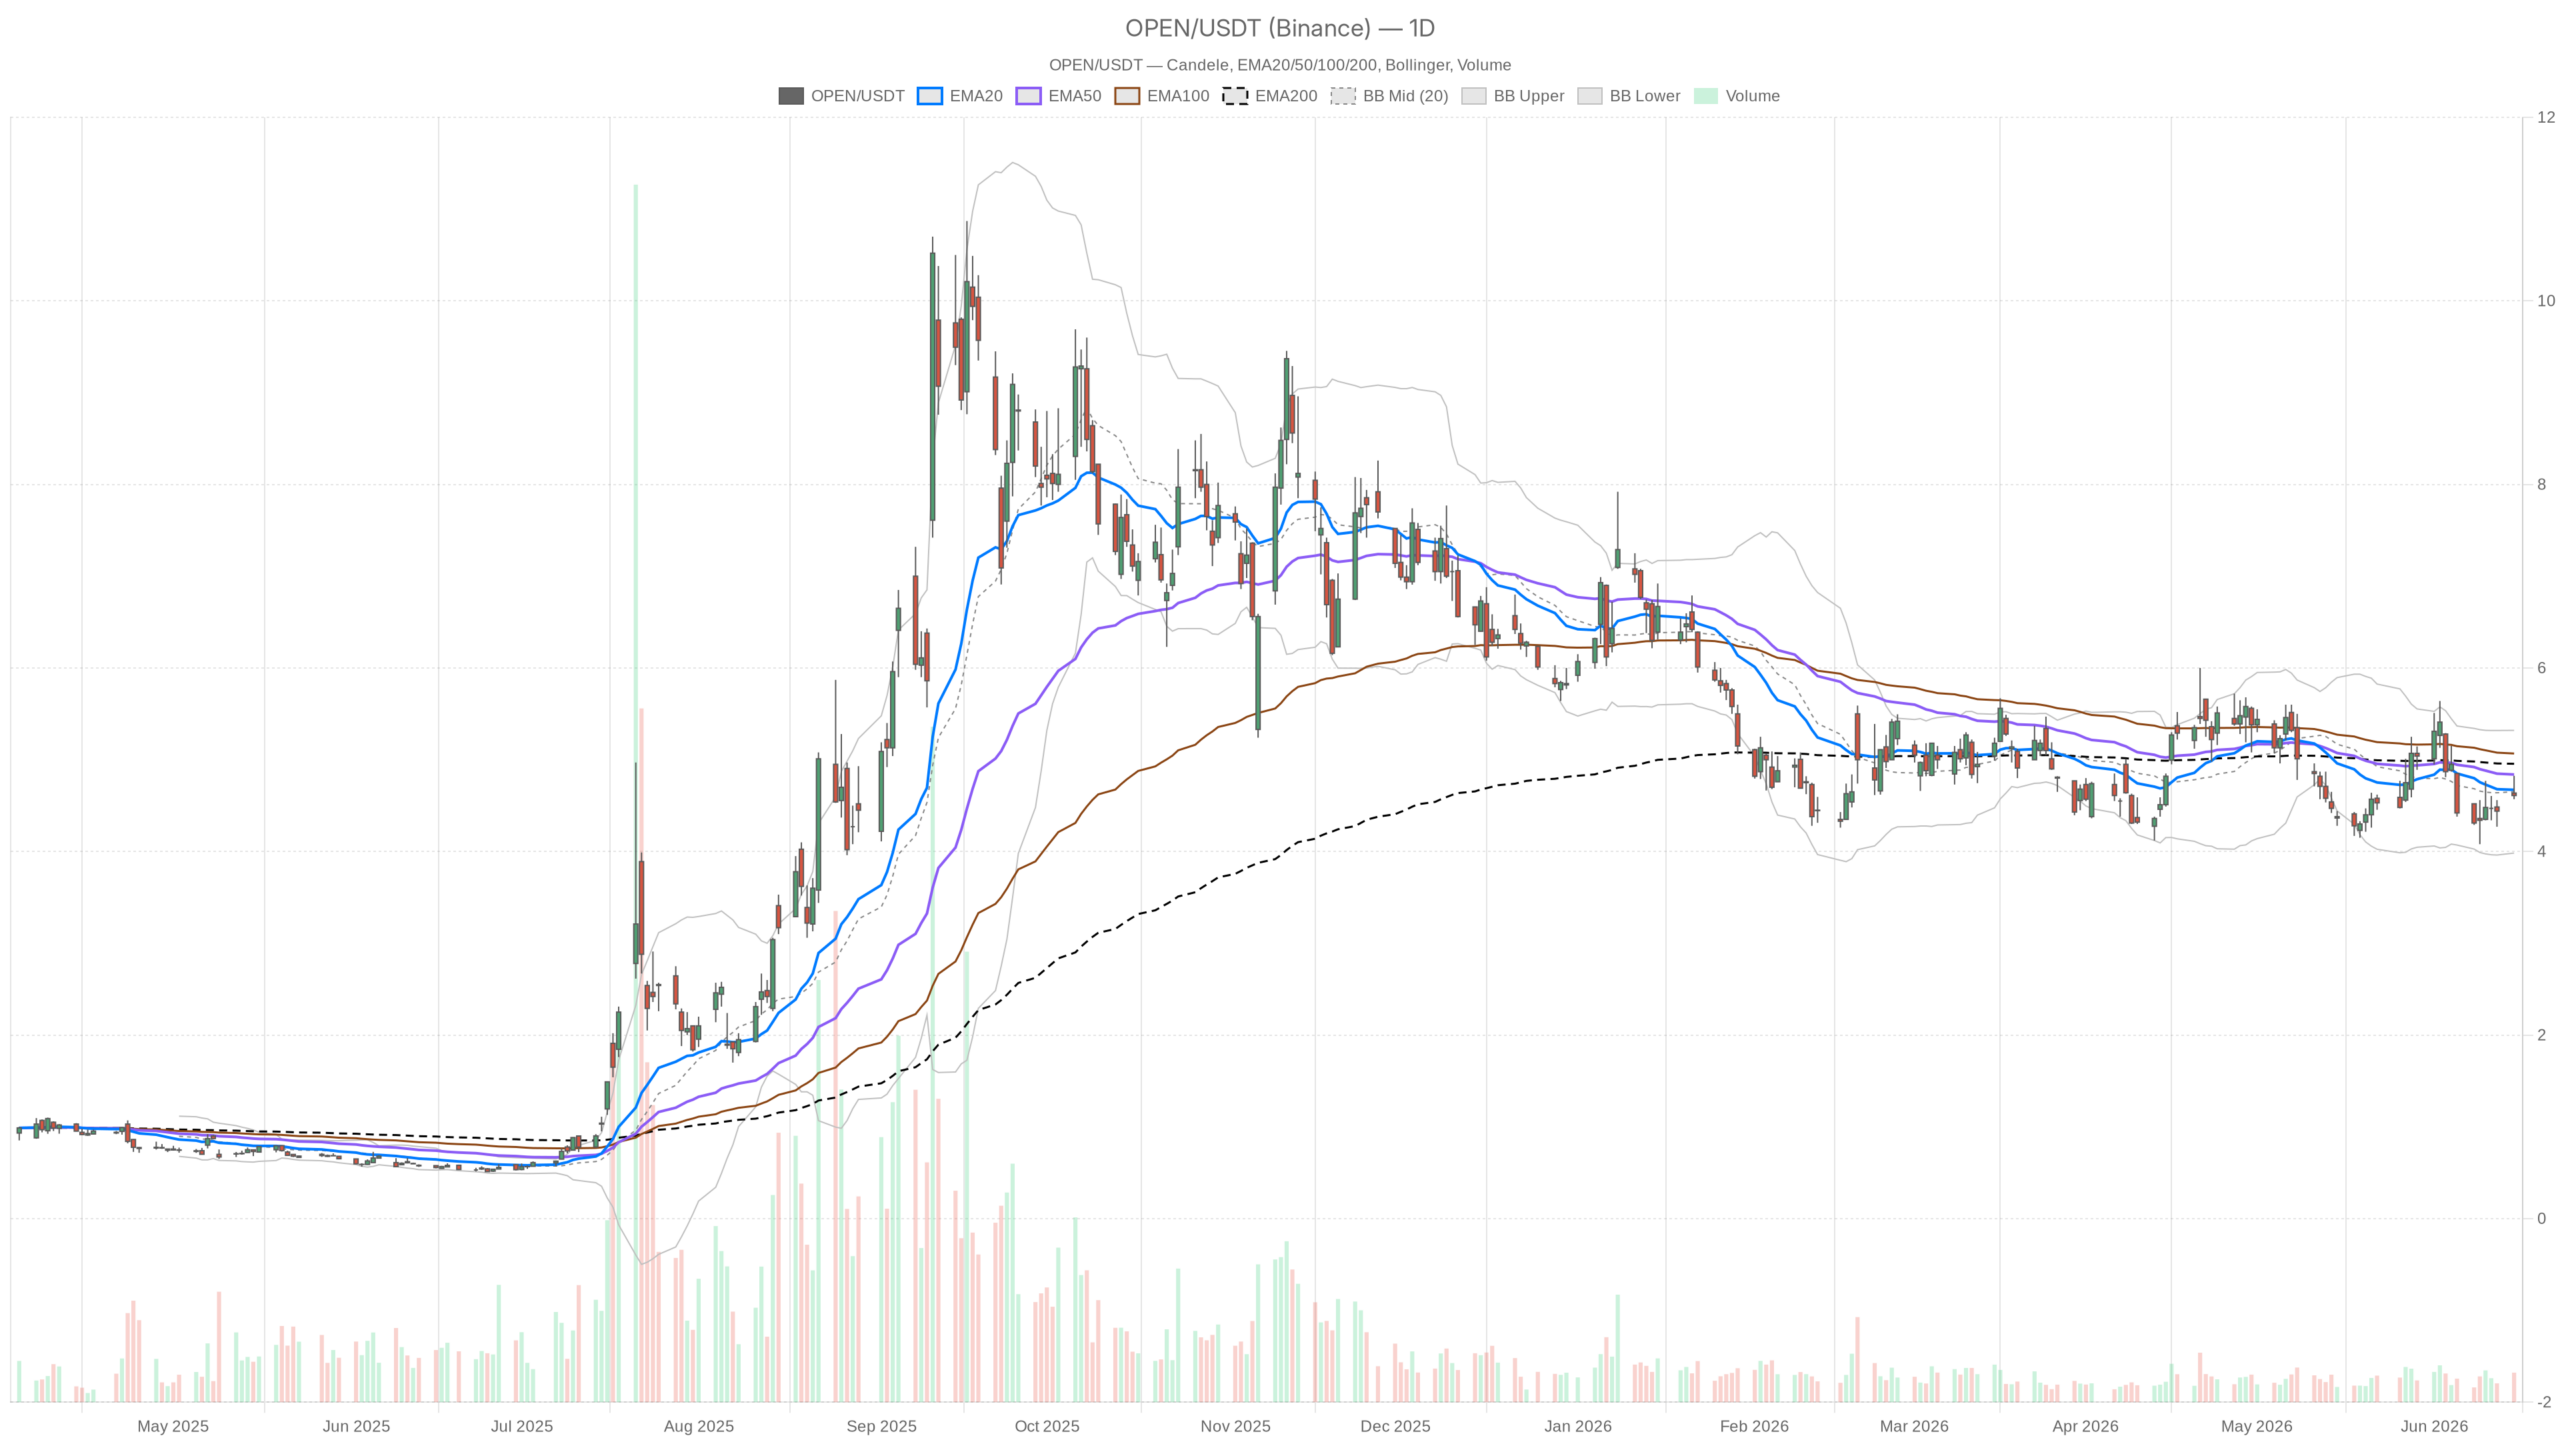 OPEN — daily chart with candlesticks, EMA20/EMA50 and volume.
Key Takeaways
- OPEN closed at $4.61 on June 15, below its 20-day EMA ($4.67), 50-day EMA ($4.84), and 200-day EMA ($4.96) — a fully bearish EMA stack.
- Daily RSI at 47.32 and MACD at -0.11 confirm deteriorating momentum with no exhaustion signal yet visible.
- Hourly signals lean modestly bullish, with price above the EMA20 and EMA50, but the 200-hour EMA at $4.74 caps the upside.
- A macro catalyst — falling Treasury yields tied to an Iran peace deal — fueled the intraday recovery and could unlock further gains if sustained.
- The bearish daily trend remains intact until OPEN reclaims at least the $4.77 R1 pivot and the $4.84 EMA50.
Daily Trend Remains Decisively Bearish for Opendoor Stock
The daily trend for Opendoor Stock is unambiguously bearish. The full EMA stack sits in descending order, confirming sustained selling pressure with no meaningful recovery attempt yet visible. OPEN closed at $4.61, below the 20-day EMA at $4.67, the 50-day EMA at $4.84, and the 200-day EMA at $4.96.
The daily pivot point sits at $4.67, meaning the close failed to hold even the pivot. The first resistance level at $4.77 and first support at $4.51 define the immediate battlefield. Notably, price hugging the pivot from below reinforces the bearish lean rather than signaling neutrality.
Momentum Indicators Signal Deterioration Without Exhaustion
Daily RSI at 47.32 sits below the midline but is not yet oversold. That reading keeps the door open to further downside without any exhaustion signal to lean on. Meanwhile, the MACD reinforces the bearish thesis. The line at -0.11 stays below the signal at -0.09. The histogram of -0.02 shows the spread is still widening. There is no bullish divergence here. Momentum is deteriorating, albeit slowly.
Meanwhile, the daily Bollinger Bands provide useful volatility context. The bands are relatively wide — upper at $5.32, lower at $3.98 — suggesting meaningful price swings remain possible in either direction. At $4.61, OPEN is hugging the midline from below, a configuration that typically confirms weakness. The daily ATR of $0.43 underscores that daily ranges remain substantial, meaning any move can accelerate quickly.
Short-Term Chart Offers Tentative Recovery Signals
The one-hour chart offers a modestly bullish counterpoint to the daily bearish trend for Opendoor Stock, though it stops well short of a reversal signal. Price at $4.61 is trading above the hourly EMA20 at $4.55 and EMA50 at $4.58. The hourly MACD line stands at +0.04, above the signal of +0.02, with a positive histogram. That is a clear short-term momentum shift. The hourly RSI at 54.12 is above the midline, confirming buyers have marginally reclaimed control of near-term price action.
However, the 200-hour EMA at $4.74 remains a significant overhead ceiling. Price has not approached that level yet. Any rally that stalls below it would reinforce the daily bearish framework rather than challenge it. The hourly Bollinger midline sits at $4.52, and price trading well above it confirms the intraday constructive tilt.
15-Minute Chart Shows Flat Consolidation
Meanwhile, the 15-minute chart is flat and inconclusive. RSI sits at 49.8 — essentially neutral. The MACD histogram has ticked slightly negative at -0.01, suggesting very near-term momentum has faded marginally. The 15m EMA20 at $4.62 is fractionally above price, while EMA200 at $4.60 is almost exactly at current levels. This is a market in short-term equilibrium, consolidating in an extremely tight range.
The 15m ATR of just $0.04 underscores how little directional conviction exists at this granularity. For execution purposes, a clean break above $4.62 or below $4.59 would be the immediate trigger to watch.
Macro Catalysts and Strategic Developments
Two meaningful macro catalysts and Opendoor’s strategic restructuring are shaping the near-term outlook for Opendoor Stock. First, an Iran peace deal reportedly triggered a fall in Treasury yields, which directly feeds into lower mortgage rates. For Opendoor, a company deeply tied to residential real estate transaction volumes, lower mortgage rates are unambiguously positive. That macro tailwind likely explains the mild intraday recovery visible on the hourly chart.
Second, EMJ Capital’s Eric Jackson published a provocative long thesis arguing OPEN could replicate the kind of multi-decade appreciation seen in generational stocks. Whether one agrees with that framing or not, it added speculative interest to the stock on a day when macro conditions were already turning friendlier.
At the same time, Opendoor’s strategic pivot deserves attention. The company is shutting its India operations and relocating approximately 250 jobs back to the U.S. CEO Kaz Nejatian is pushing toward an AI-native operating model. That restructuring signals both cost discipline and a cleaner strategic focus — potentially positive for medium-term efficiency. In the near term, however, operational transitions carry execution risk. The market has not yet priced in a meaningful premium for the AI repositioning story.
Bullish and Bearish Scenarios for OPEN
The path forward for OPEN hinges on whether macro tailwinds can overcome the firmly bearish daily structure. Both scenarios are clearly defined and depend heavily on external catalysts rather than technical signals alone.
The Bullish Case
The bullish case rests on a confluence of factors. A sustained decline in mortgage rates could unlock housing market activity that has been frozen for months — if the Iran peace deal holds and Treasury yields stay depressed. Jackson’s high-profile bull thesis is drawing fresh retail and institutional attention. Combined with Opendoor’s leaner AI-focused structure, the stock has the ingredients for a momentum-driven re-rating. A daily close above the $4.77 R1 pivot would be the first step. Reclaiming the $4.84 EMA50 would then signal the bearish trend is under genuine pressure.
The Bearish Scenario
In contrast, the bearish scenario is straightforward. The daily trend is intact and the EMA stack remains fully bearish. If the macro catalyst fades, the recent intraday bounce becomes noise. Yields could reverse higher, housing data could disappoint, or the peace deal could stall. A break below daily support at $4.51 would confirm the path of least resistance is still lower. The Bollinger lower band at $3.98 marks the next meaningful structural level.
Overall, Opendoor Stock remains in a bearish daily trend that one session of intraday recovery has not altered. The hourly signals offer short-term reason for caution on aggressive short positioning. However, they do not justify a bullish directional bet on their own. Volatility is elevated — a daily ATR of $0.43 on a $4.61 stock represents nearly 10% of price. Moves in either direction can be sharp and fast. Until OPEN reclaims its daily EMA stack, the burden of proof remains firmly on the bulls.
FAQ
Is Opendoor Stock in a bearish or bullish trend?
The daily trend for Opendoor Stock is decidedly bearish. Price trades below all three major EMAs — the 20-day at $4.67, the 50-day at $4.84, and the 200-day at $4.96 — with momentum indicators confirming continued deterioration.
What would signal a trend reversal for OPEN?
A daily close above the $4.77 R1 pivot, followed by a reclaim of the $4.84 EMA50, would be the first technical signal that the bearish trend is under pressure. Full confirmation would require price to clear the 200-day EMA at $4.96.
What macro factors are influencing Opendoor Stock right now?
Falling Treasury yields, driven by an Iran peace deal, are lowering mortgage rates — a positive for Opendoor’s real-estate-dependent business model. Additionally, the company’s AI-focused restructuring and a high-profile bull thesis from EMJ Capital are drawing speculative interest to the stock.
Is the recent intraday bounce a buying opportunity?
The hourly chart shows modestly bullish signals, but they fall short of confirming a reversal. With the daily trend firmly bearish and resistance at the 200-hour EMA of $4.74, aggressive long positioning lacks sufficient technical justification at current levels.
Disclaimer: This article is for informational purposes only and does not constitute financial advice, an investment recommendation, or a solicitation to buy or sell any financial instrument or cryptocurrency. The analysis provided is not indicative of future results. Investing in crypto assets and financial markets carries a high risk of capital loss. Always do your own research (DYOR) and consult a qualified financial advisor before making any decision.
Article produced with the assistance of artificial intelligence and reviewed by the editorial team.


 English (US) ·