
 2 months ago
46
2 months ago
46
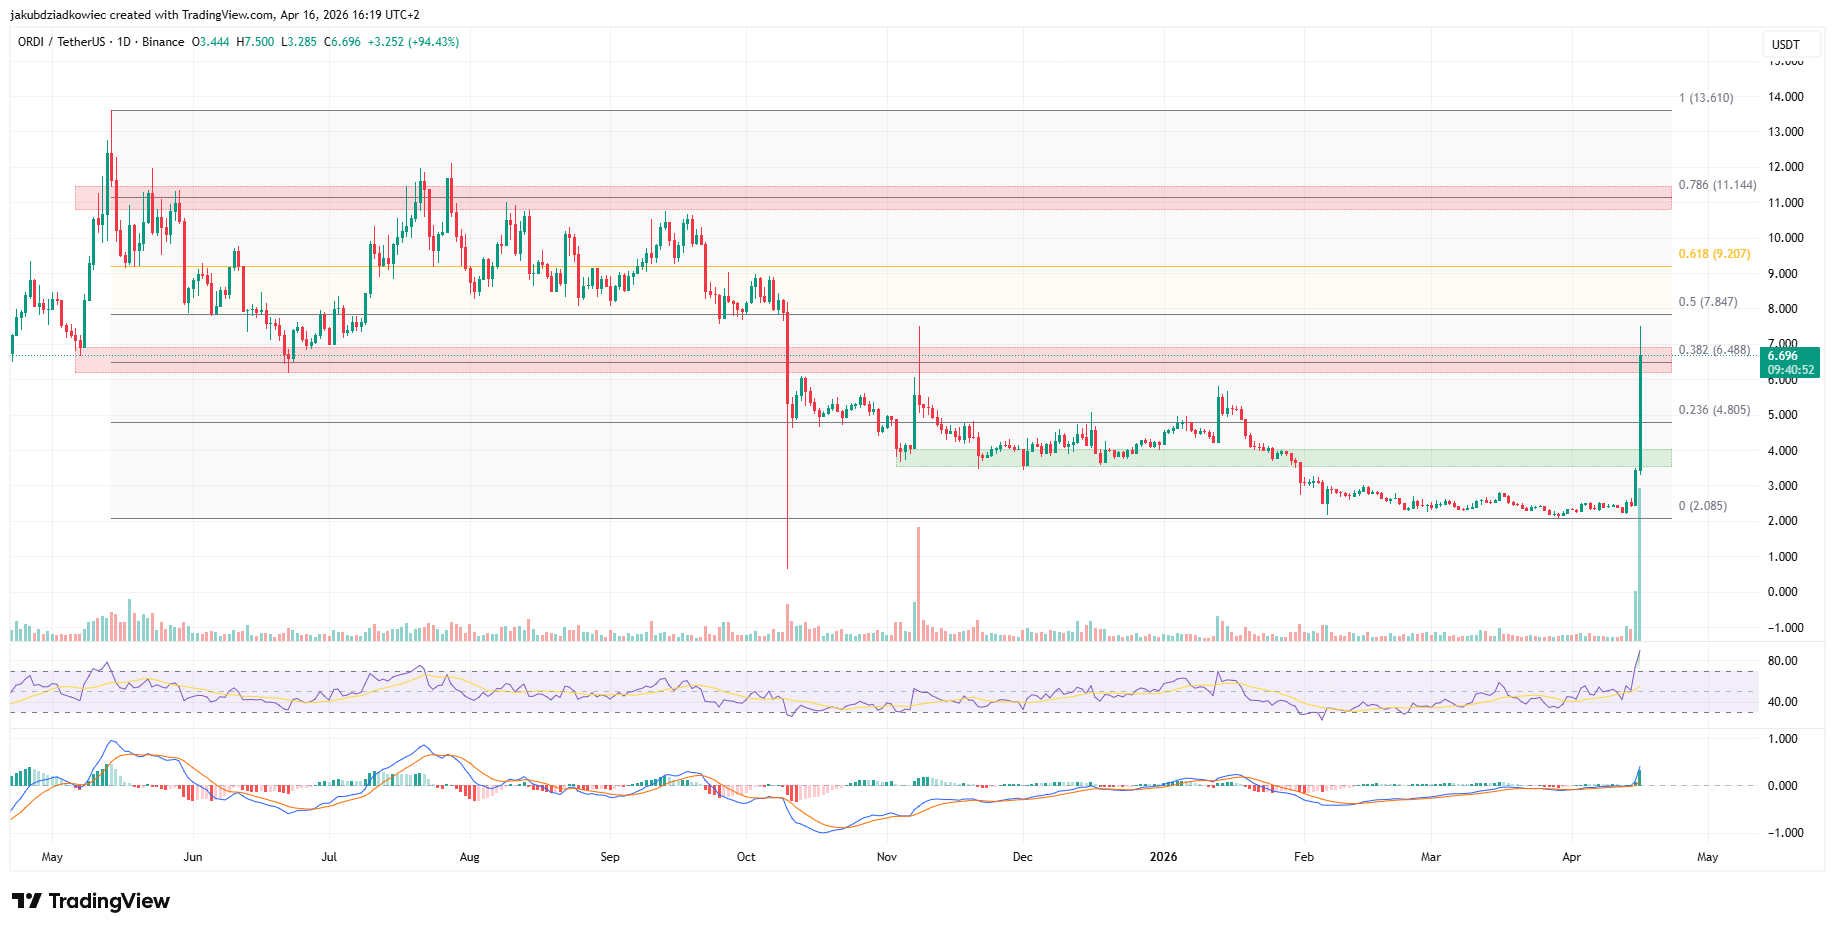
Ordinals (ORDI) posted a 94% single-day gain on April 16, pushing directly into its first major Fibonacci resistance zone. The move follows months of base-building and a falling wedge breakout visible across multiple timeframes.
A massive volume surge accompanied the advance, driving price from the $2.00 range to above $6.60. ORDI is now testing the 0.382 Fibonacci retracement at $6.488 after opening the session at $3.444.
Volume Explosion Drives ORDI Into Fibonacci Resistance
The daily chart shows a prolonged downtrend that stretches back to the all-time high. A Fibonacci retracement runs from the May 14, 2025 high of $13.61 to the March 29 low of $2.085. That grid maps the key recovery levels ahead.
ORDI spent months building a base below the 0.236 level at $4.805. A green accumulation zone formed between $3.60 and $4.00 from late 2025 through early 2026, with a series of higher highs and higher lows developing inside that range.
 ORDI/USDT hourly chart / Source: Tradingview
Today’s candle drove price through that zone and into the 0.382 resistance band at $6.488. A volume spike dwarfing recent activity fueled the move, with the daily bar reaching a high of $7.500 before pulling back toward $6.696.
The daily RSI is printing approximately 89, its highest reading in months. That level sits deep in overbought territory. A daily close above $6.488 would confirm the level as broken and redirect focus to higher targets. A rejection here could send ORDI back toward the $4.805 support.
One-Hour Chart Confirms Trend With No Bearish Divergence
The overbought daily RSI introduces caution. The one-hour chart, however, offers a contrasting read on near-term momentum.
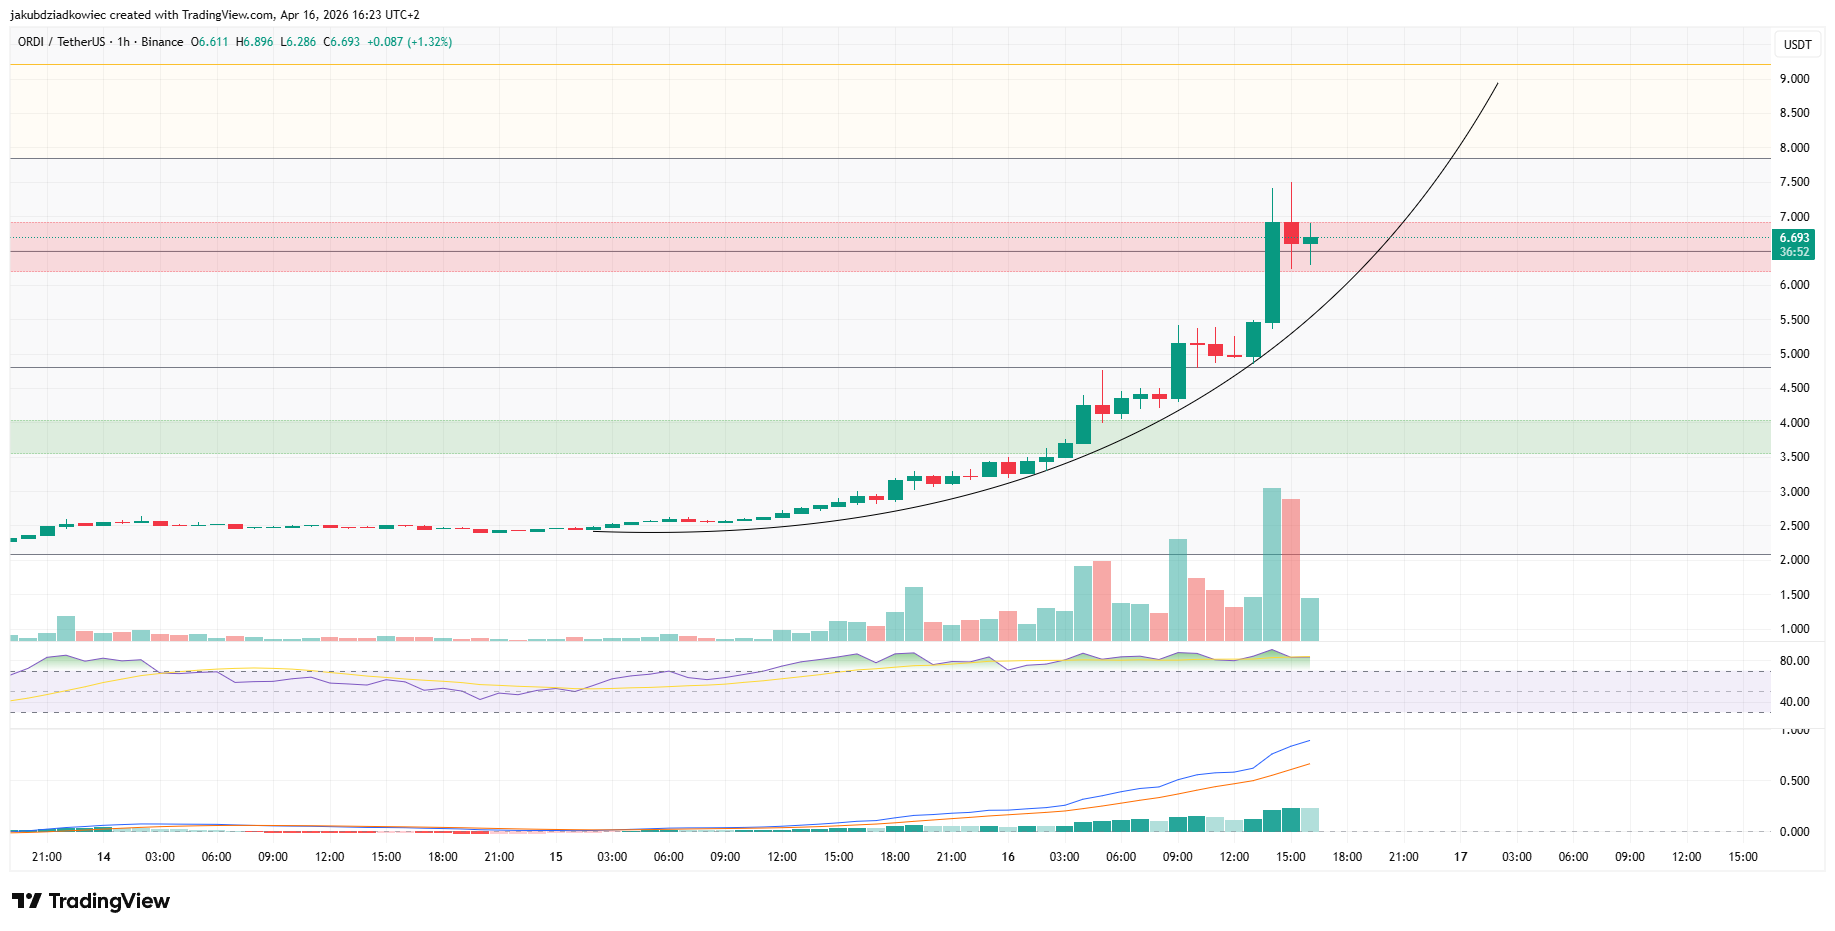
From April 13, ORDI tracked a black exponential growth curve, with each candle printing new highs at an accelerating pace. Price accelerated sharply on April 16, lifting from roughly $2.50 to a high of $6.896 in a matter of hours.
 ORDI/USDT hourly chart / Source: Tradingview
Neither the RSI nor the MACD on the one-hour timeframe shows any bearish divergence. Both indicators are rising alongside price, not lagging behind it. That distinction matters in strong trend environments, where ORDI has historically maintained momentum longer than overbought readings alone would suggest.
Price is currently consolidating inside the red resistance box between $6.50 and $7.00. A sustained break above that zone opens immediate targets at $8.00 and above $9.00. Should buyers lose control at current levels, the first meaningful support sits at the green zone between $3.60 and $4.00, with an intermediate buffer near $4.805.
ORDI Price Targets $11.40 as Falling Wedge Signals Extended Rally
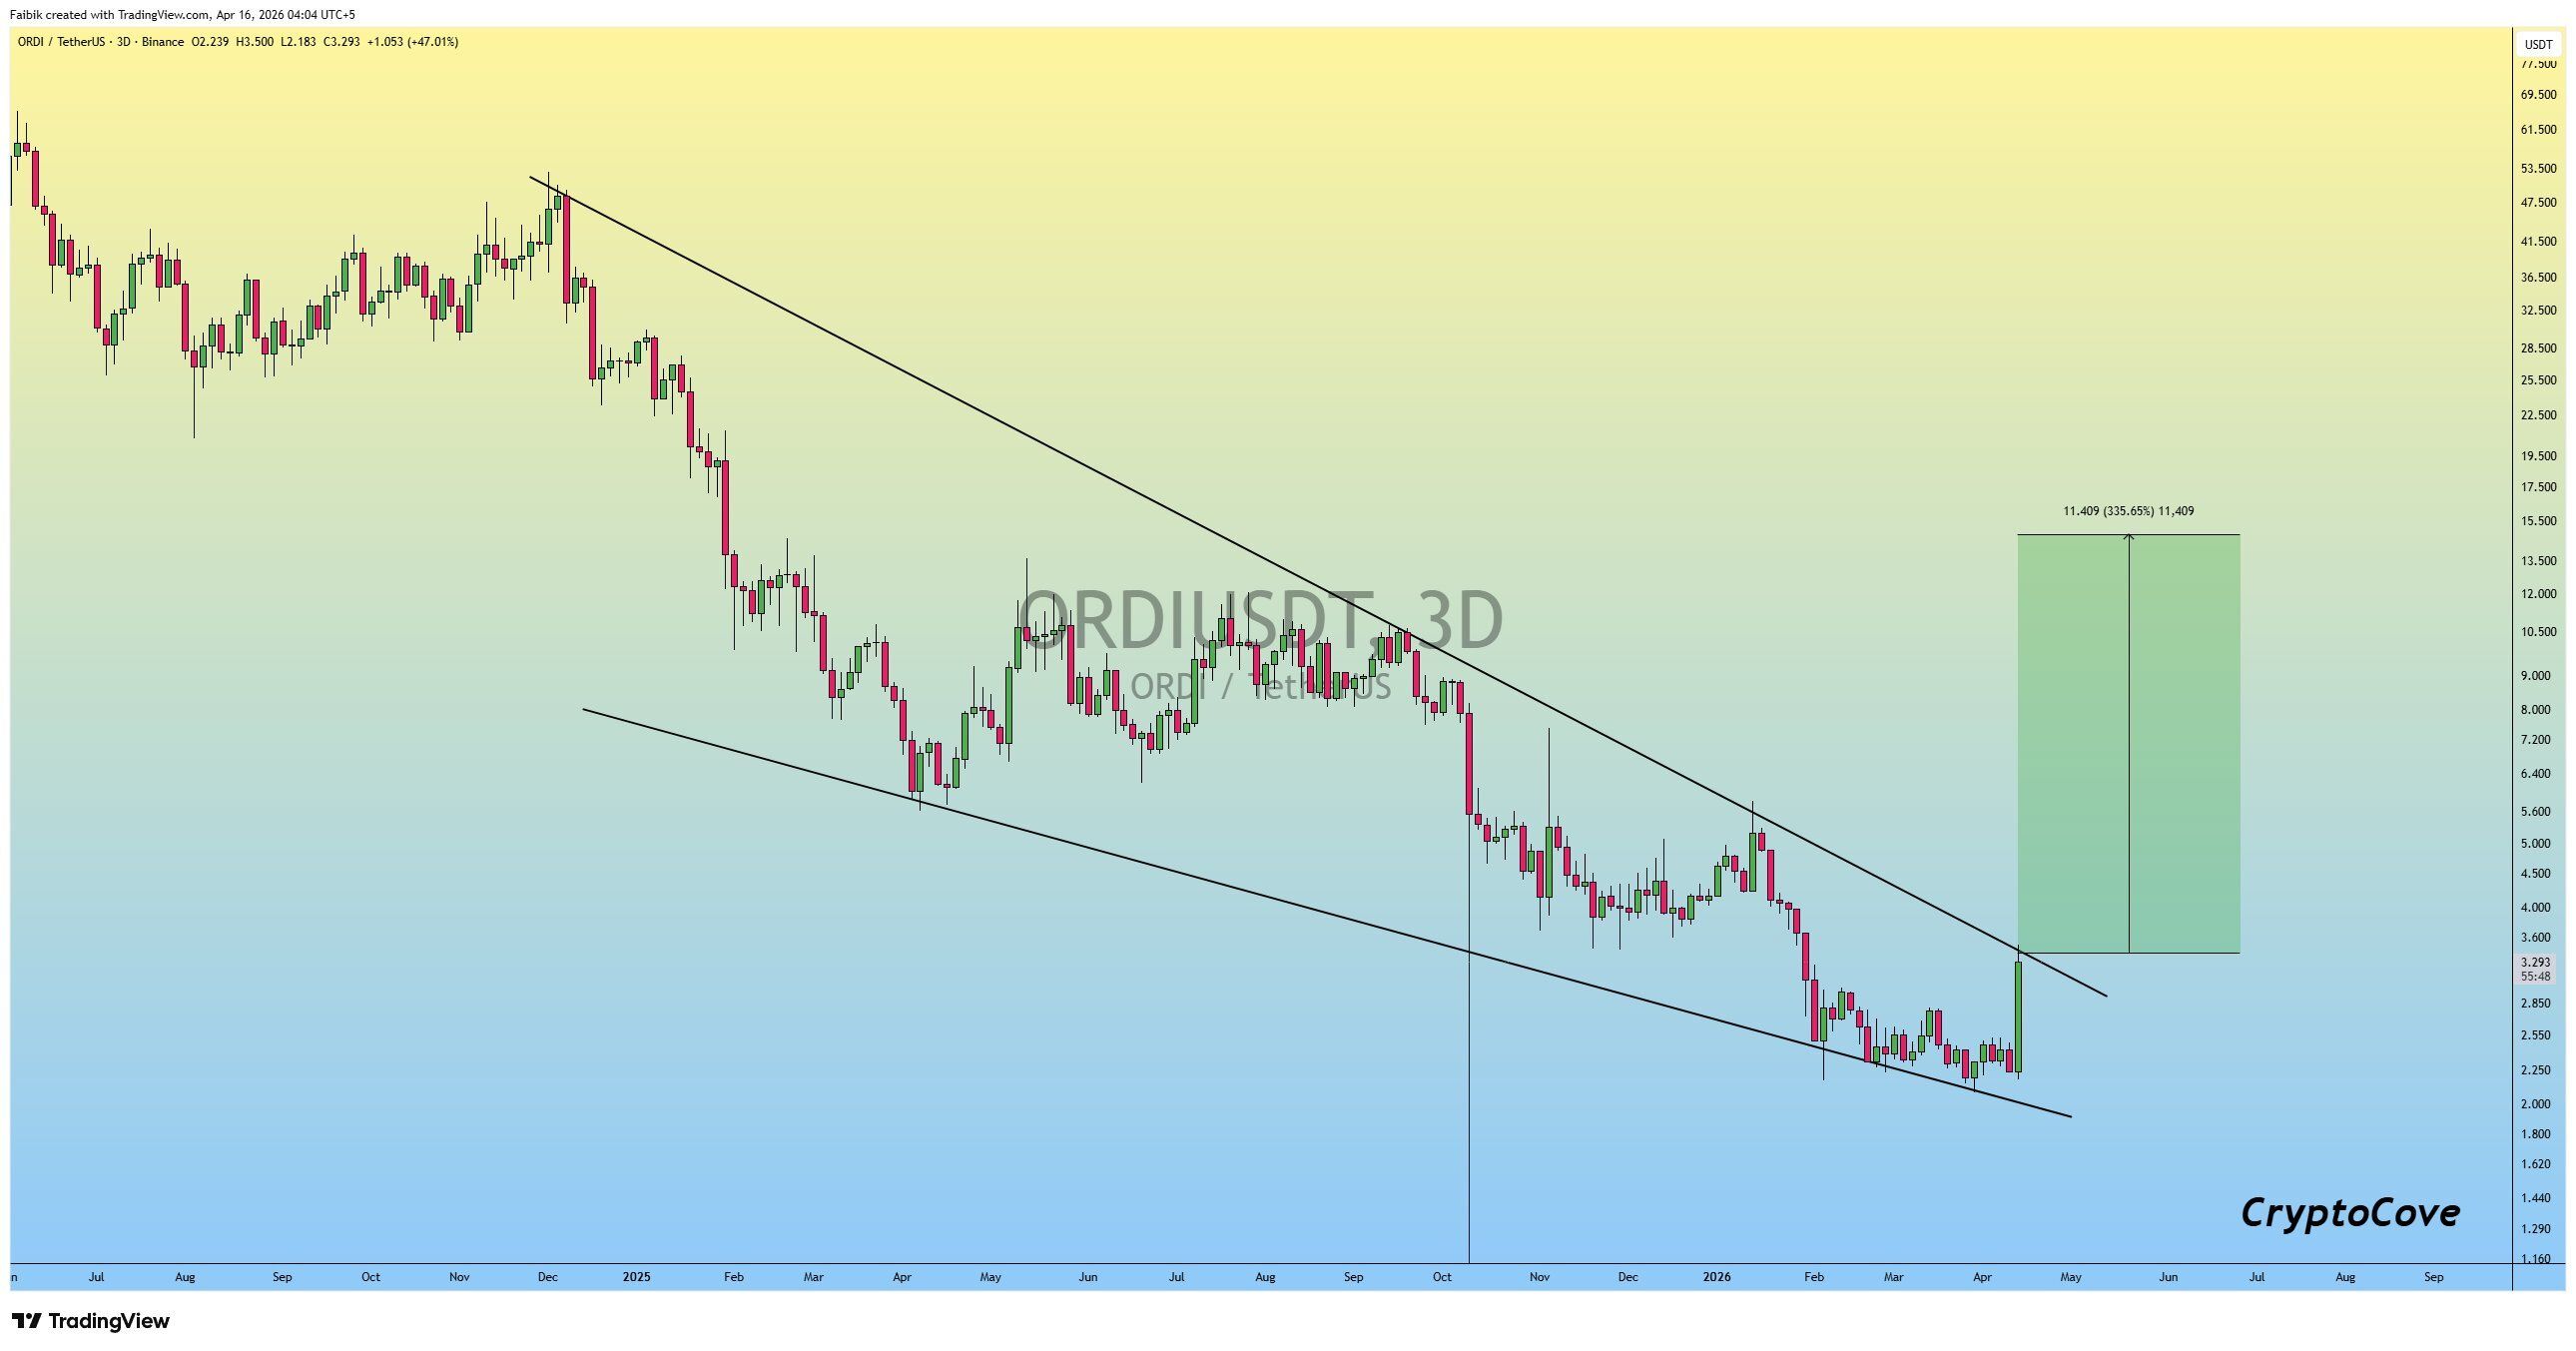
The three-day chart published by analyst @CryptoCove adds a longer-term structural argument to the Ordinals breakout thesis. A falling wedge pattern, visible since mid-2024, is now breaking out with force.
The analyst projects a 335.65% move from the breakout point, with a target of $11.409. That figure sits near the 0.786 Fibonacci retracement at $11.144 identified on the daily chart. Both signals converge around $11.40, strengthening the case for that target.
 ORDI/USDT 3-day chart / Source: X
Three resistance zones stand between current price and $11.40. The 0.5 Fibonacci level at $7.847 is the first test. The golden pocket at 0.618, near $9.207, follows. The 0.786 retracement at $11.144 is the final structural hurdle before new highs become possible.
A failure to hold above $6.488 would delay the setup and put the green support zone back in play. But the volume behind today’s move and the aligned signals across three timeframes suggest that any dip toward support may attract fresh buyers.
The post ORDI Surges 200% Amid Altcoin Rally, Prints God Candle appeared first on BeInCrypto.


 English (US) ·