
 7 hours ago
11
7 hours ago
11

Palantir stock enters a technically fragile setup ahead of its August 3 earnings. Trading at $123.53 on July 28, PLTR closed below all three key daily exponential moving averages. The broader trend is firmly bearish. The question now: can the stock defend critical support long enough for earnings to matter?
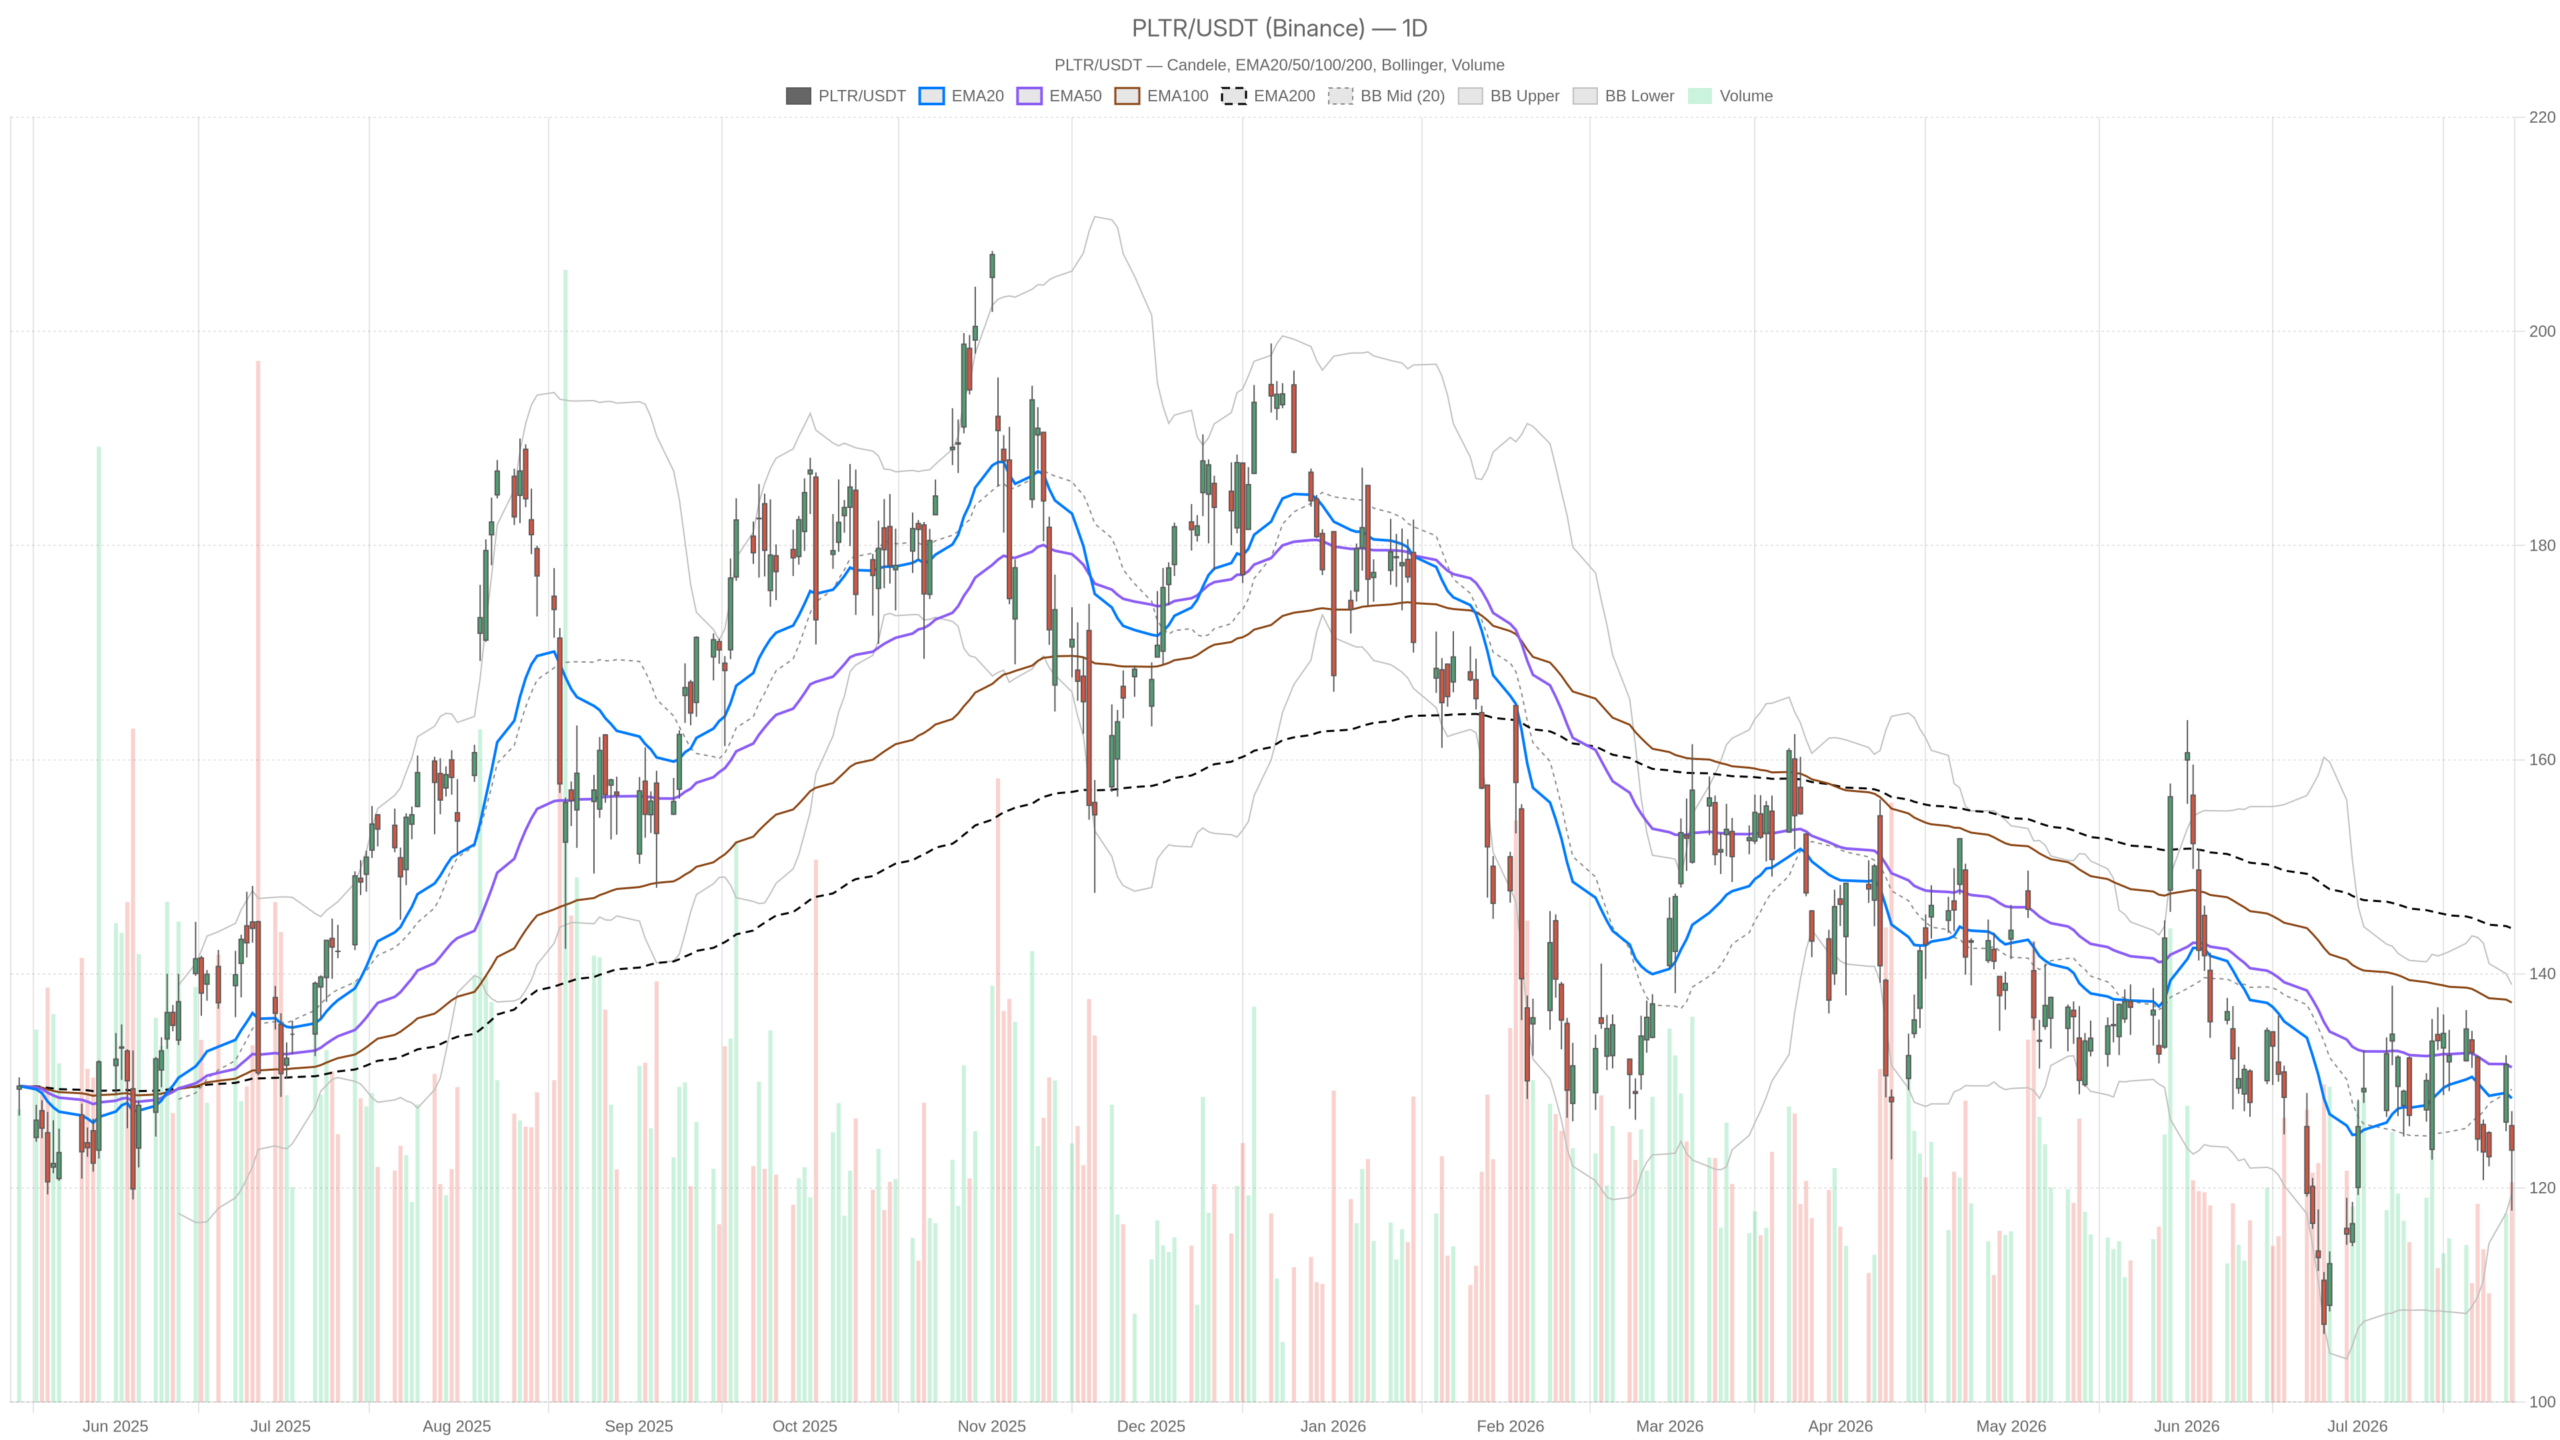 PLTR — daily chart with candlesticks, EMA20/EMA50 and volume.
Key takeaways
- PLTR closed at $123.53 on July 28, well below its EMA20 ($128.38), EMA50 ($131.26), and EMA200 ($144.26).
- Daily RSI at 44.5 sits in bearish territory without reaching oversold, leaving no exhaustion floor in place.
- The MACD bearish cross is confirmed, with the line at -0.82 running below the signal at -0.44.
- A daily ATR of 7.04 makes $7 swings the baseline; an earnings catalyst could amplify this significantly.
- A $200 price target and the $1 trillion thesis remain live narratives despite the technical weakness.
Palantir Stock Technical Picture: Daily Bias Remains Bearish
Palantir stock is in a confirmed bearish regime on the daily chart. Price trades below every major exponential moving average, and momentum indicators point uniformly lower. No divergence exists to challenge the dominant trend.
Moving Average Stack Confirms Distribution
PLTR closed at $123.53, sitting beneath its EMA20 at $128.38, its EMA50 at $131.26, and its EMA200 at $144.26. This stacked compression — where price trades below every dynamic level — is a classic distribution signal. Momentum is not merely fading. It points lower across the board.
Momentum Indicators Deteriorate
The daily RSI at 44.5 sits in bearish territory without yet reaching oversold levels. No technical floor has been built by extreme selling. Meanwhile, the MACD line at -0.82 runs below its signal at -0.44, with a negative histogram of -0.38. The bearish cross is firmly in place, and momentum continues to weaken.
Bollinger Bands and Pivot Zones
Bollinger Band structure reinforces the bearish story. Price closed near $123.53 against a lower band of $119.45 and a midline of $129.22. PLTR gravitates toward the lower half of the range, confirming that selling pressure remains dominant. The ATR at 7.04 signals wide daily swings are entirely normal in this environment.
In parallel, pivot analysis shows the daily pivot point at $122.87, with resistance at $127.84 and support at $118.55. The close just above the pivot suggests the market is balanced at a decision zone. A sustained break below $118.55 would shift the structure into a deeper corrective phase.
Hourly and Intraday Confirmation
The hourly chart does not challenge the bearish daily thesis — it reinforces it. Price on the 1H closed at $123.56, trading below its EMA20 at $125.42, EMA50 at $126.97, and EMA200 at $128.69. All three dynamic resistance layers sit overhead, forming a dense ceiling that any intraday bounce would need to clear convincingly.
In line with the daily picture, the hourly RSI at 44.36 nearly mirrors the daily reading. That alignment across timeframes removes ambiguity: momentum is not recovering intraday. On the contrary, the hourly MACD line at -0.83 running below the signal at -0.49 confirms short-term selling pressure remains consistent with the larger trend.
However, one detail from the 15-minute chart merits attention. The 15m MACD histogram has turned slightly positive at 0.10, even as the line stays negative at -0.64. This is a micro-signal at best — a temporary stabilization in selling velocity, not a reversal. It matters only for those managing very short-term entries. The overall regime across all three timeframes stays bearish.
The Bullish Scenario for Palantir Stock
Despite current technical weakness, Palantir stock carries a live bullish narrative that cannot be dismissed. A $200 price target and the $1 trillion thesis remain intact, and earnings could provide the trigger for a sharp directional shift.
A $200 price target has emerged from at least one analyst. Meanwhile, a Seeking Alpha piece published July 27 argues the $1 trillion thesis remains intact even after the pullback. These are not fringe views — they reflect real conviction about long-term growth drivers.
For the bullish case to activate technically, PLTR would need to close back above the EMA20 at $128.38 on the daily chart. That would mark the first meaningful reclaim of dynamic resistance. It would also put the daily pivot resistance at $127.84 in the rearview mirror. A strong earnings beat on August 3 is the most credible trigger for that move. Should the report exceed expectations, short covering and renewed momentum could push price toward the Bollinger midline at $129.22, and potentially the $131 zone near the EMA50.
Notably, a Yahoo Finance piece from July 28 referenced PLTR briefly overtaking the 20-day simple moving average. This suggests the stock has already tested that level recently. A decisive reclaim on earnings volume would carry far more weight than a brief intraday cross.
Bearish Risks Heading Into August 3 Earnings
The risk profile heading into earnings is not symmetric. Bears remain in control on the daily structure. A disappointing report could expose PLTR to a sharp decline toward key support levels that are already within striking distance.
In that scenario, if earnings disappoint — or if guidance fails to justify the prevailing valuation — daily support at $118.55 becomes the first line of defense. A break there would expose the stock to the lower Bollinger Band at $119.45, and potentially a deeper retracement. The ATR of 7.04 on the daily chart signals that a single session could cover that entire range.
With earnings approaching, implied volatility is likely already elevated. Oversized moves in either direction are the base case. The Motley Fool noted on July 29 that Palantir’s next earnings report could make or break its current valuation level. The technical setup does nothing to contradict that assessment.
A slide in Palantir stock was also flagged by Investing.com on July 28. The report pointed to session-level weakness that reinforced the bearish trend already visible in the daily data. That sell-side pressure, combined with all major EMAs acting as overhead resistance, leaves bulls defending a thin ledge above the pivot point.
Positioning and Volatility: A Market at a Crossroads
Overall, Palantir stock presents a technically bearish picture across all timeframes. No meaningful divergence exists between the daily and hourly signals. However, the August 3 earnings event introduces a binary dimension that technical analysis alone cannot resolve.
The daily regime is bearish. Momentum indicators are uniformly negative. Price sits below every key moving average. Still, the earnings catalyst could deliver moves that dwarf the current technical range. The daily ATR of 7.04 means normal sessions already produce significant swings. An earnings event on top of that structure amplifies the uncertainty further.
Therefore, positioning around PLTR at this stage requires a clear view on the earnings outcome — not just the chart. Bulls need the fundamental catalyst to fire. Bears have the technical structure on their side. Neither camp should treat the current setup as settled.
FAQ
What is the current technical outlook for Palantir stock?
Palantir stock is in a confirmed bearish regime. PLTR closed at $123.53 on July 28, trading below its EMA20, EMA50, and EMA200 on the daily chart. The RSI sits at 44.5 in bearish territory, and the MACD bearish cross remains intact. No meaningful divergence exists across timeframes to challenge the dominant trend.
What key levels should traders watch in Palantir stock?
The daily pivot point at $122.87 serves as a near-term decision zone. Support sits at $118.55, with the lower Bollinger Band at $119.45 adding confluence. On the upside, PLTR must reclaim the EMA20 at $128.38 before any bullish case gains credibility. Resistance extends to the Bollinger midline at $129.22 and the EMA50 near $131.
What would flip the Palantir stock outlook to bullish?
A close back above the EMA20 at $128.38 would mark the first meaningful reclaim of dynamic resistance. The most credible trigger for such a move would be a strong earnings beat on August 3. Should that occur, short covering and renewed momentum could push PLTR toward the $131 zone near the EMA50. A $200 price target and the $1 trillion thesis remain live narratives.
When are Palantir’s next earnings?
Palantir reports earnings on August 3. The event is widely viewed as a binary catalyst that could make or break the stock’s current valuation, according to commentary from The Motley Fool on July 29.
Disclaimer: This article is for informational purposes only and does not constitute financial advice, an investment recommendation, or a solicitation to buy or sell any financial instrument or cryptocurrency. The analysis provided is not indicative of future results. Investing in crypto assets and financial markets carries a high risk of capital loss. Always do your own research (DYOR) and consult a qualified financial advisor before making any decision.
Article produced with the assistance of artificial intelligence and reviewed by the editorial team.








 English (US) ·