
 1 month ago
40
1 month ago
40
CAKE is trading at $1.42 as of June 16, 2026, with the PancakeSwap price reclaiming both the 20-day and 50-day EMAs. The move signals a quiet shift in momentum even as the broader crypto market remains gripped by Extreme Fear, per CoinGecko’s Fear & Greed index at 23.
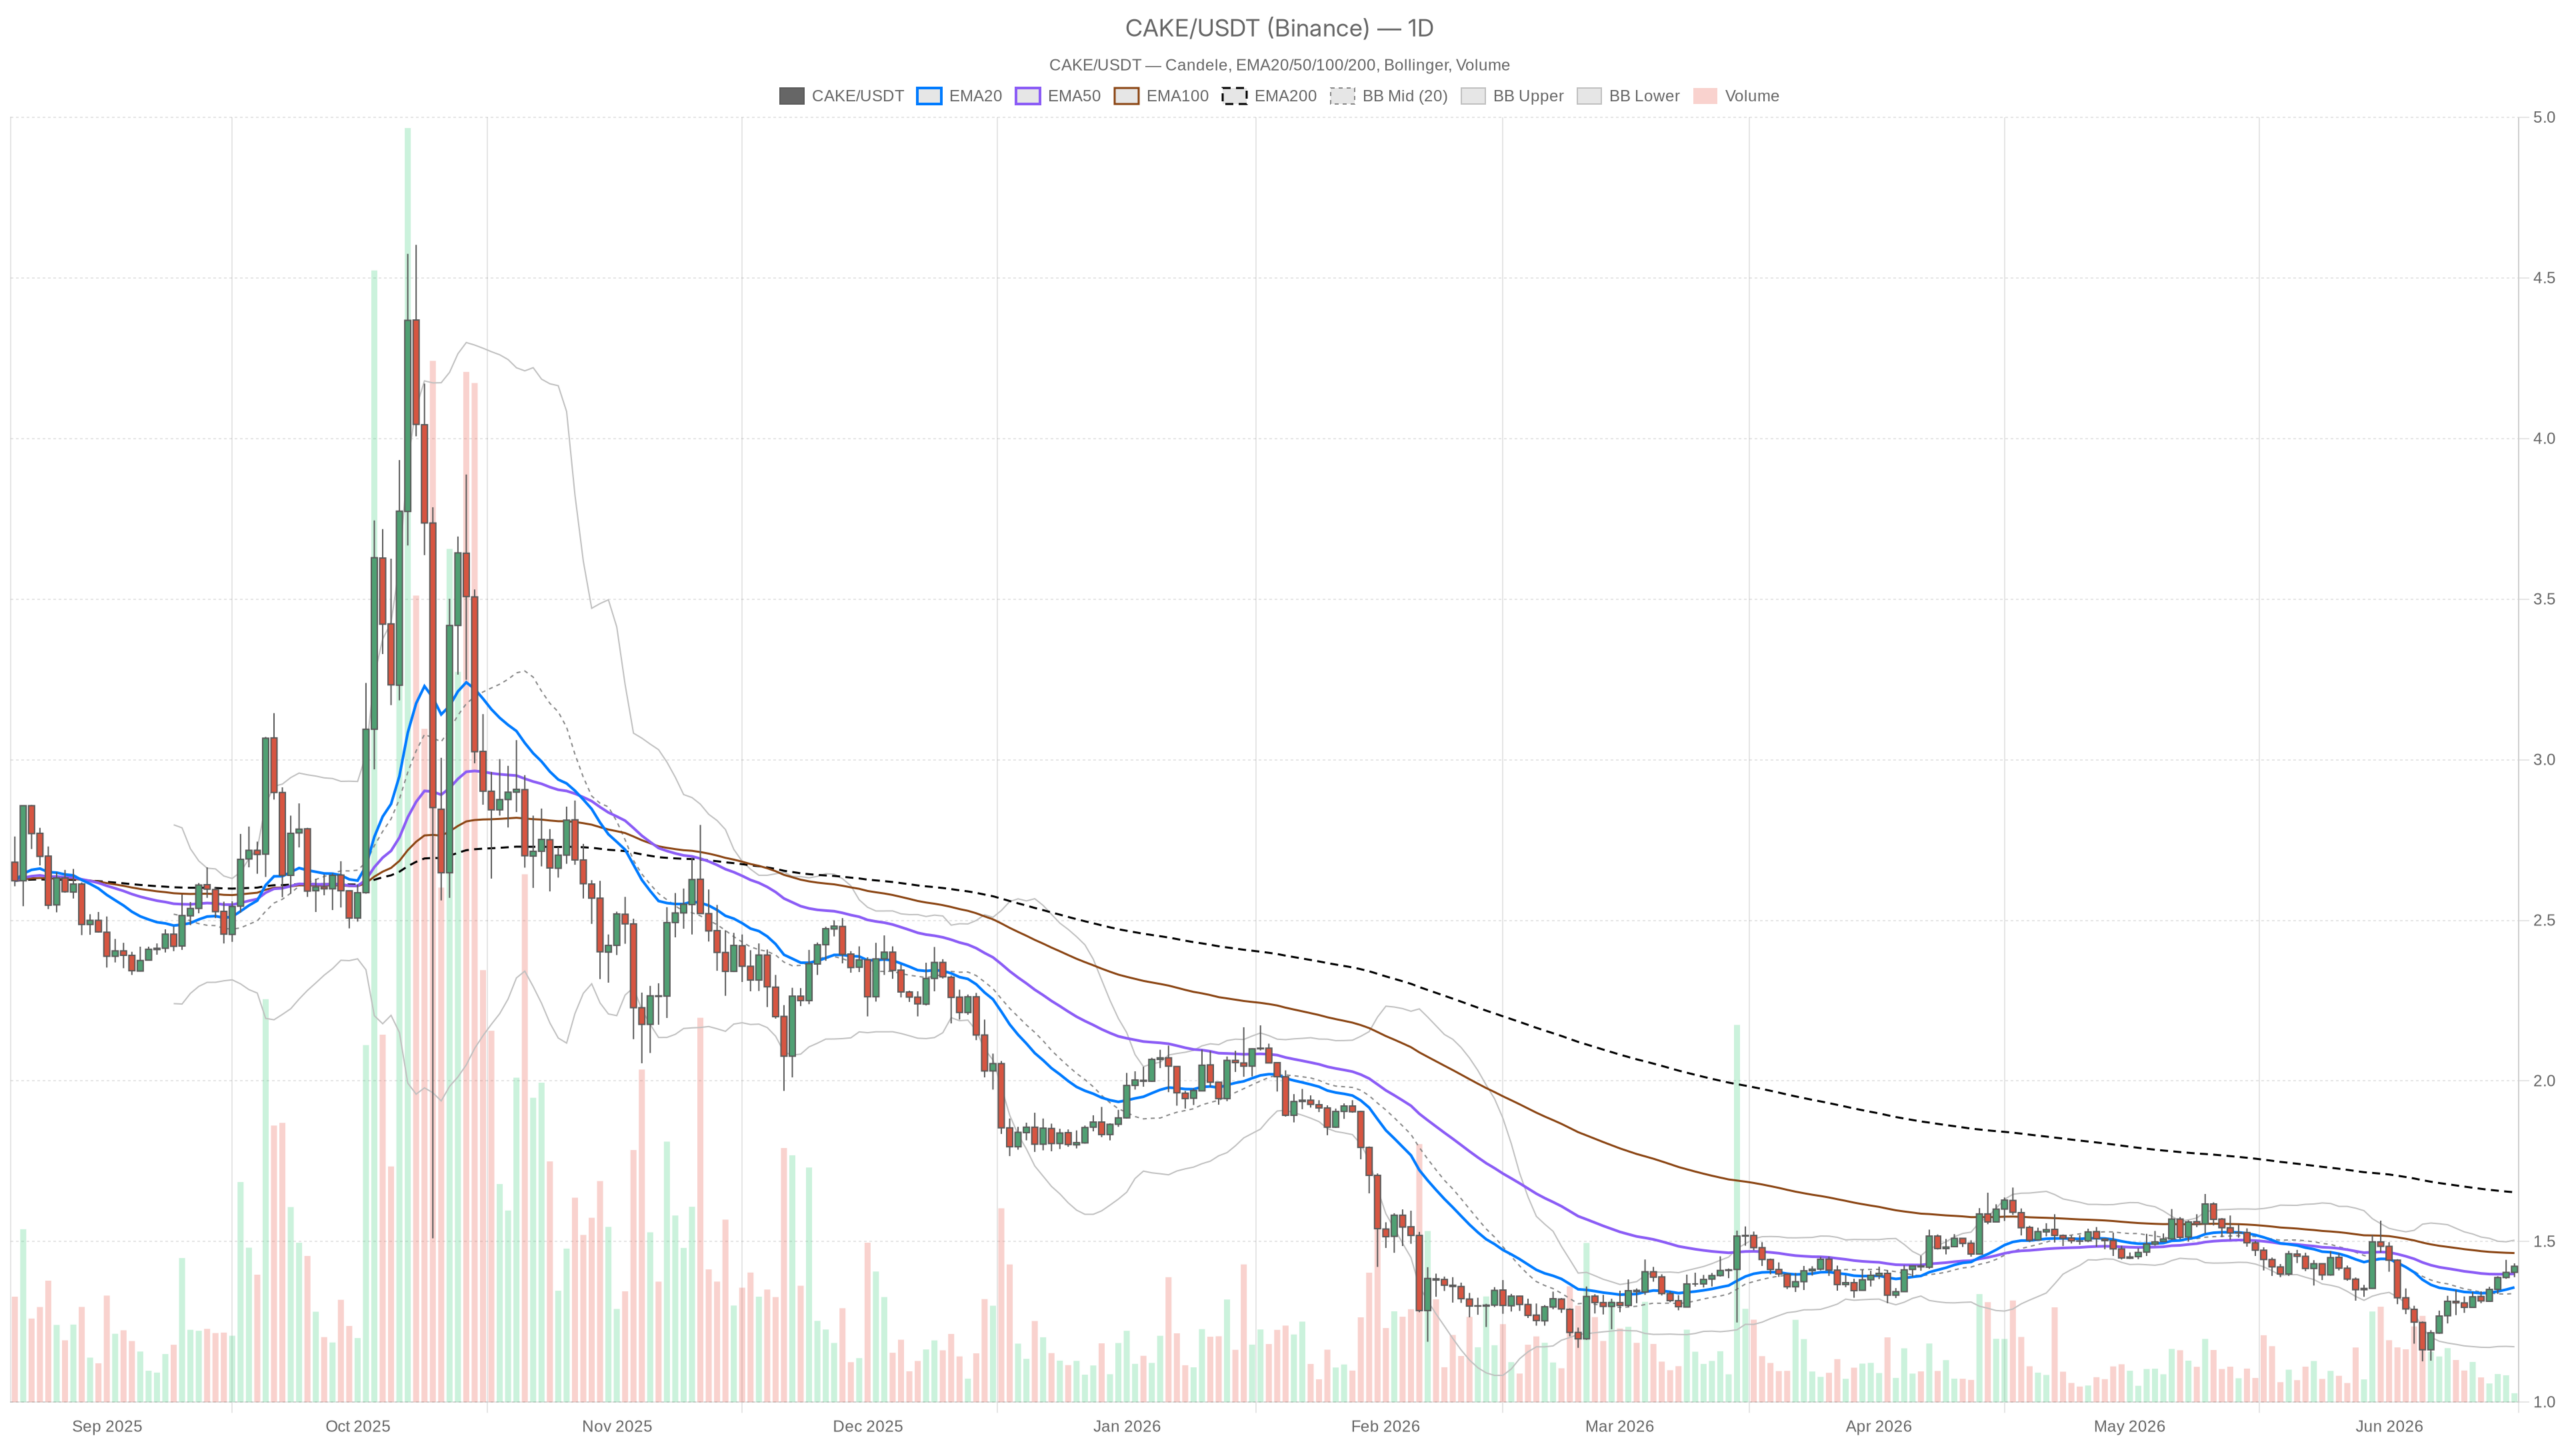 CAKE/USDT — daily chart with candlesticks, EMA20/EMA50 and volume.
Key takeaways
- CAKE trades at $1.42, holding above both the 20-day EMA at $1.36 and the 50-day EMA at $1.40.
- Daily RSI stands at 56.03, reflecting recovering momentum without yet approaching overbought territory.
- The 200-day EMA at $1.65 remains a major structural resistance, sitting more than 16% above current price.
- A breakout above $1.44 could open the path toward $1.50, while failure to hold $1.40 would shift focus to the $1.34 midline.
- BTC dominance at 56.5% continues to act as a headwind for altcoins broadly.
The Daily Picture: Neutral Label, but the Details Tell More
The answer is nuanced: CAKE’s daily chart appears neutral on the surface, yet the underlying indicators reveal a recovery that is quietly gaining traction. On the daily chart, CAKE closed at $1.42. The EMA stack tells a layered story: the 20-day sits at $1.36, the 50-day at $1.40, and the 200-day at $1.65. Price has climbed above the first two, marking the first time in a while the short-term trend has flipped constructive. However, the 200-day EMA remains a hard ceiling more than 16% above current price. The macro trend is still structurally bearish, and any optimism must be tempered accordingly.
The daily RSI at 56.03 reinforces this cautious view. Momentum has recovered from oversold territory into mid-range without threatening overbought conditions. This is the zone where recoveries can extend or stall. It offers no strong directional signal on its own, but the direction of travel matters: it has been moving upward, not downward. That shift deserves attention.
The MACD on the daily remains slightly negative on the line at -0.01 versus the signal at -0.03, yet the histogram has turned positive at +0.02. This is the early fingerprint of a bullish crossover developing. It is not confirmed and not aggressive, but the selling pressure that dominated the recent downtrend is visibly exhausting. A histogram climbing while price consolidates above key EMAs is exactly the setup traders look for before a larger move.
Bollinger Bands on the daily place the midline at $1.34, the upper band at $1.50, and the lower band at $1.17. CAKE is trading comfortably above the midline with meaningful room before hitting the upper band. That distance does not license chasing, but it confirms the price is not stretched or overextended at current levels. The daily ATR sits at $0.07, meaning the token can cover roughly 5% of its current price in a single session. Volatility is moderate and manageable, not explosive.
Daily pivot analysis places the pivot point at $1.41, with R1 resistance at $1.44 and S1 support at $1.40. CAKE is essentially glued to the pivot right now, trading above S1 and just beneath R1. A clean close above $1.44 on the daily would represent a minor but meaningful breakout.
Hourly Structure: Short-Term Bulls Have the Edge
Yes, the short-term bulls do have the edge on the hourly chart, where the regime label shifts to outright bullish. All three key EMAs — the 20 at $1.41, the 50 at $1.39, and the 200 at $1.34 — are stacked below price in perfect bullish order. This kind of EMA alignment, where price floats above a rising structure, is the hallmark of a trend in motion rather than a random bounce.
Hourly RSI at 61.36 is elevated but not yet in the danger zone. It suggests the move has legs without being in immediate need of a breather. Meanwhile, the hourly MACD is flat — line and signal both at 0.01, histogram at zero — which means momentum is holding rather than accelerating. That is not a warning sign, but a reminder that the current move is grinding rather than surging.
The hourly Bollinger Bands, with the midline at $1.41, upper band at $1.43, and lower band at $1.39, show price pressing against the upper band. That signals short-term strength, but also marks a natural friction point. The upper band on the 1H aligns almost perfectly with R1 resistance at $1.43. If CAKE cannot push through that level and hold, a reversion toward the $1.40–$1.41 zone becomes likely — an area that also doubles as the 1H pivot support cluster.
The 15-Minute Frame: Running Hot Into Resistance
On the 15-minute chart, RSI has nudged up to 64.74, close enough to overbought that aggressive entries here carry real short-term risk. The 15M EMA structure mirrors the 1H: all three EMAs — the 20 at $1.42, the 50 at $1.41, and the 200 at $1.39 — are stacked bullishly beneath price. That said, the MACD on this timeframe is flat at near-zero, confirming the move is coasting rather than accelerating. For anyone considering an entry, this is not the moment to chase. It is the moment to wait for either a breakout above $1.43 with volume or a pullback toward the $1.40–$1.41 support zone.
The DEX Context: Fees Are Moving
According to DefiLlama data, DEX fee activity across the sector has spiked sharply in the last 24 hours, with Uniswap V3 fees up 168% and Fluid DEX up over 210% day-on-day. This broader uptick in on-chain trading volume creates an environment where the PancakeSwap price could see fundamental support through increased CAKE utility and protocol revenue. PancakeSwap remains one of the dominant DEXs on BNB Chain and historically benefits from such spikes. It does not guarantee a price move, but the backdrop is briefly constructive.
Bullish Scenario
The constructive case is straightforward: CAKE has reclaimed both the 20-day and 50-day EMAs, the daily MACD histogram is turning positive, and the hourly structure is cleanly bullish. If the token can break and close above $1.44 — daily R1 — on meaningful volume, the next logical target becomes the $1.50 upper Bollinger Band, roughly 5.6% above the current price. A sustained move above $1.50 would open the door toward $1.65, where the 200-day EMA sits as major resistance.
This scenario requires the broader market to stabilize and ideally for BTC dominance to ease slightly, giving altcoins room to breathe. It is invalidated if CAKE fails to hold above $1.40. A daily close below that level would confirm the reclaim of the EMAs was a false breakout, and attention would shift back to the $1.34 midline and eventually the $1.17 lower band.
Bearish Scenario
The case for caution is equally clear. The 200-day EMA at $1.65 is a significant structural overhang: CAKE remains deeply below its long-term average, and the market sentiment index at 23 — Extreme Fear — reminds us this is not a risk-on environment. Moreover, BTC’s dominance at 56.5% is a persistent headwind for altcoins broadly. If the current bounce runs out of steam at the $1.43–$1.44 resistance band and the daily MACD histogram rolls back down without completing a full crossover, the setup reverts to a lower-high formation — exactly what one would expect in a bear-market rally.
In that case, CAKE likely drifts back toward $1.34–$1.36, and a failure there would bring the $1.17 lower band into focus. This scenario is invalidated by a clear break and hold above $1.50 on the daily, which would represent a genuine structural shift in the medium-term trend.
Reading the Room
What CAKE is doing right now is building a case, not closing one. The short-term structure is bullish, the daily momentum is improving, and the fundamental DEX environment offers at least a tailwind. However, the macro picture — Extreme Fear, high BTC dominance, price still 14% below the 200-day EMA — is a reminder that this token has not yet escaped its longer-term downtrend. It is bouncing within it.
The zone between $1.40 and $1.44 is where conviction gets tested. Traders sitting in positions need to assess honestly whether this move has the fuel to push through R1, or whether the 15M RSI near 65 and the 1H upper Bollinger Band are signaling a short-term top forming. Both narratives are alive simultaneously, which is precisely what makes this level worth watching closely. Position sizing and stop placement matter more than directional conviction right now.
FAQ
Is CAKE’s current bounce sustainable?
Sustainability depends on whether CAKE can break and hold above $1.44 with volume. The short-term EMA stack is supportive and the MACD histogram is turning positive, but the 200-day EMA at $1.65 looms as a major structural overhang. Without a broader improvement in market sentiment, the bounce risks exhausting at current resistance levels.
What are the key resistance levels CAKE must overcome?
The immediate resistance sits at $1.44, aligning with the daily R1 pivot. A break above that opens the path to the $1.50 upper Bollinger Band. The most significant resistance, however, is the 200-day EMA at $1.65, which marks the boundary between the current bearish macro trend and any potential trend reversal.
How does BTC dominance affect CAKE’s outlook?
BTC dominance at 56.5% typically means capital is concentrating in Bitcoin rather than flowing to altcoins. For CAKE to sustain a meaningful rally, BTC dominance would likely need to ease, allowing altcoins room to attract speculative and structural flows. Until then, the dominance reading acts as a headwind.
What would invalidate the bullish scenario?
A daily close below $1.40 would invalidate the constructive setup, confirming the EMA reclaim was a false breakout. In that case, attention shifts downward to the $1.34 midline and ultimately the $1.17 lower Bollinger Band. The bullish scenario also weakens considerably if the MACD histogram rolls back down without completing its crossover.
CAKE finds itself at a genuine inflection point, where short-term technicals have turned constructive but the macro backdrop remains unforgiving. The interplay between the $1.40–$1.44 range and broader market sentiment will likely determine whether this recovery has staying power or whether it fades back into the longer downtrend that the 200-day EMA continues to define.
Disclaimer: This article is for informational purposes only and does not constitute financial advice, an investment recommendation, or a solicitation to buy or sell any financial instrument or cryptocurrency. The analysis provided is not indicative of future results. Investing in crypto assets and financial markets carries a high risk of capital loss. Always do your own research (DYOR) and consult a qualified financial advisor before making any decision.
Article produced with the assistance of artificial intelligence and reviewed by the editorial team.


 English (US) ·