
 3 weeks ago
40
3 weeks ago
40

Paramount Stock (PSKY) trades at $10.17 as merger optimism builds around the $110 billion Warner Bros. Discovery acquisition. However, the daily chart remains neutral ahead of the July 22 EU regulatory decision.
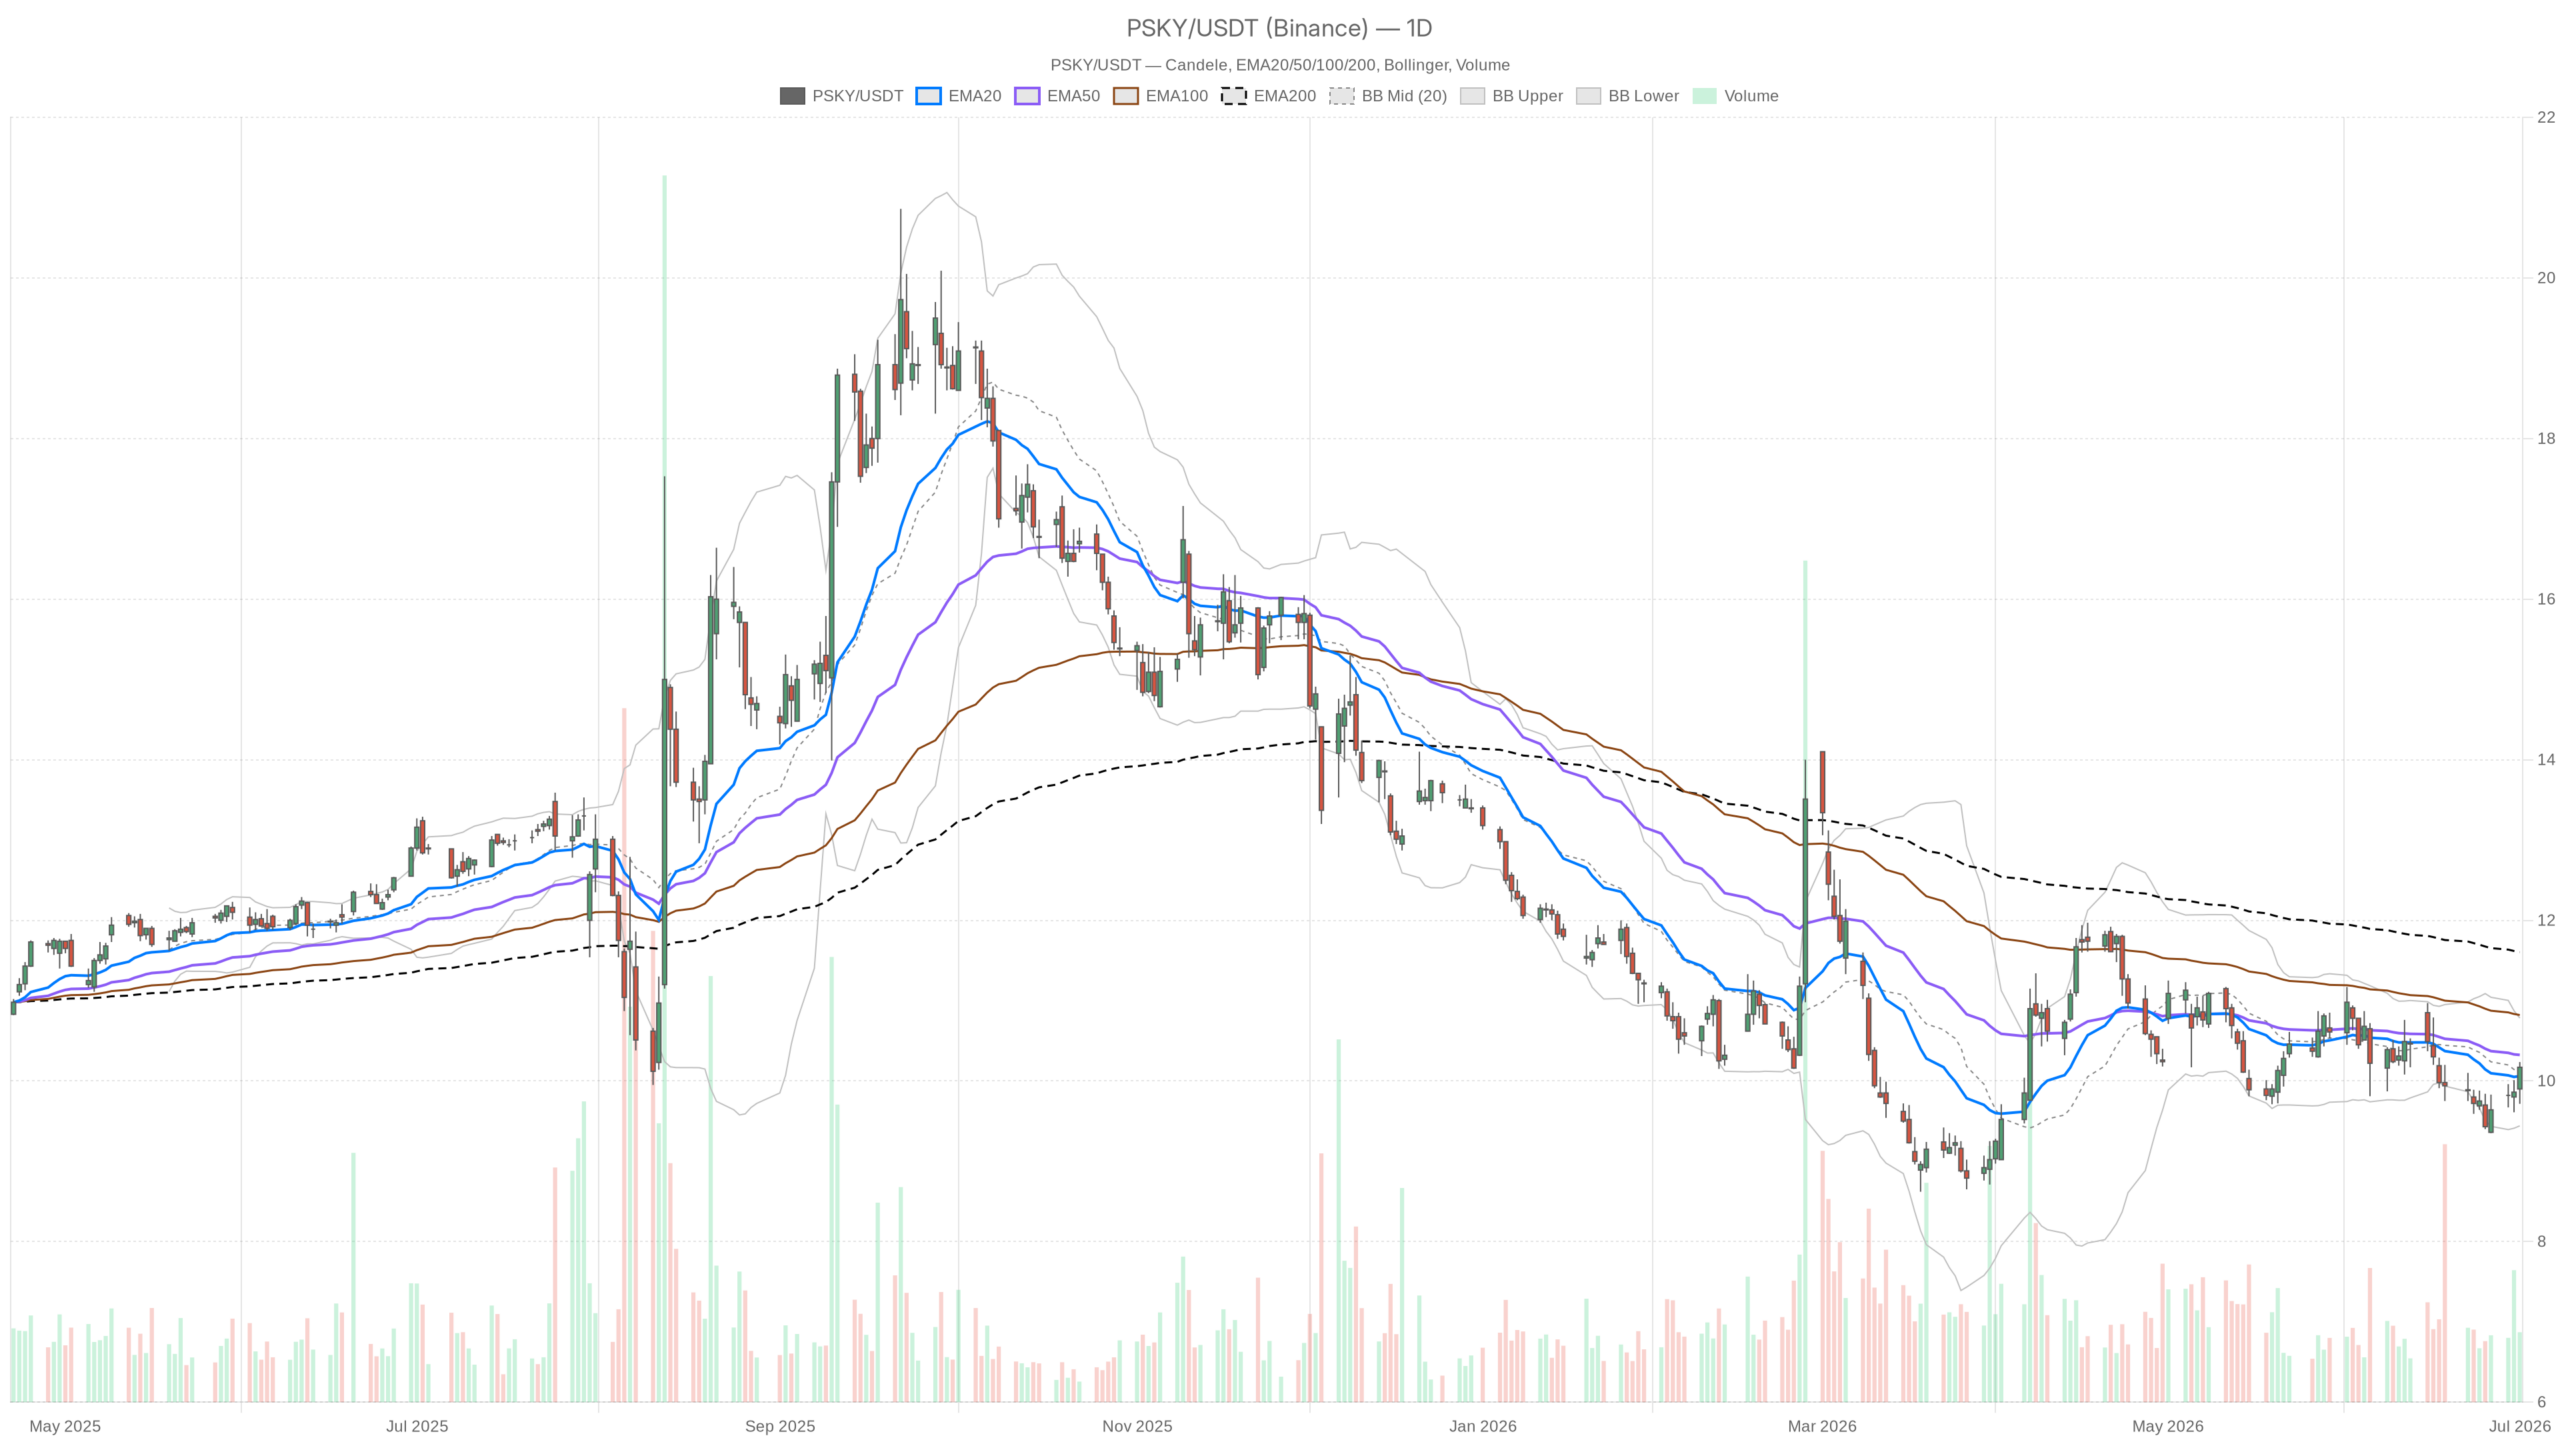 PSKY — daily chart with candlesticks, EMA20/EMA50 and volume.
Key takeaways
- Paramount Stock closed at $10.17, above the EMA20 ($10.06) but below the EMA50 ($10.32)
- The EU antitrust decision, now delayed to July 22, is the primary catalyst for the next directional move
- Daily RSI sits at 50.67, exactly on the midline, confirming a neutral momentum regime
- Hourly momentum is bullish with a live MACD cross, but faces resistance near $10.24
- Key levels: support at $9.84 (daily S1), resistance at $10.36 (daily R1 and EMA50)
The fundamental catalyst is hard to ignore. Paramount has reportedly agreed to exit its international film distribution joint venture with Universal Pictures. This concession is designed to satisfy EU antitrust concerns. The EU decision, now delayed to July 22, remains the single most important near-term event for the stock. Meanwhile, the extension of tender and exchange offer deadlines last week signals the process is still active, not stalled.
Paramount Stock Daily Chart: Neutral Regime With Upside Friction
The daily chart shows a neutral regime with no directional momentum. Price sits between key moving averages, and both the MACD and RSI confirm a market in equilibrium.
Momentum Indicators Show Stalled Direction
Price closed at $10.17, sitting above the EMA20 at $10.06 but below the EMA50 at $10.32. The EMA200 remains far overhead at $11.60, reflecting how much ground has been lost over a longer horizon.
The daily MACD is telling: the line and signal are both at -0.18, with a histogram reading of zero. That is not momentum building — it is momentum stalling. The RSI at 50.67 sits almost exactly on the midline. Neither overbought nor oversold, it suggests the market is genuinely undecided. There is no directional pressure in either direction from a momentum standpoint.
Key Levels and Resistance Zones
Meanwhile, Bollinger Bands place the midline at $10.11, the upper band at $10.78, and the lower band at $9.44. Current price sits just above the midline, inside the range — not stretched, not compressed. The ATR of $0.44 points to moderate daily volatility, which is meaningful context ahead of a binary regulatory event.
Pivot analysis gives a daily PP at $10.04, R1 at $10.36, and S1 at $9.84. Paramount Stock closed above its pivot point — a mild positive. However, the first real resistance at $10.36 aligns closely with the EMA50. That level is the key short-term ceiling.
Hourly Timeframe: Short-Term Strength Pushing Against Resistance
The hourly chart is more constructive, with short-term momentum leaning bullish. Price has broken above the EMA20 and EMA50, and a live MACD bullish cross is gaining traction.
On the hourly, price has broken above the EMA20 ($9.96) and EMA50 ($9.90). It is essentially testing the EMA200 at $10.14. The RSI at 64.81 is elevated and approaching overbought territory. Meanwhile, the MACD is positive — line at 0.11, signal at 0.08, histogram at 0.03 — confirming a live bullish cross that is still gaining traction.
However, the hourly Bollinger upper band sits at $10.24, and price is pressing right against it at $10.16–$10.23. That compression near the upper band, combined with an RSI pushing toward 65, suggests the short-term move is becoming extended. The hourly pivot R1 is also at $10.24, creating a zone of meaningful near-term resistance. A clean break and hold above $10.24 on the hourly would be an important short-term confirmation signal.
In contrast to the cautious daily view, the hourly momentum is clearly leaning bullish. This divergence between timeframes is worth watching. The 1H is pulling price upward on merger optimism, while the daily has yet to confirm any structural shift in bias.
15-Minute Chart: Bullish Micro-Regime, Limited Execution Room
The 15-minute chart is bullish but compressed. All three EMAs are stacked bullishly, though price is pressing against the upper Bollinger Band, limiting immediate upside room.
On the 15-minute chart, the regime is flagged as bullish. All three EMAs are stacked bullishly — EMA200 at $9.89, EMA50 at $10.00, EMA20 at $10.10 — with price at $10.16. The RSI at 61.28 is moderately strong. However, the MACD histogram is slightly negative at -0.01, hinting at very minor short-term deceleration, but not enough to reverse the micro-trend.
Notably, the 15m Bollinger Bands are compressed. The upper band sits at $10.18 and the lower at $10.08, with price pressing against the top of that range. This is consistent with a short squeeze scenario heading into the close or in anticipation of further merger news. For tactical positioning, the $10.13 area (15m S1) is the immediate support to watch. A slip below that level could signal intraday exhaustion.
Bullish Scenario: EU Approval Unlocks the Next Move
EU approval would likely unlock a move toward the $10.36–$10.78 range. The hourly setup is already aligned, and only a daily catalyst is needed to confirm the directional shift.
The bullish case for Paramount Stock is largely regulatory. If the EU grants approval — even with conditions — the stock has a clear technical path toward the $10.36–$10.78 range. The $10.36 level coincides with the EMA50 and daily R1. The Bollinger upper band at $10.78 would then represent the next meaningful ceiling. A decisive MACD cross into positive territory on the daily would further validate that scenario.
Additionally, any progress on the tender offer extension or further concession announcements could sustain buying pressure in the interim. The stock is not technically overextended on the daily. There is room to move before hitting supply.
Bearish Scenario: Regulatory Delays Keep the Ceiling Intact
If the EU deadline passes without resolution, support at $9.84 and then $9.44 comes into play. The flat daily MACD offers no momentum cushion against selling pressure.
On the other hand, if the July 22 EU deadline passes without resolution, the technical setup offers little structural support below current levels. This is especially true if the concession strategy fails to satisfy regulators. The daily pivot S1 is at $9.84. Below that, the Bollinger lower band at $9.44 becomes the next zone of meaningful support. The EMA200 at $11.60 remains a distant ceiling that would only become relevant in a dramatic re-rating scenario.
Furthermore, the MACD flat-zero histogram on the daily means there is no underlying momentum cushion. Any deterioration in the merger narrative would likely see sellers emerge quickly. The RSI at 50.67 leaves room to fall toward oversold without much technical argument for a bounce. A sustained close below the EMA20 ($10.06) would invalidate the near-term bullish thesis from the hourly chart.
Positioning Into a Binary Event
Paramount Stock is a fundamentally-driven story wrapped in a technically neutral package. The real directional move likely waits for the regulatory headline.
Overall, PSKY presents a layered picture. The daily chart is unconvinced, the hourly is optimistic, and the 15m is momentarily bullish. That layered disagreement reflects the market’s own uncertainty about the regulatory outcome. Volatility is moderate — the daily ATR of $0.44 is manageable — but that could shift sharply around the EU decision on July 22.
For now, the stock is trading above its daily pivot and below its first key resistance. That is not a strong technical position in either direction. The real move — up or down — likely waits for the regulatory headline. Until then, positioning should account for a potentially wide range of outcomes. The $10.36 resistance and $9.84 support define the boundaries of the current contested zone.
FAQ
What is the key catalyst for Paramount Stock right now?
The EU antitrust decision on the Warner Bros. Discovery acquisition, now expected by July 22, is the single most important near-term event. Paramount has already agreed to exit its international film distribution joint venture with Universal Pictures to address EU concerns.
What are the key technical levels to watch on Paramount Stock?
Resistance sits at $10.36 (daily R1 and EMA50) and $10.78 (Bollinger upper band). Support levels are at $9.84 (daily S1) and $9.44 (Bollinger lower band). A close above $10.36 would signal bullish confirmation, while a break below $9.84 would shift the outlook bearish.
Is Paramount Stock trending bullish or bearish right now?
The daily chart is neutral — the RSI sits at 50.67 on the midline, and the MACD histogram reads zero. However, the hourly timeframe shows bullish momentum with a live MACD cross. The market is effectively waiting for a catalyst to resolve this divergence.
What happens if the EU rejects or delays the merger further?
A rejection or further delay without resolution would likely trigger selling pressure. With the daily MACD flat and RSI at neutral, there is little technical cushion. Paramount Stock could test support at $9.84 and potentially $9.44 in a bearish scenario.
Disclaimer: This article is for informational purposes only and does not constitute financial advice, an investment recommendation, or a solicitation to buy or sell any financial instrument or cryptocurrency. The analysis provided is not indicative of future results. Investing in crypto assets and financial markets carries a high risk of capital loss. Always do your own research (DYOR) and consult a qualified financial advisor before making any decision.
Article produced with the assistance of artificial intelligence and reviewed by the editorial team.


 English (US) ·