
 1 hour ago
5
1 hour ago
5

PayPal stock enters the new session at a technical crossroads. The daily chart still shows a well-established uptrend, but the last 24 hours have introduced fresh headline risk after Advent and Stripe abandoned their $50 billion pursuit of PayPal.
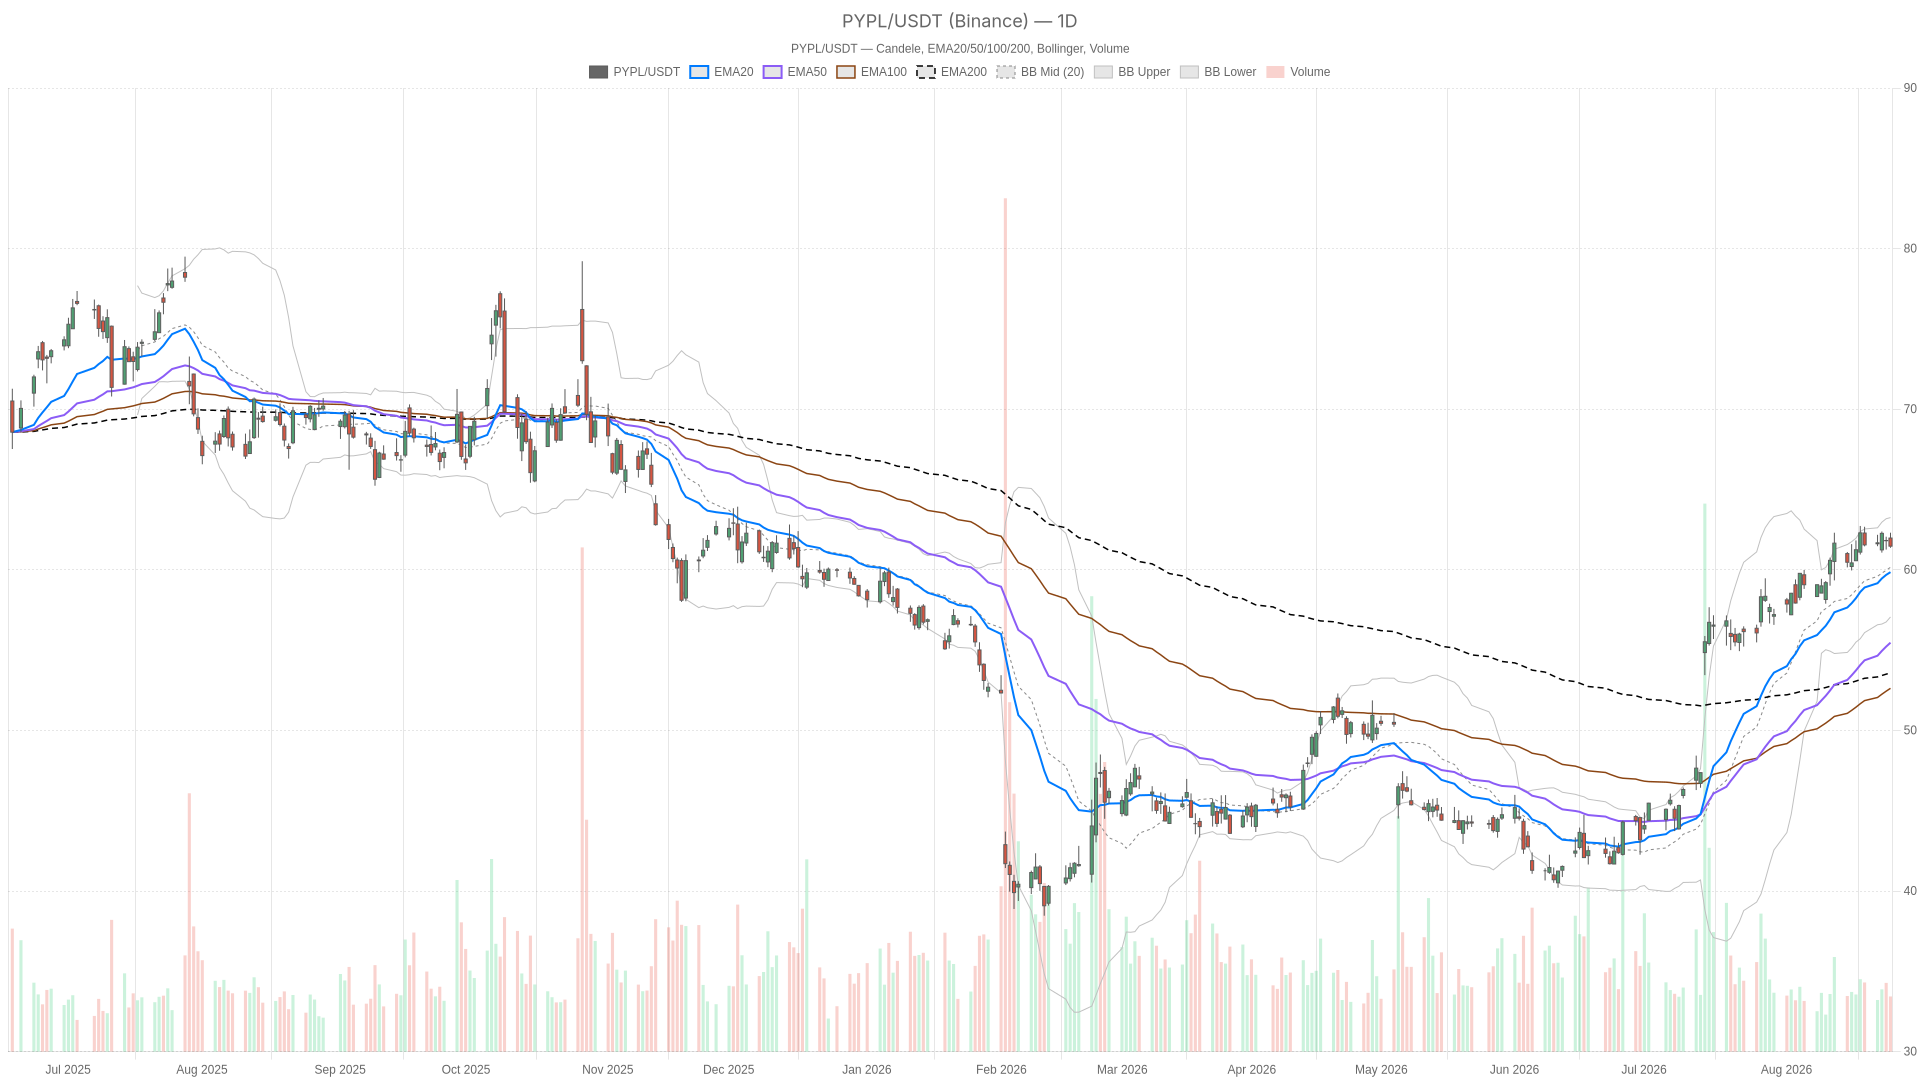 PYPL — daily chart with candlesticks, EMA20/EMA50 and volume.
Key takeaways
- PYPL closed at 61.47 on the daily chart, below the session pivot of 61.72.
- The daily trend remains bullish, with price above the EMA20 at 59.85, the EMA50 at 55.46, and the EMA200 at 53.58.
- Daily RSI14 at 65.54 and a negative MACD histogram of -0.29 suggest momentum is cooling.
- Intraday H1 and 15-minute signals lean neutral-to-soft, with price below their short-term EMAs.
- Advent and Stripe have reportedly abandoned their $50 billion pursuit of PayPal, removing a takeover catalyst.
PayPal Stock Price Action and Trend Structure
PayPal stock remains in a durable bullish uptrend on the daily chart, even after settling below the session’s pivot point. On the daily timeframe, PYPL closed at 61.47 after trading between 61.37 and 62.31, below the pivot of 61.72.
Meanwhile, the broader trend is constructive. Price sits above the EMA20 at 59.85, the EMA50 at 55.46, and the EMA200 at 53.58. This stacked structure confirms a bullish regime that has been building over recent months.
The daily RSI14 reads 65.54, firm but not yet stretched into extreme overbought territory. However, the MACD tells a slightly different story. Its line sits at 2.17 against a signal line of 2.46, producing a negative histogram of -0.29. That divergence suggests momentum is decelerating even as the trend remains intact. In other words, the rally is not broken, but it is catching its breath.
Bollinger Bands show the mid-band at 60.16, with the upper band at 63.25 and the lower band at 57.06. Price recently pushed toward the upper region before pulling back toward the midline. That pattern is typical of a strong trend digesting recent gains rather than reversing outright. Daily ATR14 stands at 1.38, indicating moderate but not extreme volatility for now.
PayPal Stock Intraday Signals Turn Cautious
PayPal stock’s intraday picture is more cautious than the daily trend. The H1 regime reads neutral, with RSI14 at 41.72 and a MACD histogram of -0.07, both leaning toward the softer side.
Price at 61.45 is trading below the H1 EMA20 at 61.72 and the EMA50 at 61.52. However, it remains well above the EMA200 at 58.37. That mismatch between short-term weakness and long-term strength is the core tension in this setup.
At the same time, the 15-minute chart mirrors the same short-term hesitation. RSI14 sits at 40.51 and MACD is essentially flat at -0.10. Price at 61.45 trades below its EMA20 at 61.57 and EMA50 at 61.71, though below the EMA200 at 61.48.
Therefore, both intraday timeframes point toward consolidation rather than continuation, at least for now. The 15m pivot structure places price between support at 61.37 and the pivot point at 61.52. That tight range reflects indecision heading into the next session.
Bullish Scenario for PayPal Stock
The bullish scenario for PayPal stock rests on the daily trend holding firm. If price defends the EMA20 near 59.85 and reclaims the daily pivot at 61.72, a push toward resistance at 62.06 (R1) becomes plausible. A further move toward the upper Bollinger Band at 63.25 would follow.
Meanwhile, a recovery in the H1 MACD back above zero would also help. RSI stabilizing above 50 on both intraday timeframes would confirm that the pullback was a pause within a larger bullish structure. It would suggest the move is not the start of a deeper correction.
Bearish Risks for PayPal Stock
The bearish scenario for PayPal stock centers on a break below the daily EMA20 and the S1 support at 61.12. Should that level fail, the daily MACD histogram’s negative reading could deepen.
In that scenario, price could test the Bollinger mid-band at 60.16, and potentially extend toward the EMA50 at 55.46. The collapse of the Advent-Stripe buyout talks adds an extra layer of headline risk. It removes a catalyst that had been lifting shares independent of underlying fundamentals.
In contrast to the calm daily trend, this news-driven uncertainty could accelerate any short-term slide if intraday weakness persists.
Volatility, Positioning, and the Path Ahead for PayPal Stock
PayPal stock remains structurally bullish on the daily chart, but the hourly and 15-minute pictures show clear signs of short-term fatigue. This is a case of conflicting signals across timeframes rather than a unified breakdown.
Notably, the loss of takeover speculation combined with broader macro uncertainty around the Fed’s Jackson Hole commentary adds a layer of volatility. Traders should not ignore that risk. With daily ATR at 1.38 and intraday ranges compressing, the next few sessions should clarify the picture. The market will show whether this is a healthy pause within an uptrend or the early signs of a more meaningful pullback.
Overall, positioning around key levels like the daily pivot at 61.72 and support at 61.12 will likely determine which scenario plays out first.
FAQ
Is PayPal stock still in an uptrend?
Yes. On the daily chart, PYPL trades above the EMA20 at 59.85, the EMA50 at 55.46, and the EMA200 at 53.58, which confirms a durable bullish regime.
What support levels should traders watch on PYPL?
Key support sits at S1 at 61.12, followed by the daily EMA20 near 59.85 and the Bollinger mid-band at 60.16. A deeper pullback could extend toward the EMA50 at 55.46.
What resistance levels matter for PayPal stock?
The daily pivot at 61.72 is the first hurdle. Above that, resistance appears at R1 at 62.06 and the upper Bollinger Band at 63.25.
Why is short-term momentum cooling?
The daily MACD histogram is negative at -0.29, while H1 and 15-minute RSI readings sit below 50. The abandoned Advent-Stripe $50 billion buyout pursuit also removed a speculative catalyst.
Disclaimer: This article is for informational purposes only and does not constitute financial advice, an investment recommendation, or a solicitation to buy or sell any financial instrument or cryptocurrency. The analysis provided is not indicative of future results. Investing in crypto assets and financial markets carries a high risk of capital loss. Always do your own research (DYOR) and consult a qualified financial advisor before making any decision.
Article produced with the assistance of artificial intelligence and reviewed by the editorial team.



 English (US) ·