
 1 month ago
22
1 month ago
22
The price of the frog-themed meme coin Pepe (PEPE) has consolidated within a price range in the past few days.
Its price movements, assessed on a daily chart, reveal the formation of a horizontal channel within which the meme coin has traded since July 15.
Pepe’s Bulls and Bears Engage in a Tussle
A horizontal channel is formed when an asset’s price trends within a range for a period of time. This happens when a relative balance between buying and selling pressures prevents its price from trending strongly in either direction.
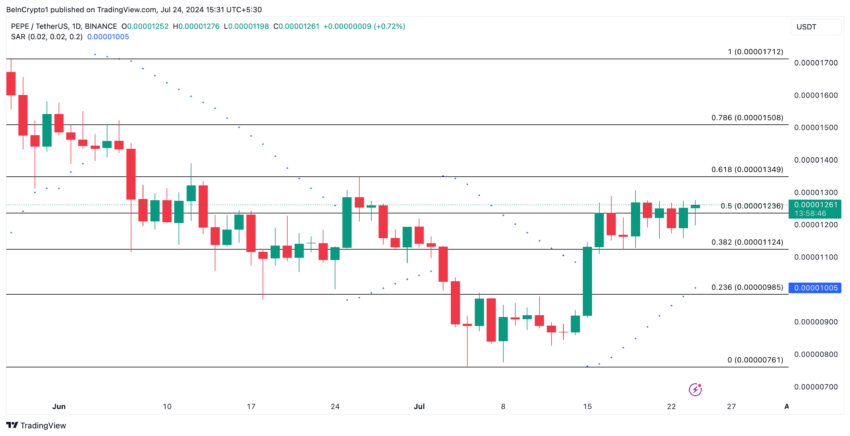
The upper line of this channel forms resistance, while the lower line forms support. Since it began to trend within this channel on July 15, PEPE has faced resistance at $0.000012 and found support at $0.000011.
 PEPE Daily Analysis. Source: TradingView
On-chain, there has been a notable decline in the demand for PEPE among market participants. IntoTheBlock’s data reveals a 41% drop in daily active addresses in the past seven days. During the same period, the daily count of new addresses that have been created to trade the meme coin has decreased by 43%.
Read More: 5 Best Pepe (PEPE) Wallets for Beginners and Experienced Users
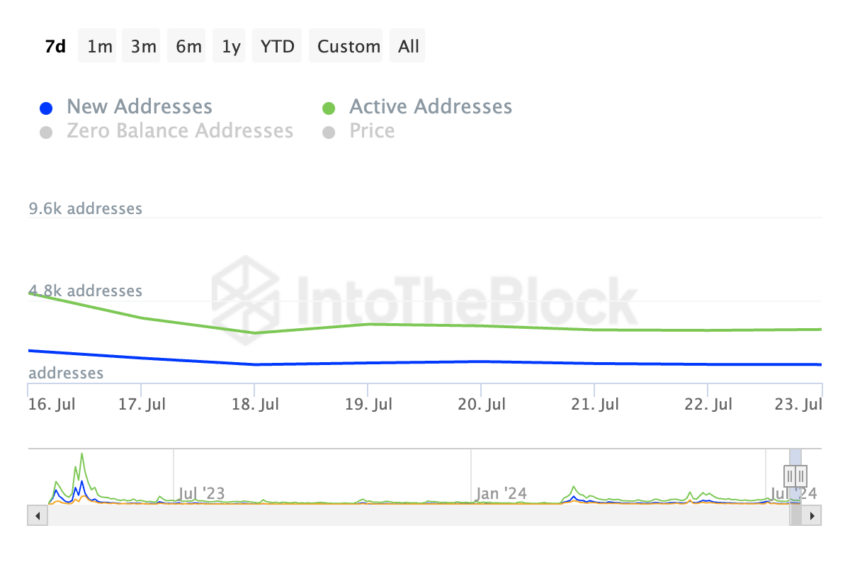 PEPE Daily Active Addresses. Source: IntoTheBlock
Further, as the token trades sideways, PEPE whales have reduced their exposure. This is reflected in the drop in the number of large transactions involving the meme coin in the last week.
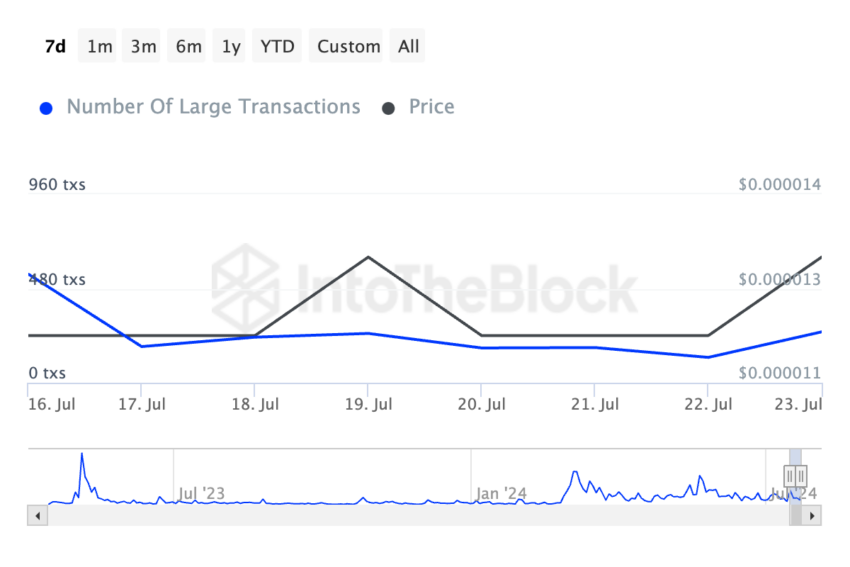 PEPE Number of Large Transactions. Source: IntoTheBlock
Large transactions are those where the transferred amount exceeds $100,000. According to IntoTheBlock, the daily count of PEPE transactions that have exceeded $100,000 has declined by 51% in the past seven days.
PEPE Price Prediction: A Break Above Resistance is Possible
PEPE may break through its current resistance level of $0.000012 if fueled by the persistent bullish sentiment in the market. This bullish bias can be gleaned from readings from its Parabolic Stop and Reverse (SAR) indicator. At press time, the dots of this indicator lie under PEPE’s price.
An asset’s Parabolic SAR indicator tracks its price trends and identifies potential reversal points. When its dots rest under an asset’s price, it is a bullish signal. It indicates that an uptrend is likely and that traders may consider holding or buying the asset.
If PEPE breaks above resistance, its next price target will be $0.000013.
Read More: Pepe (PEPE) Price Prediction 2024/2025/2030
 PEPE Daily Analysis. Source: TradingView
At press time, the altcoin trades close to support. If the bulls fail to defend this level, the meme coin’s price will fall to $0.0000098.
The post PEPE Holds Sideways Trend Amid Falling Demand in Meme Coins appeared first on BeInCrypto.


 English (US) ·