
 3 days ago
15
3 days ago
15
Pi Network (PI) is under heavy pressure, down more than 9% in the last 24 hours and 29% over the past week. Its market cap has dropped to $5.5 billion, a sharp fall from its $19 billion peak at the end of February.
Technical indicators show sellers are in full control, with no strong signs of momentum returning yet. As PI tests key support levels, the coming days could be critical in determining whether it stabilizes—or continues its slide.
Pi Network DMI Shows Sellers Are In Full Control
Pi Network’s DMI chart shows that its ADX has climbed to 34.99 from 25.1 just a day ago, signaling a strong increase in trend strength. The ADX, or Average Directional Index, measures the intensity of a trend without indicating its direction.
Values above 25 suggest a strong trend is forming, and readings over 30 confirm it. With ADX now nearing 35, Pi Network is firmly in trending territory—but it’s important to identify the direction of that trend.
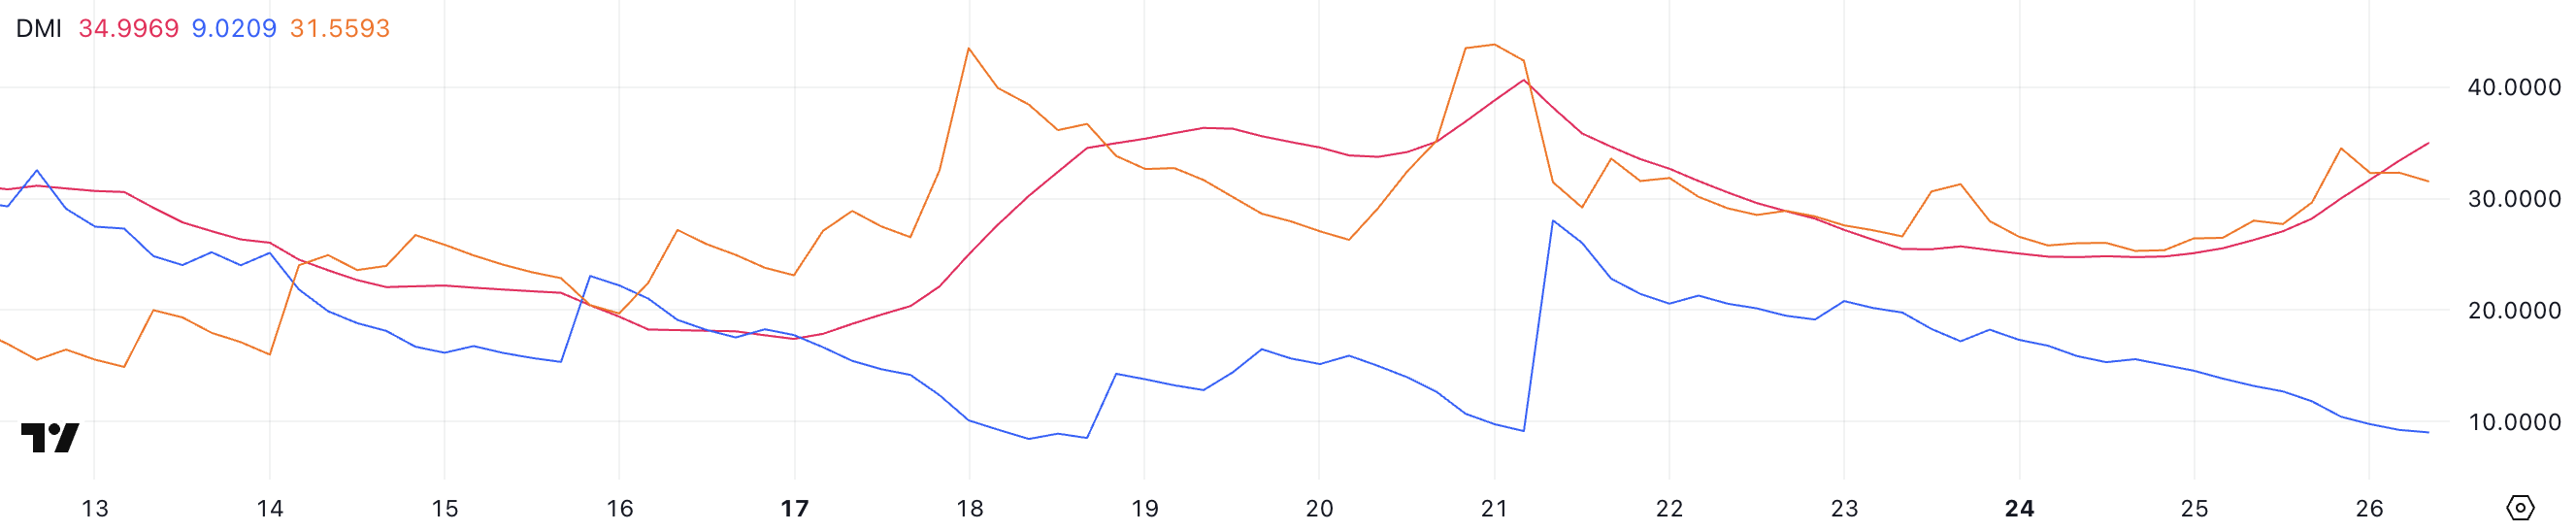 PI DMI. Source: TradingView.
Currently, the -DI (Directional Indicator for bearish pressure) has risen to 31.55 from 25.31, while the +DI (bullish pressure) has dropped to 9 from 15.59. This widening gap between the two confirms that the downtrend is strengthening, as an analyst recently reviewed why PI wasn’t listed on Binance and Coinbase.
Despite the sharp rise in trend strength shown by the ADX, the declining +DI and rising -DI indicate sellers remain in full control. Unless the trend reverses soon, Pi Network could continue to face further downside pressure in the short term.
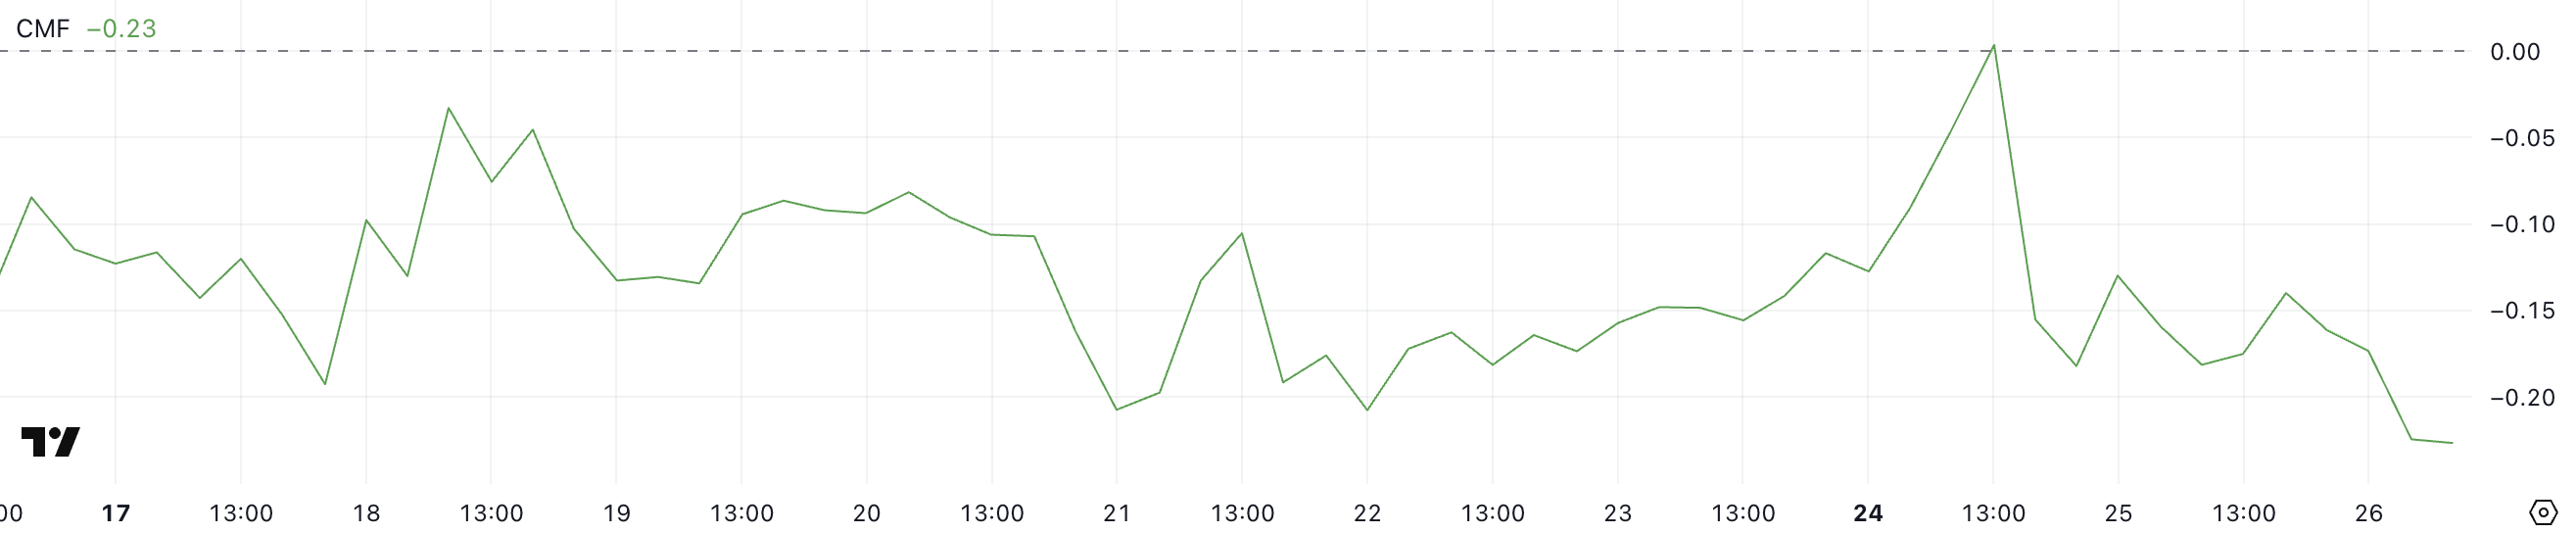
PI Lacks a Strong Momentum
Pi Network’s Chaikin Money Flow (CMF) is currently at -0.23, a notable drop from 0 just two days ago. The CMF is a volume-weighted indicator that measures buying and selling pressure over a set period, typically 20 or 21 days.
Values above 0 suggest accumulation (buying pressure), while values below 0 indicate distribution (selling pressure). The further from zero, the stronger the pressure in that direction.
 PI CMF. Source: TradingView.
With a reading of -0.23, Pi Network’s CMF is at its lowest level ever, showing heavy and persistent outflows. Notably, the indicator hasn’t turned positive since March 15—nearly 15 days ago—highlighting sustained selling activity.
This deep negative value signals a strong bearish bias, suggesting that capital is consistently leaving the market. Unless CMF begins to recover, the ongoing distribution phase could continue to weigh on Pi Network’s price.
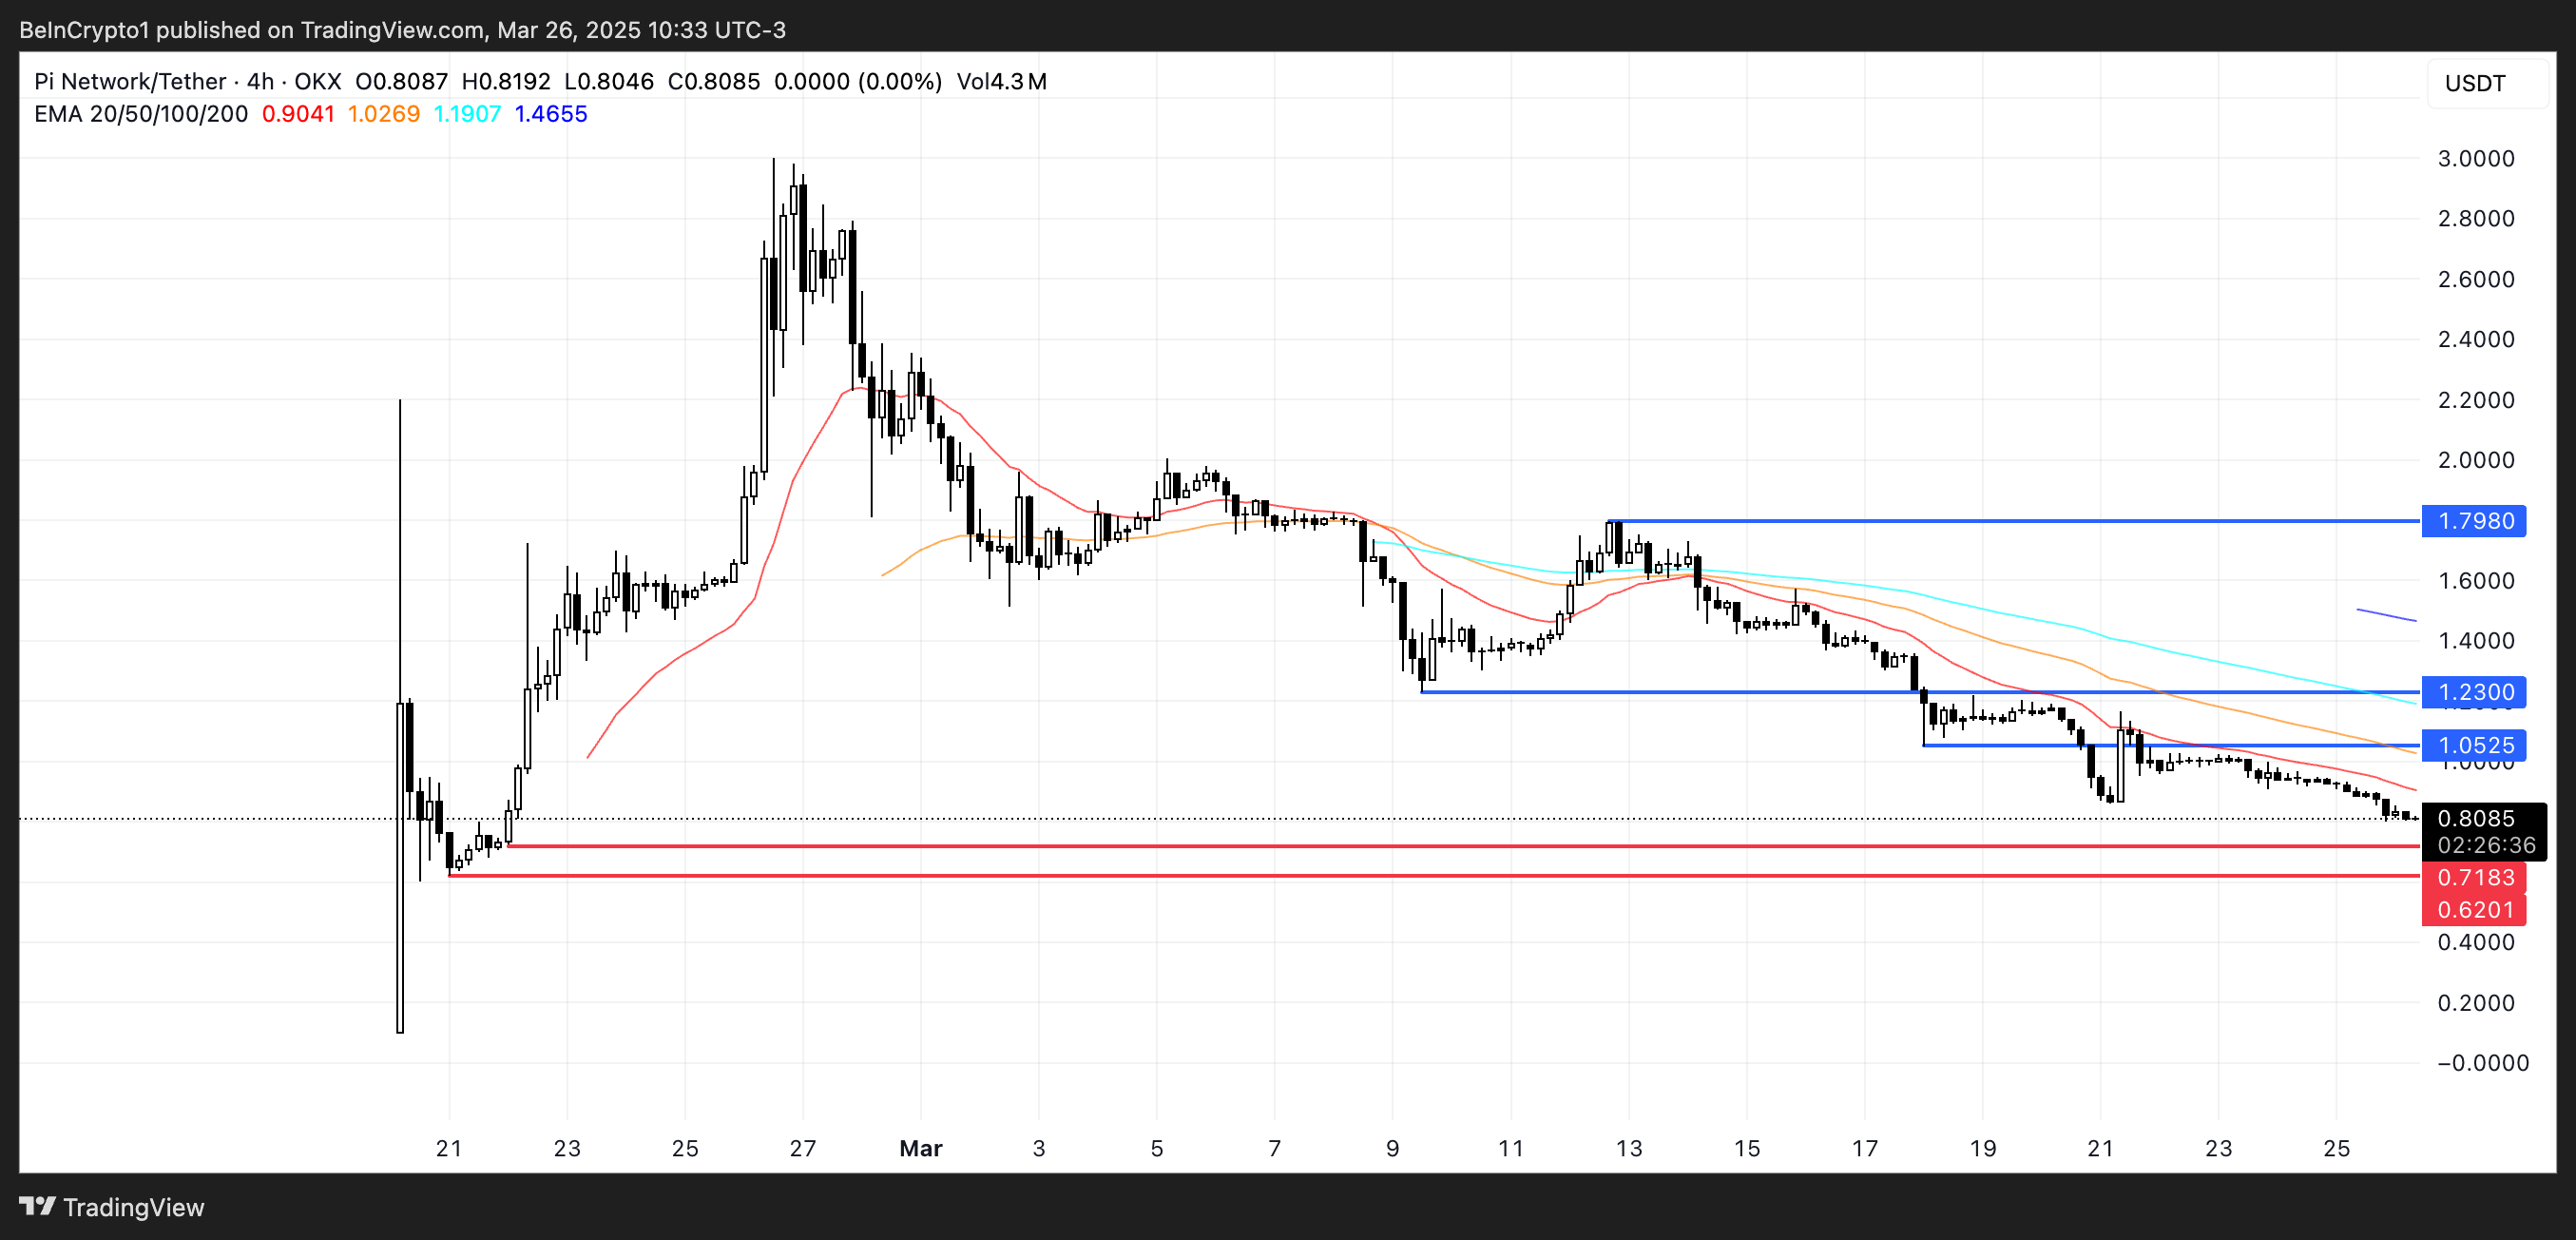
Can Pi Network Drop Below $0.70 Soon?
Pi Network price chart shows a critical support level at $0.718, which has held the price up in recent sessions.
If this level is lost, it could trigger a sharper drop toward $0.62, marking the lowest price since February 21.
 PI Price Analysis. Source: TradingView.
On the flip side, if Pi Network manages to reverse its trend and regain momentum, the first key resistance to watch is at $1.05. A breakout above that could open the path toward $1.23, and if bullish sentiment returns, the price could climb as high as $1.79.
That would represent a potential 54% upside from current levels, but it would require a strong shift in momentum and renewed market hype.
The post Pi Network (PI) Faces Heavy Selling Pressure Amid Another 10% Drop appeared first on BeInCrypto.


 English (US) ·