
 3 weeks ago
52
3 weeks ago
52

American Airlines Group, Inc. stock fell over 5% in premarket trading after Q2 guidance disappointed, despite record quarterly revenue. Management’s weaker-than-anticipated profit outlook for Q3 and the full year now dominates price action, with technicals across all timeframes reinforcing the bearish case.
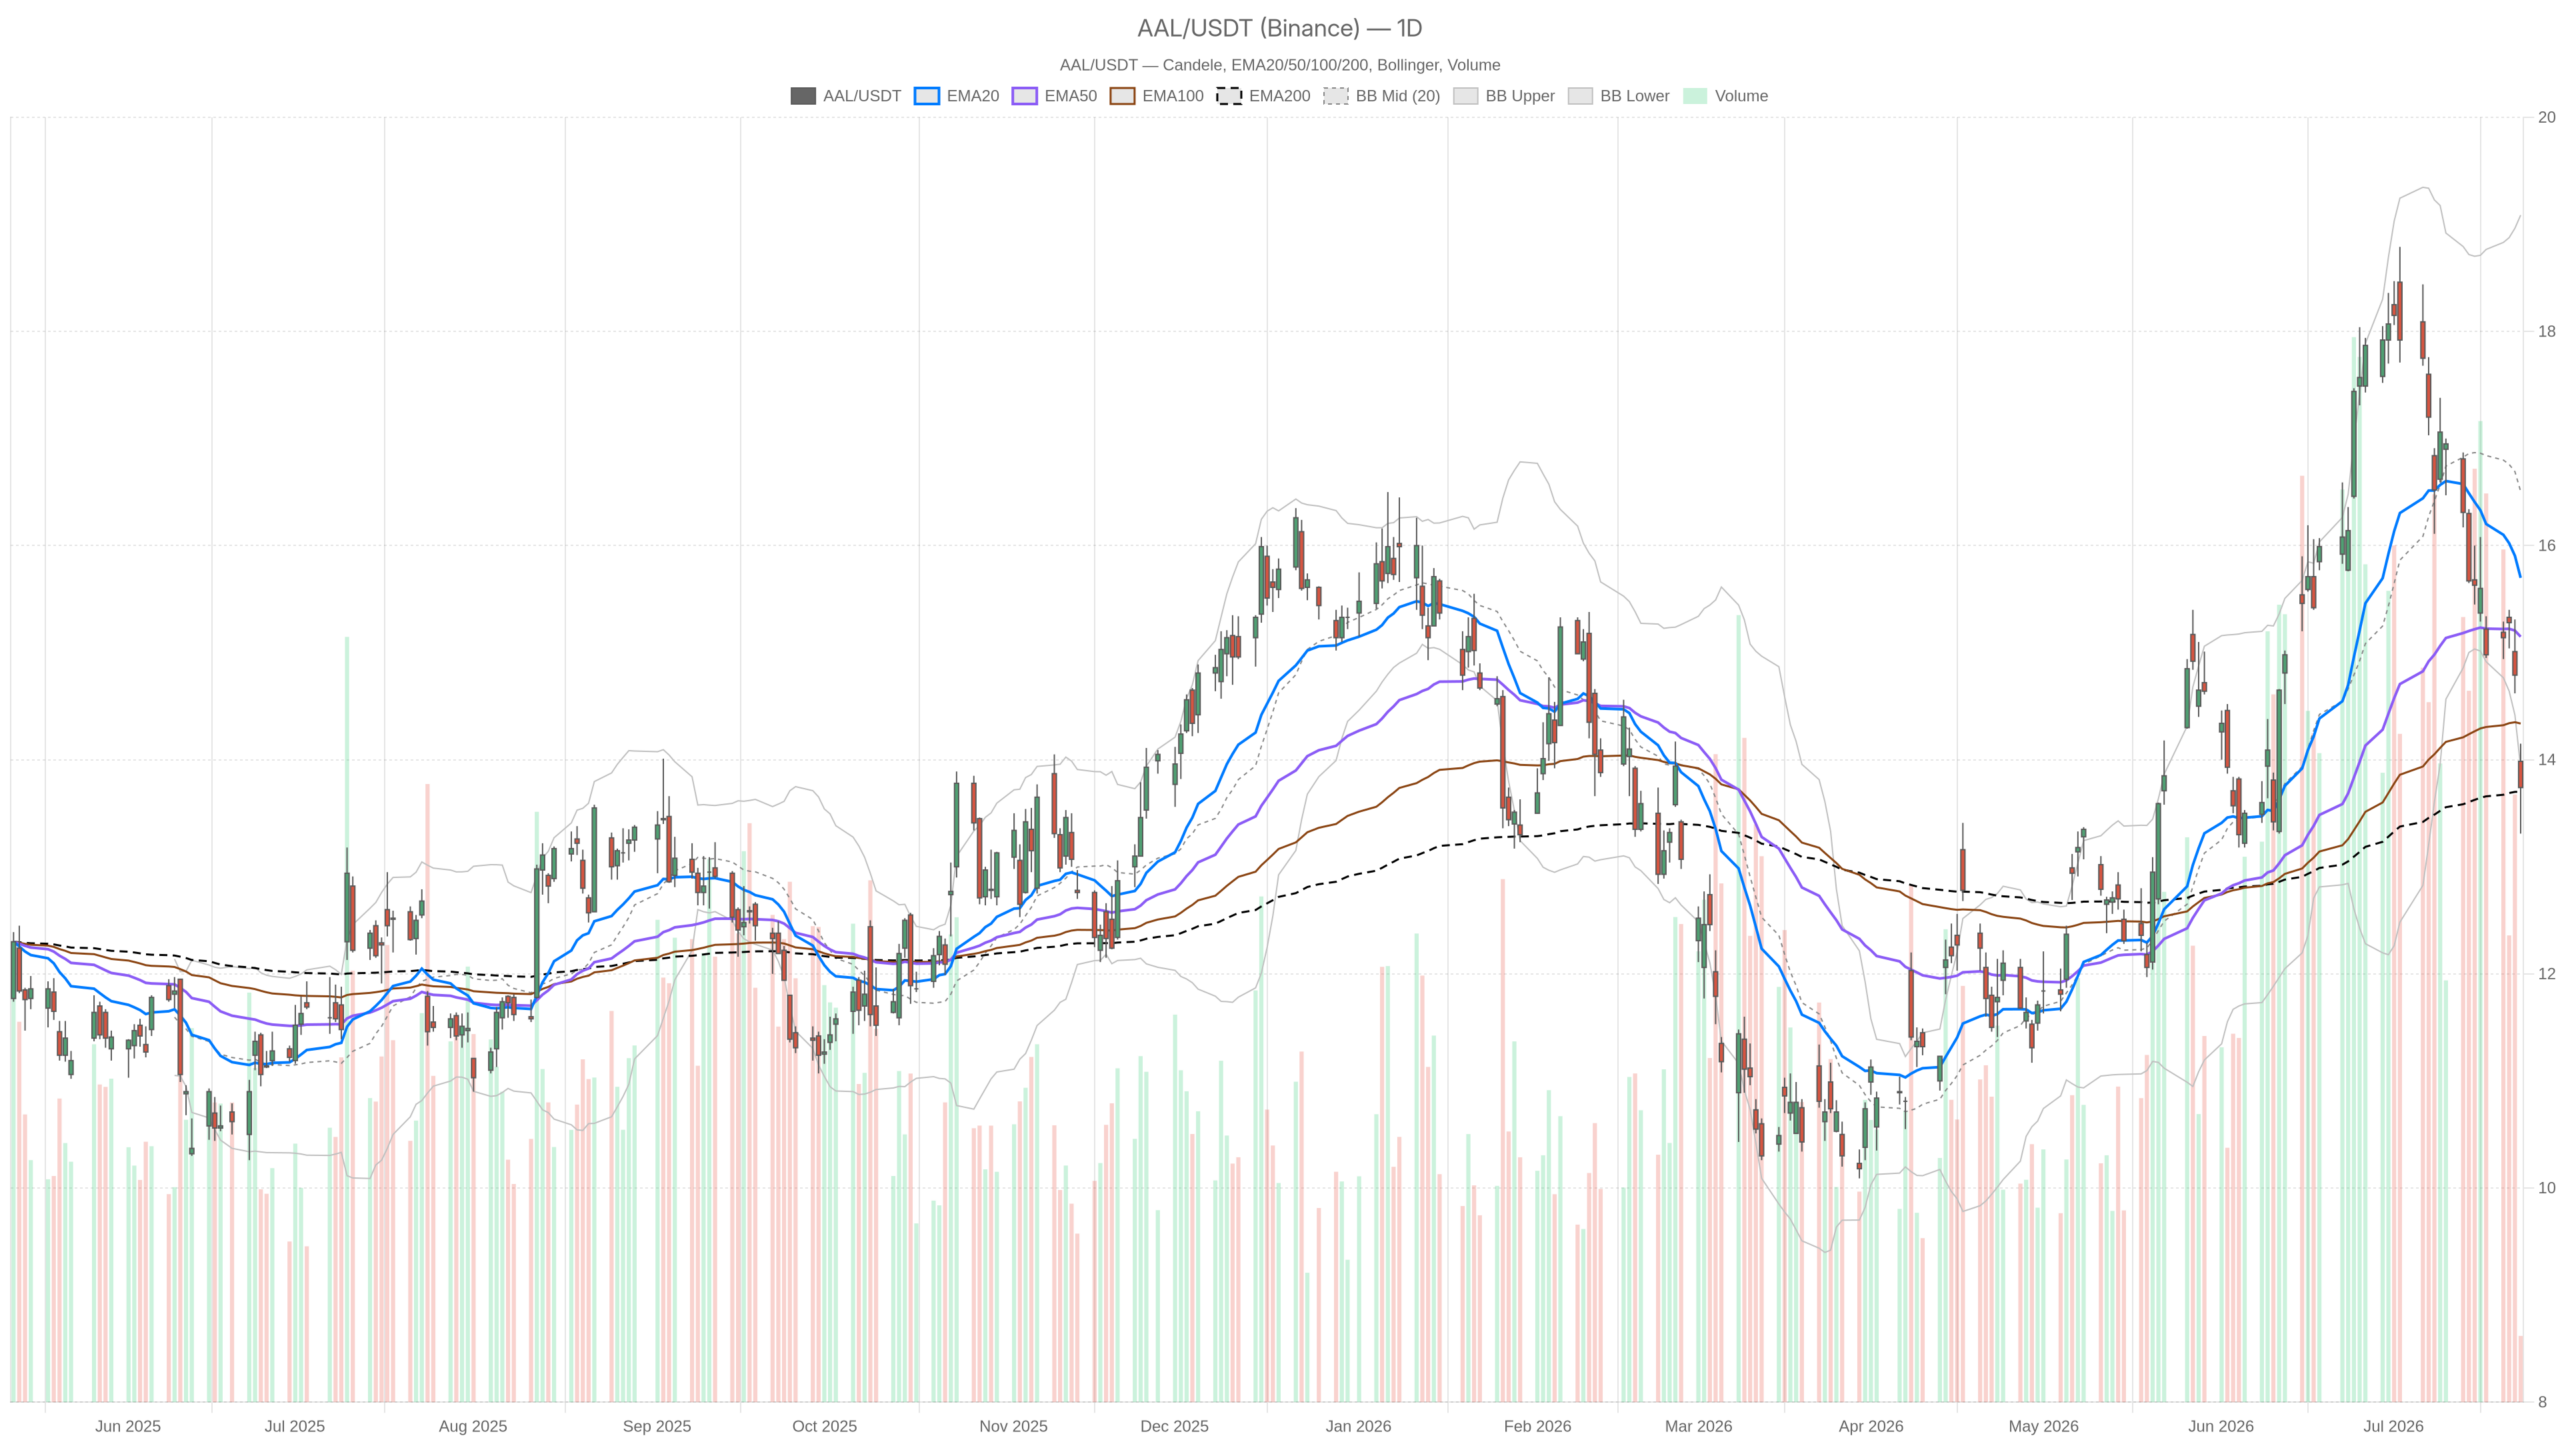 AAL — daily chart with candlesticks, EMA20/EMA50 and volume.
Key takeaways
- AAL closed at $13.74 on July 23, well below its EMA20 at $15.70 and EMA50 at $15.15.
- Daily RSI sits at 31.2, approaching oversold territory but not yet signaling capitulation.
- MACD is deeply negative, with the line at -0.24 versus the signal at 0.18 and a histogram of -0.42.
- Management issued weaker-than-expected Q3 and full-year profit guidance, triggering the selloff.
- Critical support lies at the daily S1 level of $13.32; a break below would sharply deteriorate the technical picture.
Daily Chart Defines the Bearish Bias
The daily chart for American Airlines Group, Inc. stock defines a deteriorating bias, with price trading well below short- and medium-term moving averages. AAL closed at $13.74 on July 23, beneath its EMA20 at $15.70 and EMA50 at $15.15. Price is essentially hugging the EMA200 at $13.70 — a level that has temporarily arrested the decline. However, with trend averages stacked firmly above current price, the structural message is unambiguous: this stock is in a downtrend.
Daily Momentum: Oversold but Not Yet Bullish
Daily momentum on American Airlines Group, Inc. stock is deteriorating but has not reached capitulation levels that would signal a reliable reversal. The daily RSI stands at 31.2, approaching oversold territory without yet reaching an extreme. Notably, oversold readings alone do not constitute a buy signal — especially in a deteriorating narrative driven by forward guidance cuts.
The MACD tells a more damaging story: the line at -0.24 sits well below the signal at 0.18, producing a histogram of -0.42. That is a firmly negative momentum reading with no sign of convergence. Meanwhile, Bollinger Bands add important context. The mid-band sits at $16.51, far above current price, while the lower band is at $13.93. AAL closed beneath that lower band — a positioning that reflects acute selling pressure rather than a consolidation base.
The daily ATR of $0.74 confirms elevated volatility relative to the stock’s recent price level. Daily pivot analysis places the pivot point at $13.73, with R1 at $14.16 and S1 at $13.32. The stock is essentially sitting on the pivot, making $13.32 the nearest meaningful downside reference. A clean break below that level would carry genuine technical significance.
Hourly Chart Confirms the Bearish Regime
The hourly chart confirms the bearish regime, with every major moving average on American Airlines Group, Inc. stock pointing against any recovery attempt. The 1H timeframe offers no meaningful relief from the daily narrative. On the contrary, it actively reinforces it. Price at $13.74 sits below the H1 EMA20 at $14.46, well below the H1 EMA50 at $15.10, and even further from the H1 EMA200 at $15.74.
The H1 RSI at 28.46 is technically in oversold territory. In isolation, this could hint at a short-term bounce. Yet in context — with the MACD line at -0.47 still below the signal at -0.34 — momentum has not turned. The histogram is slightly negative at -0.13, narrowing but not reversing. Therefore, any oversold reading at the hourly level should be treated as exhaustion rather than a reversal signal.
Hourly Bollinger Bands show the lower band at $13.23, providing a secondary downside reference below the daily S1. The H1 pivot structure is tightly compressed, with R1 at $13.77 and S1 at $13.70. This means the stock is coiled in a narrow range near the session lows.
15-Minute View: Faint Stabilization, Not a Reversal
The 15-minute chart on American Airlines Group, Inc. stock shows faint stabilization, not a directional reversal. A marginal positive signal appears in the MACD histogram, which ticked into positive territory at +0.07. Still, the MACD line at -0.25 remains below the signal at -0.32. This is at best a micro-stabilization rather than a shift in direction.
The 15m RSI at 43.93 is neutral. Price is hugging the upper Bollinger Band at $13.78 on this timeframe, suggesting very short-term compression after the selloff. Overall, the 15-minute chart is compatible with a brief consolidation or minor technical bounce around the $13.70–$13.77 range. It does not, however, challenge the dominant framework established by the daily and hourly readings.
Fundamental Backdrop: Record Revenue, Stubborn Profit Gap
The fundamental backdrop for American Airlines Group, Inc. stock is mixed: record quarterly revenue in Q2 2026 overshadowed by a stubborn profit gap and forward guidance that disappointed. CEO Robert Isom highlighted revenue growth as evidence that commercial initiatives are working. Yet the market punished the stock precisely because forward-looking guidance failed to meet expectations. A revenue record means relatively little if margin expansion is not keeping pace.
The competitive context compounds the challenge. United Airlines generated approximately $3 billion more in profit than American last year. Delta earned roughly $5 billion more. That profitability gap is vast. Closing it requires consistent execution under unpredictable conditions — rising fuel costs, labor pressures, and oil volatility. Until investors see tangible evidence of margin improvement, American Airlines Group, Inc. stock is likely to continue trading at a discount to peers.
Bullish Scenario: What Would Need to Change
A credible bullish reversal in American Airlines Group, Inc. stock would require price to hold above $13.32 and reclaim several technical levels simultaneously. First, a sustained close above $13.93 — the daily lower Bollinger Band — is a necessary first step. Beyond that, the stock must reclaim the EMA200 at $13.70 convincingly and begin compressing the gap toward EMA20 and EMA50.
On the fundamental side, a positive revision to Q3 or full-year guidance could shift the narrative. A meaningful decline in fuel cost pressures would also help. A clear upturn in daily MACD and RSI — moving away from oversold levels without immediately rolling over — would confirm that sellers are exhausting their position. In that scenario, $14.16 R1 becomes the first meaningful upside target.
Bearish Scenario: When the Floor Breaks
If American Airlines Group, Inc. stock loses the $13.32 daily S1 level on a closing basis, the technical picture deteriorates sharply. Below that level, no immediate structural support is visible in the current indicator set. The daily ATR of $0.74 means a single volatile session could cover significant ground. With the MACD deeply negative and price beneath every meaningful EMA, a breakdown would likely accelerate.
The guidance disappointment has already reset investor expectations. Any further macro headwind — renewed fuel cost spikes, weaker consumer demand signals, or a broader market risk-off episode — could extend the selloff well below current levels. The path of least resistance remains firmly lower under this scenario.
Positioning Into Volatility
Positioning in American Airlines Group, Inc. stock carries outsized risk, with the path of least resistance remaining lower until key technical levels are reclaimed. The picture is dominated by a bearish daily structure, a confirming hourly regime, and a fundamental story the market has chosen to read pessimistically — despite record revenue. The faint micro-stabilization on the 15-minute chart offers minimal comfort in this context.
Volatility remains elevated with a daily ATR of $0.74, which is significant for a stock trading below $14. The path of least resistance is lower unless the stock can reclaim the daily lower Bollinger Band and hold it. Until that happens, any bounce should be treated with caution rather than conviction.
FAQ
What caused American Airlines Group, Inc. stock to fall in July 2026?
American Airlines Group, Inc. stock fell more than 5% in premarket trading after management issued weaker-than-anticipated profit guidance for Q3 and the full year. This occurred despite the airline reporting record quarterly revenue in Q2 2026. The guidance miss reset investor expectations and triggered broad selling pressure.
What are the key support levels for AAL stock?
The most critical support level is the daily S1 pivot at $13.32. A secondary downside reference sits at the hourly Bollinger lower band of $13.23. The EMA200 at $13.70 has temporarily arrested the decline but remains under pressure. A daily close below $13.32 would sharply deteriorate the technical picture.
Is American Airlines Group, Inc. stock oversold right now?
The daily RSI stands at 31.2, approaching but not yet at deeply oversold territory. The hourly RSI at 28.46 is technically oversold. However, oversold readings alone do not constitute a buy signal — particularly given the negative MACD configuration and the fundamental headwind from the guidance disappointment.
How does American Airlines’ profitability compare to United and Delta?
United Airlines generated approximately $3 billion more in profit than American last year. Delta earned roughly $5 billion more. This profitability gap remains vast, and closing it requires consistent execution under unpredictable conditions including fuel costs and labor pressures.
Disclaimer: This article is for informational purposes only and does not constitute financial advice, an investment recommendation, or a solicitation to buy or sell any financial instrument or cryptocurrency. The analysis provided is not indicative of future results. Investing in crypto assets and financial markets carries a high risk of capital loss. Always do your own research (DYOR) and consult a qualified financial advisor before making any decision.
Article produced with the assistance of artificial intelligence and reviewed by the editorial team.






 English (US) ·