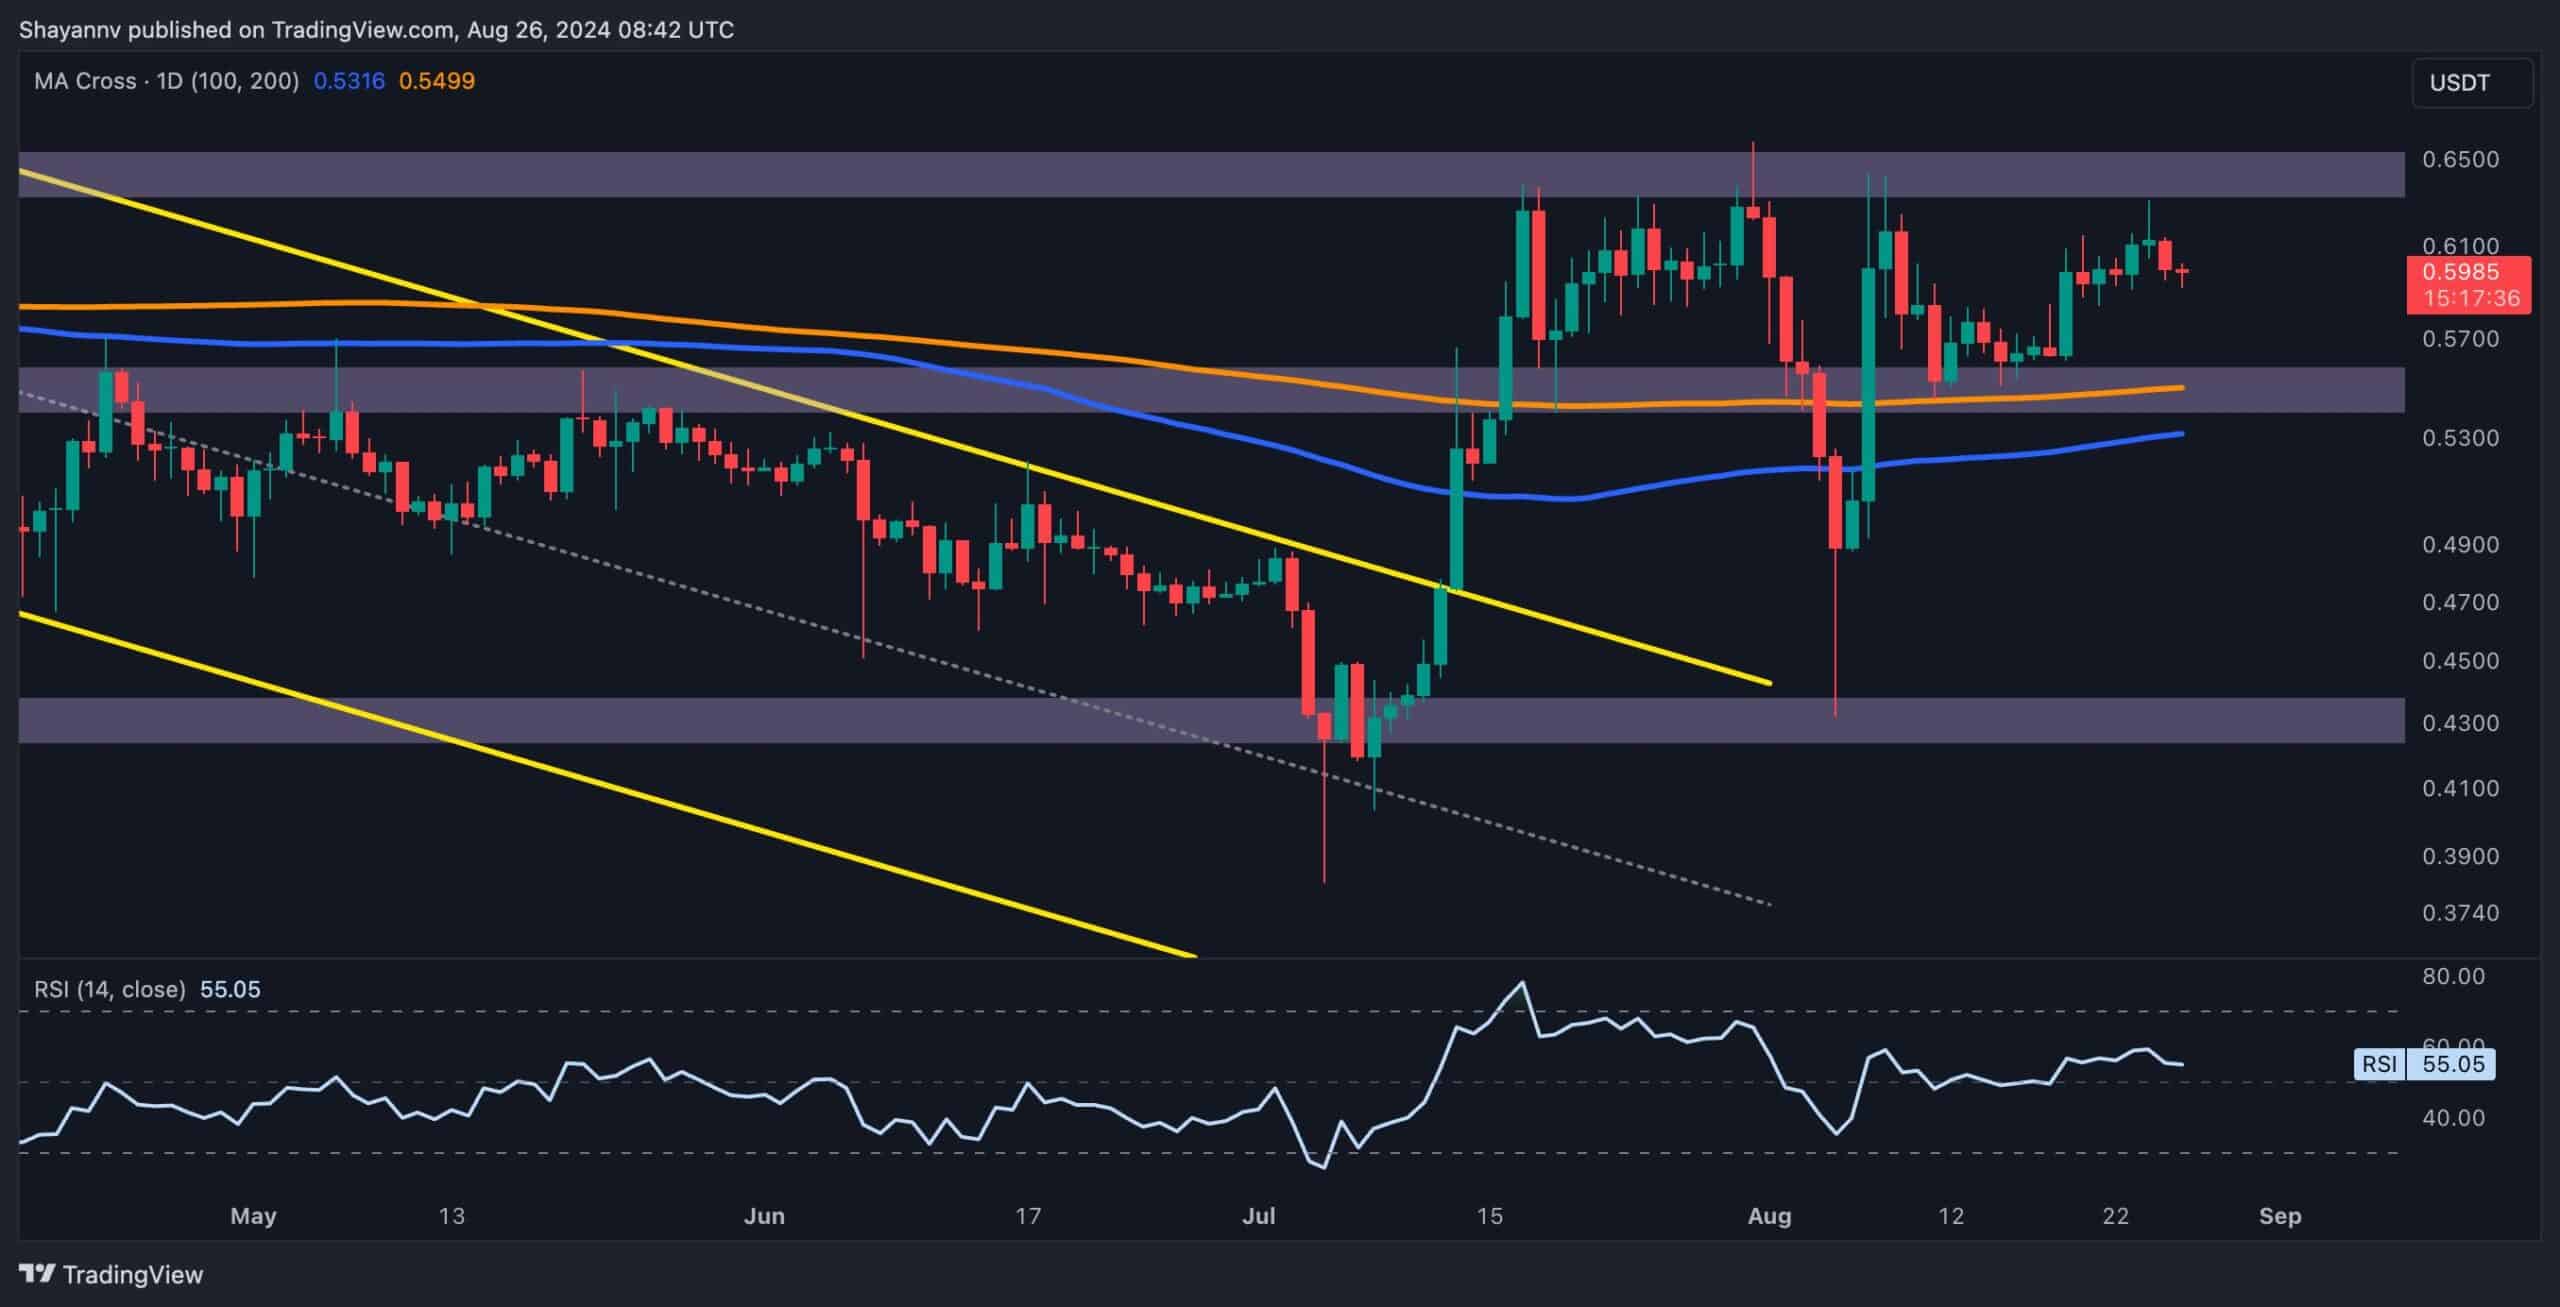
Ripple has recently surged to the critical resistance level of $0.65 following a successful pullback to the broken 200-day moving average.
However, a bearish divergence between the price and the RSI indicator suggests that the current upward momentum may face rejection at this critical resistance level in the coming days.
XRP Analysis
By Shayan
The Daily Chart
A detailed examination of the daily chart reveals that Ripple has experienced a bullish surge after successfully pulling back to the broken 200-day moving average (MA) at $0.55. This price action underscores buyers’ dominance in the market, propelling the XRP price to a critical resistance region around $0.63—a level that has previously rejected the cryptocurrency multiple times.
Ripple now finds itself confined within a tight range, with the $0.63 resistance on the upper end and the 200-day MA at $0.55 as significant support.
Given the bearish divergence between the price and the RSI indicator, a rejection at the $0.63 level is anticipated, potentially leading to a decline toward the lower boundary of the range at $0.55.
 Source: TradingView
The 4-Hour Chart
On the 4-hour chart, XRP surged from the critical region between the 0.5 ($0.52) and 0.618 ($0.48) Fibonacci retracement levels, entering a crucial price range defined by the $0.55 support and the multi-month resistance zone at $0.63.
Currently, it is struggling to break through the upper boundary at $0.63, showing low volatility and weakening bullish momentum. As a result, a short-term rejection is likely, with a potential decline toward the key $0.55 support region.
However, if buying pressure intensifies, Ripple could eventually reclaim the $0.63 resistance level, signaling a significant bullish shift and potentially revitalizing market momentum. The price action in the coming days will be critical in determining Ripple’s short-term trajectory.
 Source: TradingView
The post Ripple Price Analysis: Is XRP on the Verge of an Imminent Correction Below $0.55? appeared first on CryptoPotato.

 2 months ago
36


 English (US) ·