Ripple’s price is experiencing low volatility, stuck between the $0.5 support and resistance near the 200-day moving average at $0.54.
This range-bound movement suggests indecision, with a potential breakout likely determining the next trend.
XRP Analysis
By Shayan
The Daily Chart
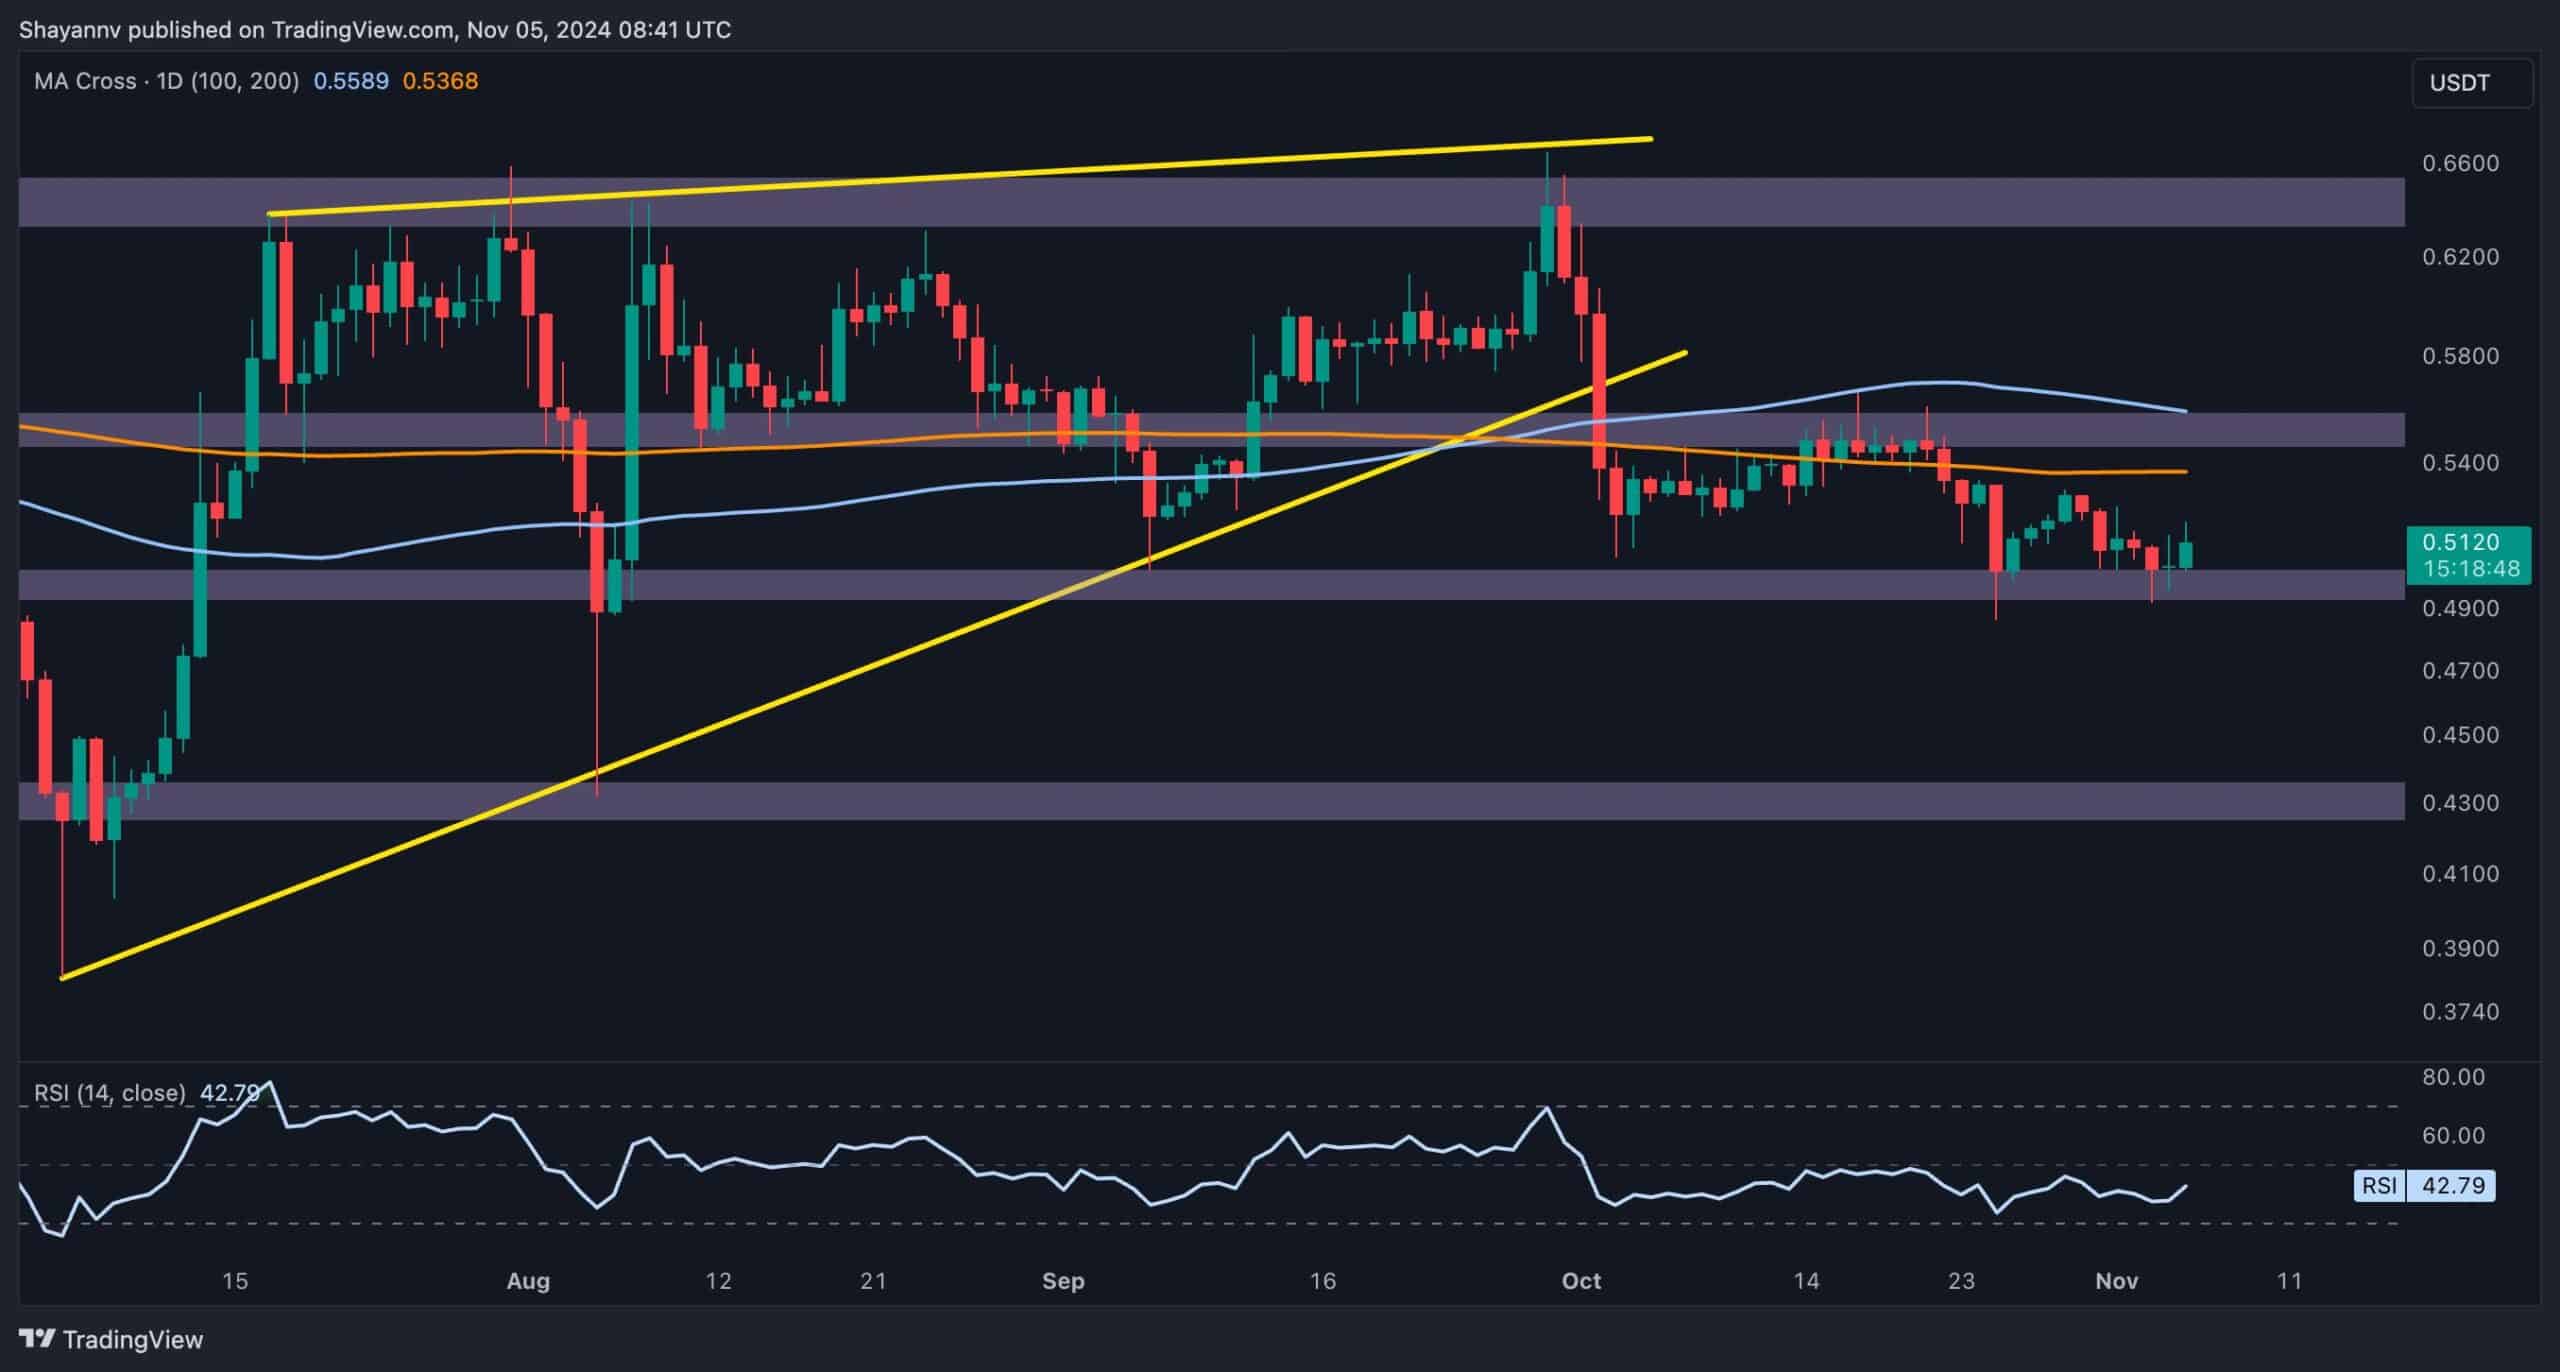
On the daily chart, XRP’s recent rejection at the 200-day moving average of $0.55 led to a decline toward the $0.5 support level. However, trading activity has since slowed, with the price consolidating and displaying minimal volatility near this support region.
Ripple is currently trapped by a critical range between $0.5 (support) and $0.54 (200-day MA resistance), suggesting that the market is awaiting a stronger catalyst to drive the next move. For now, continued consolidation within this range is expected, and a breakout could indicate the direction of XRP’s mid-term trend.
The 4-Hour Chart
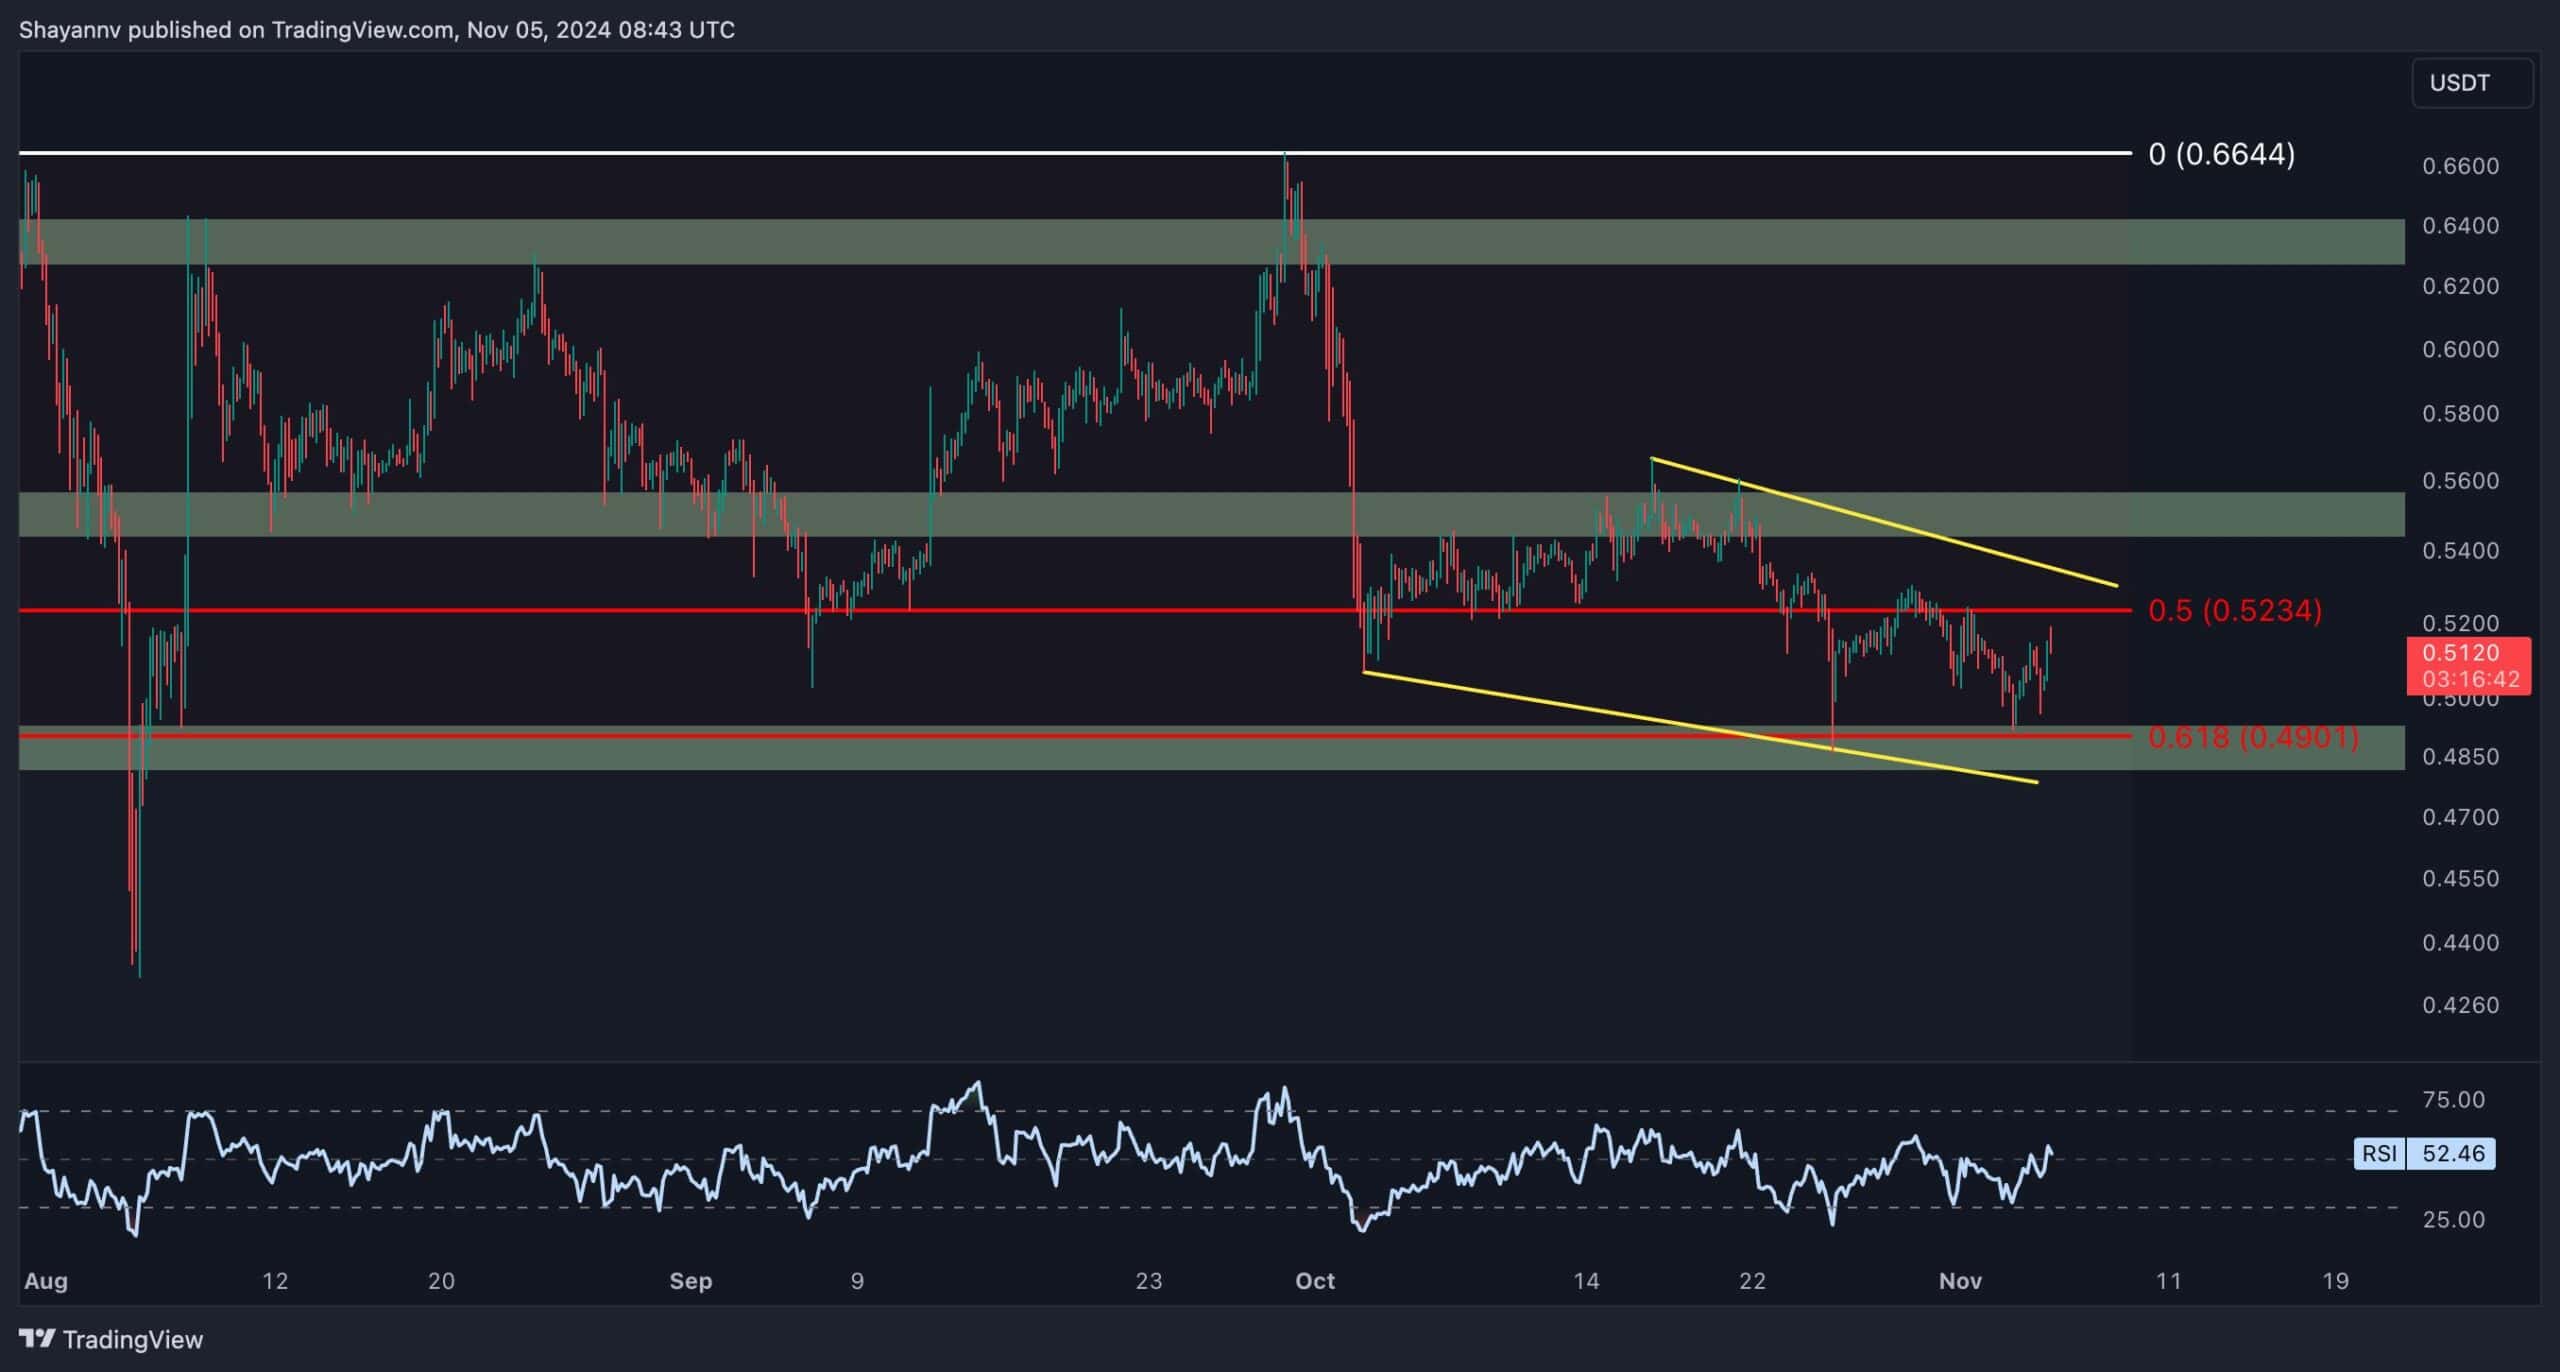
On the 4-hour chart, Ripple’s indecision is evident, with the asset confined to a crucial zone between the 0.5 ($0.52) and 0.618 ($0.49) Fibonacci retracement levels. This narrow price action, coupled with a descending wedge pattern near the $0.5 mark, hints at the potential for a bullish reversal if Ripple can break above the wedge’s upper boundary at $0.54.
Descending wedges often signal a bullish reversal when broken to the upside, but in the absence of sufficient buying pressure, Ripple may remain within the wedge for the short term, continuing its sideways consolidation and reflecting the current standoff between buyers and sellers.
A breakout from the wedge pattern, especially to the upside, could attract renewed buying interest, while a downside break below $0.5 would likely confirm a bearish trend.
The post Ripple Price Analysis: Will XRP Maintain $0.5 After 3.5% Weekly Drop? appeared first on CryptoPotato.

 2 hours ago
6


 English (US) ·