
 3 hours ago
11
3 hours ago
11
The crypto market remains in a defensive posture, with XRP caught in a low-conviction holding pattern. As of August 6, 2026, the Ripple price today sits at $1.05, resting on the daily pivot and just above the lower Bollinger Band — a spot that signals indecision more than trend.
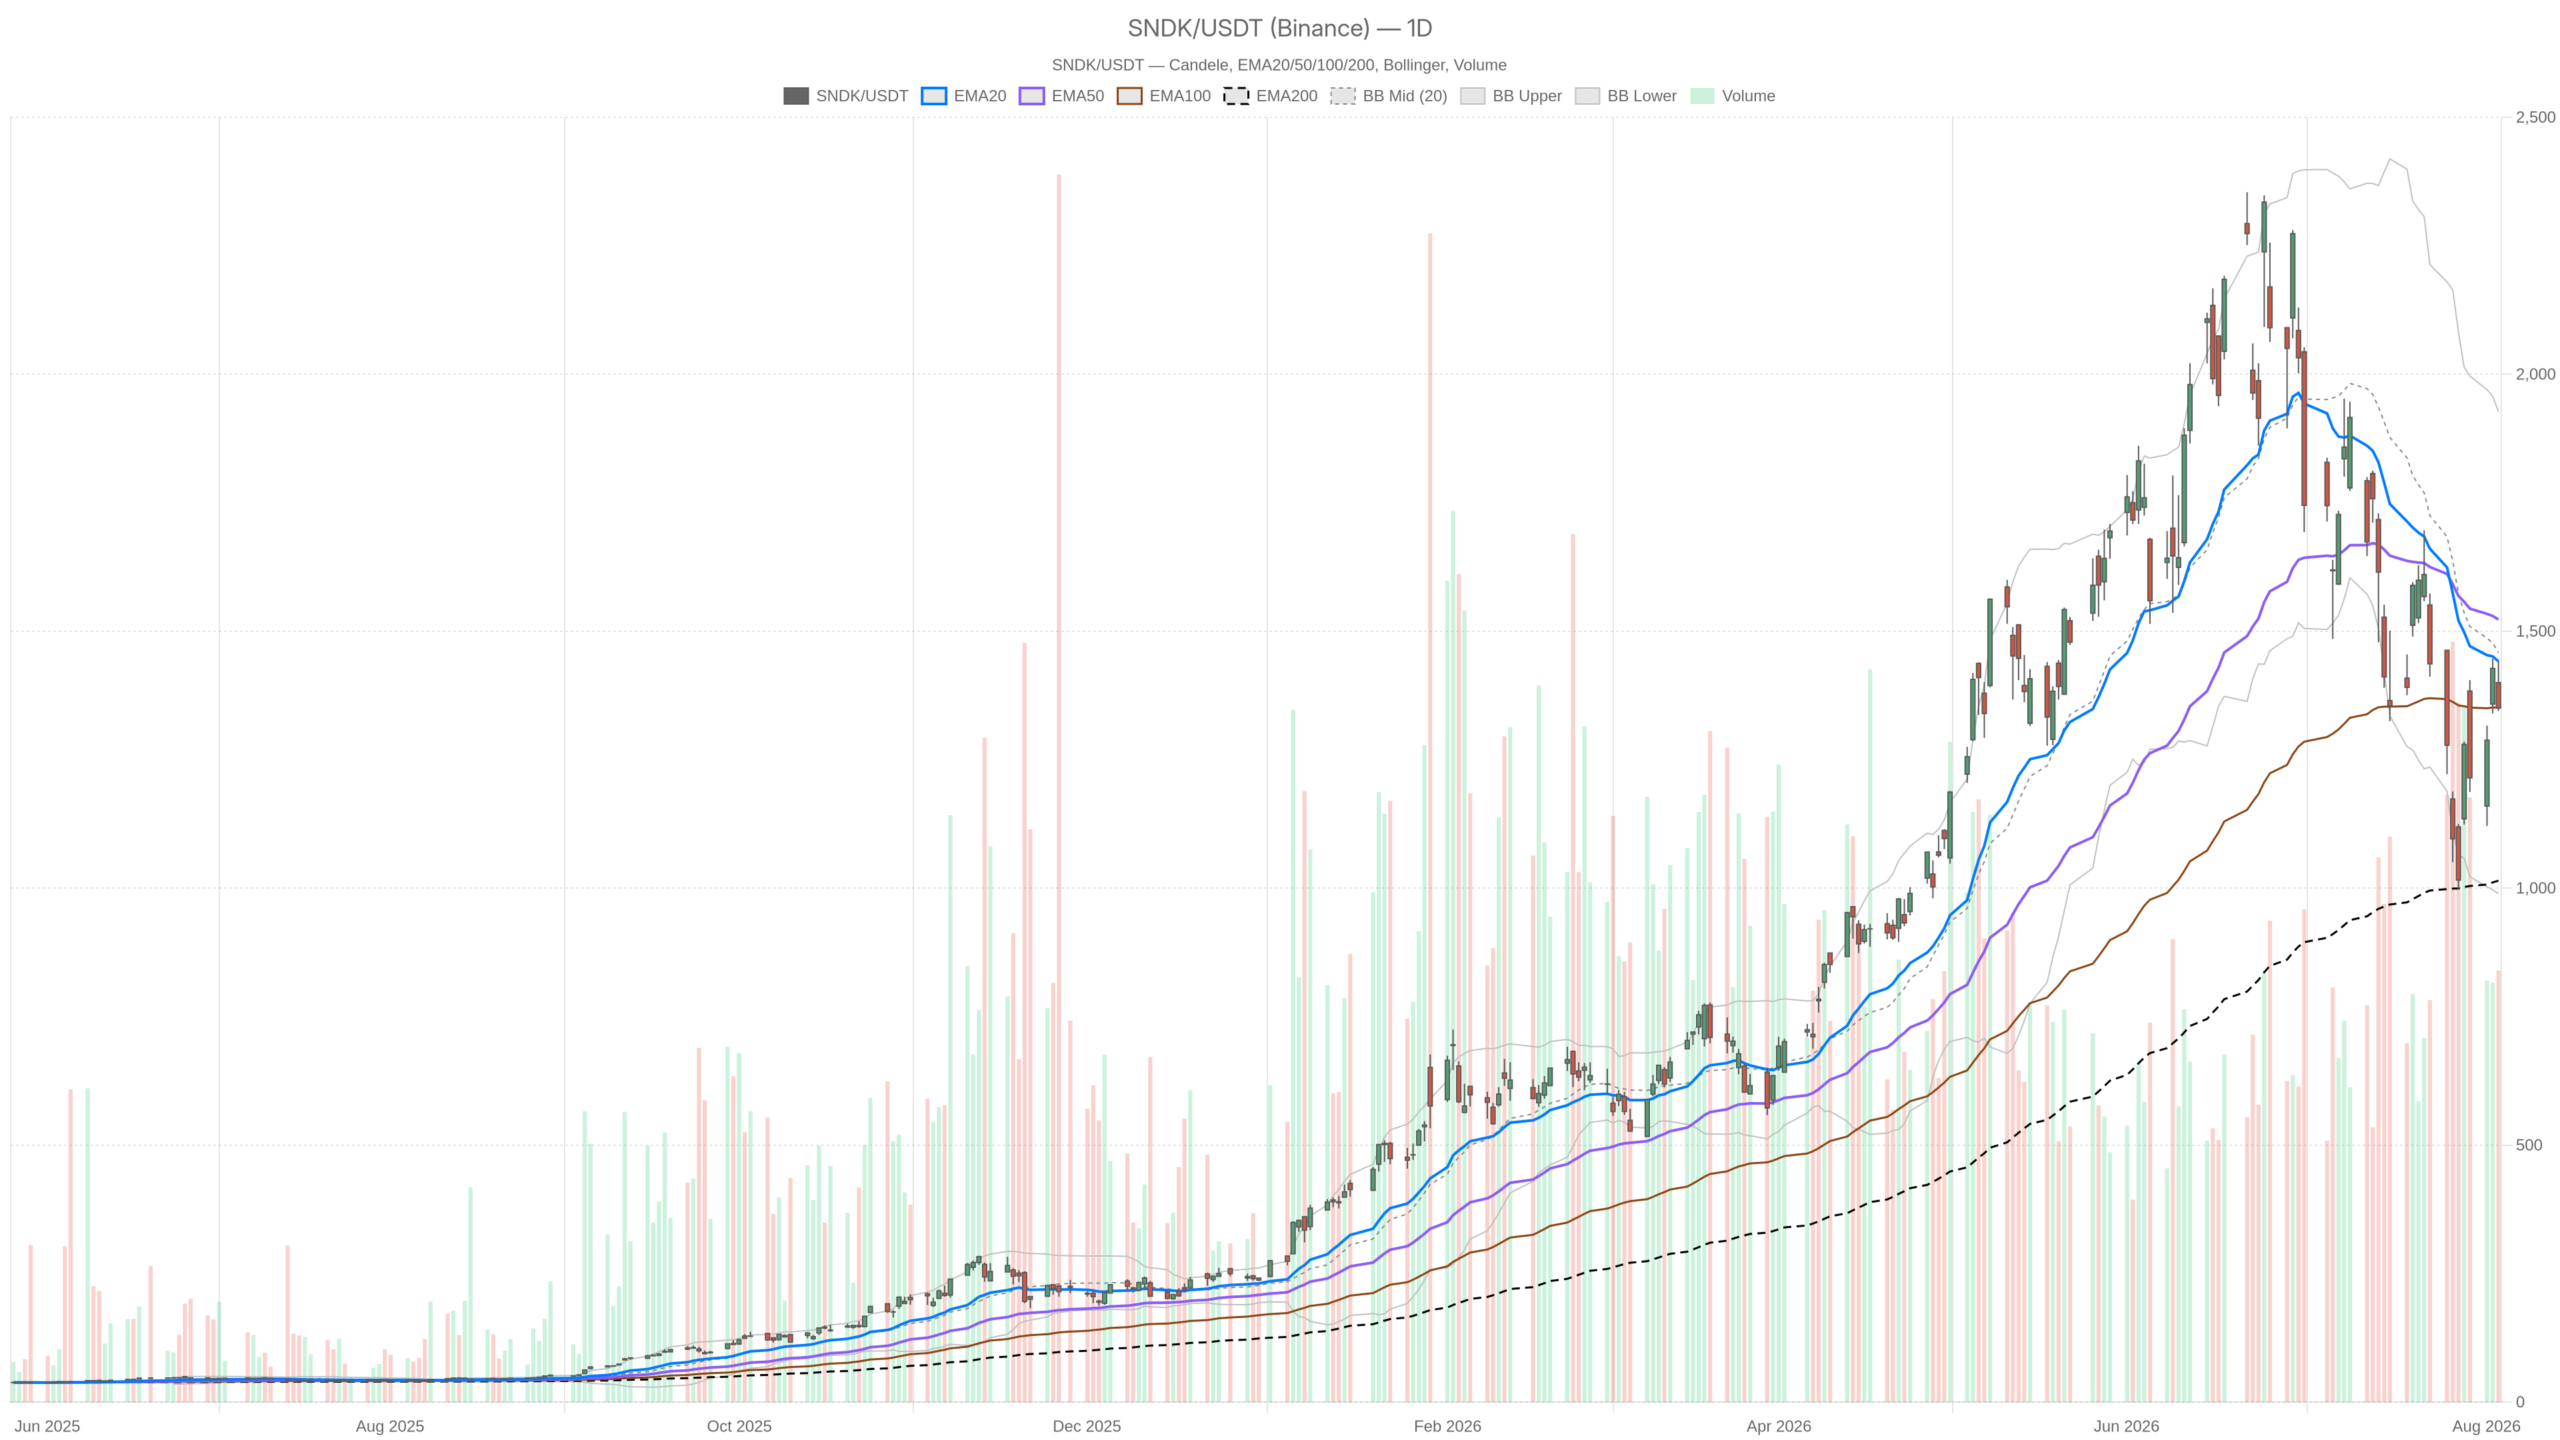
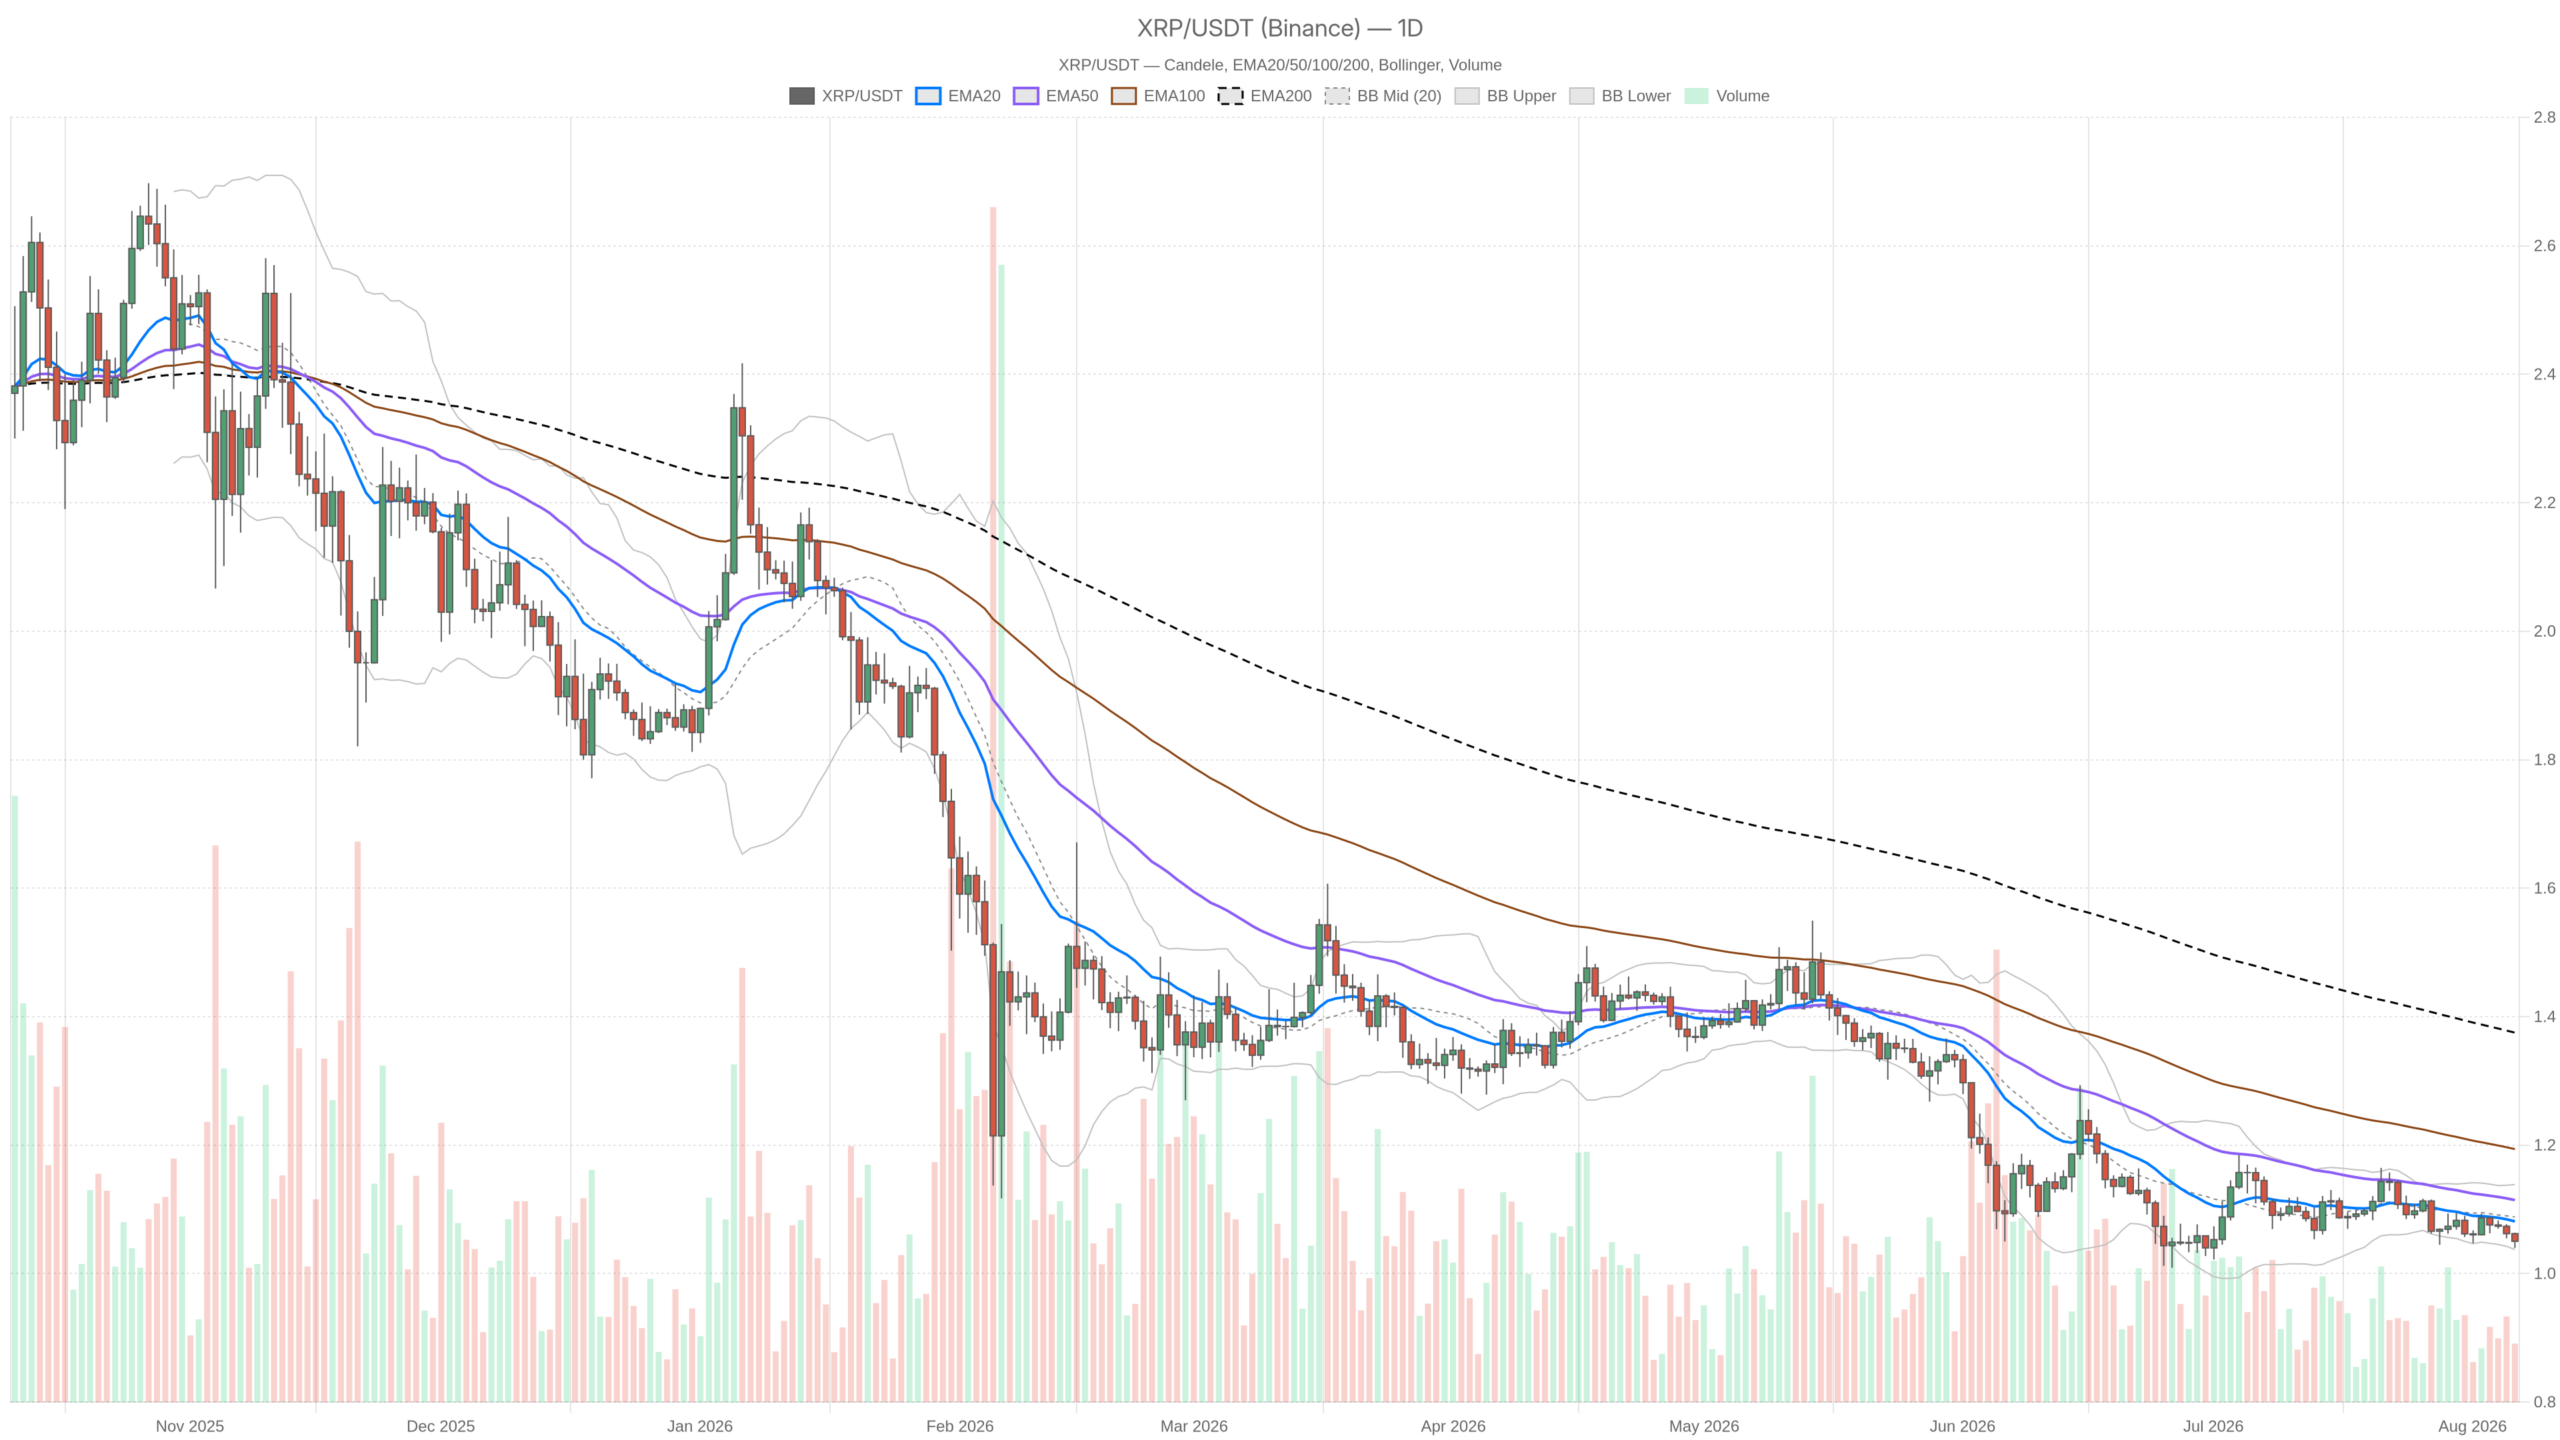 XRP/USDT — daily chart with candlesticks, EMA20/EMA50 and volume.
Key takeaways
- XRP trades at $1.05 on August 6, 2026, sitting near the lower Bollinger Band at $1.04
- Daily EMAs are stacked bearishly: price below 20-EMA ($1.08), 50-EMA ($1.11), and 200-EMA ($1.38)
- Fear & Greed Index at 25 signals Extreme Fear across the crypto market
- BTC dominance at 56.7% shows capital remains concentrated in Bitcoin
- The $1.04–$1.06 range is the critical zone for the next directional signal
The dominant force right now is defensive positioning, not aggressive selling or buying. Bitcoin dominance is parked at 56.7%, according to CoinGecko figures, which means capital is still concentrated in BTC rather than rotating into XRP or other majors. Total crypto market cap sits around $2.29 trillion, up a modest 0.8% over 24 hours. The broader market is not collapsing — it is simply not interested in XRP specifically. Layer on a Fear & Greed reading of 25 (Extreme Fear), and you get a picture of a market that is cautious across the board.
Daily Chart Structure Points to a Bearish Tilt
The daily chart leans bearish with XRP trading below all three key EMAs, yet momentum has stalled rather than accelerated lower. Price at $1.05 is below the 20-EMA ($1.08), the 50-EMA ($1.11), and well below the 200-EMA ($1.38) — a clean stack of resistance layered above current price. That kind of EMA order usually means any bounce has to fight through multiple ceilings before it means anything structurally.
RSI on the daily sits at 40.04 — soft, leaning bearish, but not deep into oversold territory. It is the kind of reading that shows sellers still have the edge without signaling capitulation. MACD backs that up: the line is at -0.01 against a -0.01 signal, with a histogram flattened out at zero. In plain terms, downside momentum has basically stalled. However, that flatness is often the calm before a decision, not a signal by itself.
The Bollinger Bands add useful context: mid-band at $1.09, upper at $1.14, lower at $1.04. Price is hugging the lower band, which in a bearish regime usually means the trend is still intact. Any bounce toward the mid-band would need real buying pressure to hold. Daily ATR is $0.03 — modest volatility given the size of the broader decline, suggesting the market is coiling rather than trending hard. The daily pivot at $1.05 with resistance at $1.06 (R1) and support at $1.04 (S1) frames a tight box that price has been reluctant to leave.
Hourly Momentum Confirms the Fade, But Only Just
The 1-hour chart shows compression without conviction, mirroring the daily softness across RSI, MACD, and Bollinger Bands. EMA20, EMA50, and EMA200 are all bunched between $1.06 and $1.07 — that kind of compression usually means the intraday trend has gone flat, with no clear directional push from either side. RSI at 39.9 mirrors the daily reading almost exactly, reinforcing that the soft momentum is not just a daily artifact.
MACD on the hourly is essentially dead flat at zero across line, signal, and histogram. There is no momentum story to tell here — buyers and sellers are in a standoff. The hourly Bollinger Bands (mid $1.06, upper $1.08, lower $1.04) and the tight pivot range ($1.05 pivot, $1.06 resistance, $1.05 support) all point to the same conclusion: XRP is compressed into a narrow band and waiting for a trigger. Meanwhile, ATR at $0.01 confirms just how quiet things have gotten intraday.
15-Minute Chart: Execution Context Only
The 15-minute timeframe offers no directional signal — it is useful only for timing entries around the broader daily and hourly structure. Zooming in, RSI actually ticks up to 45.99, a touch stronger than the hourly and daily readings, hinting at a minor short-term stabilization attempt. That said, EMA20, EMA50, and EMA200 are all clustered around $1.05–$1.06, and ATR has essentially dropped to zero. This is not a timeframe to build a directional thesis on.
Bullish and Bearish Scenarios
XRP needs to reclaim $1.06–$1.08 to build a bullish case, while a break below $1.04 would confirm continued downside pressure. The bullish scenario requires price to push through the $1.06 hourly resistance and the daily EMA20 at $1.08, ideally closing above the $1.09 Bollinger mid-band. That would need RSI on the daily to climb back above 50, showing momentum has genuinely flipped rather than just stabilized. Until that happens, any move up into the $1.06–$1.08 zone should be treated as a test of resistance inside a still-bearish structure.
The bearish case is more straightforward given where the indicators currently sit. A rejection at the $1.06 pivot resistance followed by a break below the $1.04 support — which lines up with both the daily S1 and the lower Bollinger Band — would open the door to further downside, especially with MACD still sitting in negative territory on the daily. That view gets invalidated if XRP manages to hold above $1.04 on repeated tests and starts printing higher lows on the hourly chart. That would be the first real sign sellers are losing control.
Where This Leaves Traders
Right now, the Ripple price today reflects a market that is neither trending hard nor showing signs of an imminent reversal — it is compressed, cautious, and waiting. The Extreme Fear reading of 25 adds another layer of context: markets at these sentiment extremes can either keep bleeding or set up sharp reversals, and there is no reliable way to know in advance which one this is. Daily volatility (ATR $0.03) is low relative to the size of the prior move down from the 200-EMA.
With BTC dominance holding above 56% and total market cap only marginally higher over 24 hours, there is little evidence yet of the kind of rotation into XRP that would support a sustained bullish case. That could change quickly if broader risk appetite shifts. For now, however, the weight of evidence across daily and hourly timeframes leans toward a market that needs to prove itself before any bullish scenario gains real traction. Anyone watching this setup should pay close attention to how price behaves around the $1.04–$1.06 range — that is where the next real signal is likely to come from.
FAQ
What is the Ripple price today?
As of August 6, 2026, XRP is trading at $1.05, sitting on the daily pivot and just above the lower Bollinger Band at $1.04. The price reflects a period of low-volatility consolidation following a broader decline from the 200-EMA around $1.38.
Is XRP in a bearish trend?
The daily chart structure leans bearish. XRP trades below the 20-EMA ($1.08), 50-EMA ($1.11), and 200-EMA ($1.38), forming a clean stack of resistance. However, downside momentum has stalled rather than accelerated, with MACD flat near zero and RSI at 40.04 — soft but not oversold.
What are the key support and resistance levels for XRP?
Immediate support sits at $1.04, which aligns with the daily S1 pivot and the lower Bollinger Band. Resistance is layered at $1.06 (hourly and R1 pivot), $1.08 (daily 20-EMA), and $1.09 (Bollinger mid-band). A break below $1.04 would open the door to further downside, while a close above $1.08–$1.09 would be the first structural sign of a potential reversal.
What does the Fear & Greed Index of 25 mean for XRP?
A reading of 25 places the market in Extreme Fear territory. Historically, such sentiment extremes can precede either continued bleeding or sharp reversals, and the outcome depends on whether broader capital flows begin rotating out of BTC — currently at 56.7% dominance — and into assets like XRP.
Disclaimer: This article is for informational purposes only and does not constitute financial advice, an investment recommendation, or a solicitation to buy or sell any financial instrument or cryptocurrency. The analysis provided is not indicative of future results. Investing in crypto assets and financial markets carries a high risk of capital loss. Always do your own research (DYOR) and consult a qualified financial advisor before making any decision.
Article produced with the assistance of artificial intelligence and reviewed by the editorial team.




 English (US) ·